Free Statistics

of Irreproducible Research!

Author's title

Author*The author of this computation has been verified*
R Software Modulerwasp_Simple Regression Y ~ X.wasp
Title produced by softwareSimple Linear Regression
Date of computationSat, 17 Dec 2016 21:26:10 +0100
Cite this page as followsStatistical Computations at FreeStatistics.org, Office for Research Development and Education, URL https://freestatistics.org/blog/index.php?v=date/2016/Dec/17/t14820065194i7bakkwl8ae765.htm/, Retrieved Thu, 02 May 2024 12:14:29 +0000
Statistical Computations at FreeStatistics.org, Office for Research Development and Education, URL https://freestatistics.org/blog/index.php?pk=300944, Retrieved Thu, 02 May 2024 12:14:29 +0000
QR Codes:

Original text written by user:
IsPrivate?No (this computation is public)
User-defined keywords
Estimated Impact60
Family? (F = Feedback message, R = changed R code, M = changed R Module, P = changed Parameters, D = changed Data)
-       [Simple Linear Regression] [] [2016-12-17 20:26:10] [cefbb908b49c27a772f794ee9c78d9df] [Current]
Feedback Forum

Post a new message
Dataseries X:
3	3
4	5
5	5
4	5
4	4
5	5
5	5
5	5
5	5
5	5
5	5
4	NA
4	5
4	5
4	4
5	3
4	5
NA	NA
4	5
5	5
4	4
4	2
4	5
4	5
5	5
5	4
4	4
4	4
5	5
5	5
3	4
5	5
4	5
5	1
4	5
5	4
4	4
4	4
4	5
5	4
4	4
5	5
3	3
5	5
4	5
5	2
5	3
4	4
3	4
NA	NA
5	5
5	5
4	4
3	5
4	5
4	4
4	5
4	4
4	4
4	3
5	4
4	4
4	5
4	4
4	4
4	4
5	4
4	4
4	2
4	4
4	4
4	5
3	3
4	3
4	5
4	4
5	5
4	4
4	4
5	5
5	5
3	5
5	4
4	5
5	5
5	2
5	5
5	5
4	5
4	5
2	4
4	4
5	5
5	4
5	5
4	5
4	5
4	4
5	5
4	5
NA	3
5	5
4	5
4	5
4	4
5	4
4	4
5	4
4	5
4	5
4	4
3	3
4	3
3	4
5	4
4	5
4	5
5	4
4	5
4	5
4	4
4	4
4	5
4	5
5	5
4	5
4	4
5	5
4	3
4	5
3	5
4	4
4	5
4	4
3	4
4	4
5	4
3	2
4	4
5	5
5	5
4	5
4	4
4	4
3	5
5	5
4	5
5	5
4	5
4	5
3	4
4	5
4	3
4	3
3	4
4	4
5	3
3	3
4	5
5	5
4	5
5	5
4	5
4	5
4	5
4	5
4	4
3	4
4	2


Summary of computational transaction
Raw Input view raw input (R code)
Raw Outputview raw output of R engine
Computing time7 seconds
R ServerBig Analytics Cloud Computing Center

\begin{tabular}{lllllllll}
\hline
Summary of computational transaction \tabularnewline
Raw Input view raw input (R code)  \tabularnewline
Raw Outputview raw output of R engine  \tabularnewline
Computing time7 seconds \tabularnewline
R ServerBig Analytics Cloud Computing Center \tabularnewline
\hline
\end{tabular}
%Source: https://freestatistics.org/blog/index.php?pk=300944&T=0

[TABLE]
[ROW]
Summary of computational transaction[/C][/ROW] [ROW]Raw Input[/C] view raw input (R code) [/C][/ROW] [ROW]Raw Output[/C]view raw output of R engine [/C][/ROW] [ROW]Computing time[/C]7 seconds[/C][/ROW] [ROW]R Server[/C]Big Analytics Cloud Computing Center[/C][/ROW] [/TABLE] Source: https://freestatistics.org/blog/index.php?pk=300944&T=0

Globally Unique Identifier (entire table): ba.freestatistics.org/blog/index.php?pk=300944&T=0

As an alternative you can also use a QR Code:  

The GUIDs for individual cells are displayed in the table below:

Summary of computational transaction
Raw Input view raw input (R code)
Raw Outputview raw output of R engine
Computing time7 seconds
R ServerBig Analytics Cloud Computing Center


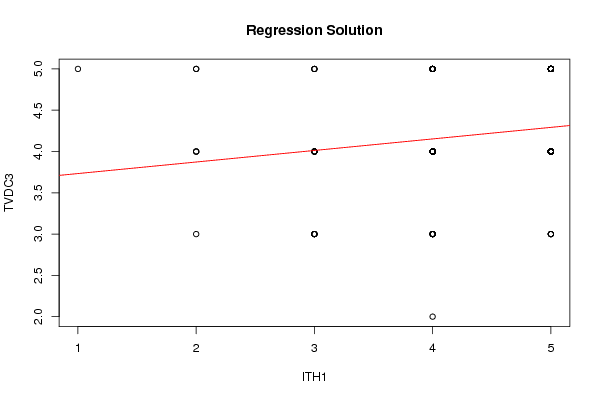
Linear Regression Model
Y ~ X
coefficients:
EstimateStd. Errort valuePr(>|t|)
(Intercept)3.5930.26113.7780
X0.140.0592.3690.019
- - -
Residual Std. Err. 0.628 on 163 df
Multiple R-sq. 0.033
95% CI Multiple R-sq. [0, 0.12]
Adjusted R-sq. 0.027

\begin{tabular}{lllllllll}
\hline
Linear Regression Model \tabularnewline
Y ~ X \tabularnewline
coefficients: &   \tabularnewline
  & Estimate & Std. Error & t value & Pr(>|t|) \tabularnewline
(Intercept) & 3.593 & 0.261 & 13.778 & 0 \tabularnewline
X & 0.14 & 0.059 & 2.369 & 0.019 \tabularnewline
- - -  &   \tabularnewline
Residual Std. Err.  & 0.628  on  163 df \tabularnewline
Multiple R-sq.  & 0.033 \tabularnewline
95% CI Multiple R-sq.  & [0, 0.12] \tabularnewline
Adjusted R-sq.  & 0.027 \tabularnewline
\hline
\end{tabular}
%Source: https://freestatistics.org/blog/index.php?pk=300944&T=1

[TABLE]
[ROW][C]Linear Regression Model[/C][/ROW]
[ROW][C]Y ~ X[/C][/ROW]
[ROW][C]coefficients:[/C][C] [/C][/ROW]
[ROW][C] [/C][C]Estimate[/C][C]Std. Error[/C][C]t value[/C][C]Pr(>|t|)[/C][/ROW]
[C](Intercept)[/C][C]3.593[/C][C]0.261[/C][C]13.778[/C][C]0[/C][/ROW]
[C]X[/C][C]0.14[/C][C]0.059[/C][C]2.369[/C][C]0.019[/C][/ROW]
[ROW][C]- - - [/C][C] [/C][/ROW]
[ROW][C]Residual Std. Err. [/C][C]0.628  on  163 df[/C][/ROW]
[ROW][C]Multiple R-sq. [/C][C]0.033[/C][/ROW]
[ROW][C]95% CI Multiple R-sq. [/C][C][0, 0.12][/C][/ROW]
[ROW][C]Adjusted R-sq. [/C][C]0.027[/C][/ROW]
[/TABLE]
Source: https://freestatistics.org/blog/index.php?pk=300944&T=1

Globally Unique Identifier (entire table): ba.freestatistics.org/blog/index.php?pk=300944&T=1

As an alternative you can also use a QR Code:  

The GUIDs for individual cells are displayed in the table below:

Linear Regression Model
Y ~ X
coefficients:
EstimateStd. Errort valuePr(>|t|)
(Intercept)3.5930.26113.7780
X0.140.0592.3690.019
- - -
Residual Std. Err. 0.628 on 163 df
Multiple R-sq. 0.033
95% CI Multiple R-sq. [0, 0.12]
Adjusted R-sq. 0.027


ANOVA Statistics
DfSum SqMean SqF valuePr(>F)
ITH112.2092.2095.610.019
Residuals16364.1910.394

\begin{tabular}{lllllllll}
\hline
ANOVA Statistics \tabularnewline
  & Df & Sum Sq & Mean Sq & F value & Pr(>F) \tabularnewline
ITH1 & 1 & 2.209 & 2.209 & 5.61 & 0.019 \tabularnewline
Residuals & 163 & 64.191 & 0.394 &   &   \tabularnewline
\hline
\end{tabular}
%Source: https://freestatistics.org/blog/index.php?pk=300944&T=2

[TABLE]
[ROW][C]ANOVA Statistics[/C][/ROW]
[ROW][C] [/C][C]Df[/C][C]Sum Sq[/C][C]Mean Sq[/C][C]F value[/C][C]Pr(>F)[/C][/ROW]
[ROW][C]ITH1[/C][C]1[/C][C]2.209[/C][C]2.209[/C][C]5.61[/C][C]0.019[/C][/ROW]
[ROW][C]Residuals[/C][C]163[/C][C]64.191[/C][C]0.394[/C][C] [/C][C] [/C][/ROW]
[/TABLE]
Source: https://freestatistics.org/blog/index.php?pk=300944&T=2

Globally Unique Identifier (entire table): ba.freestatistics.org/blog/index.php?pk=300944&T=2

As an alternative you can also use a QR Code:  

The GUIDs for individual cells are displayed in the table below:

ANOVA Statistics
DfSum SqMean SqF valuePr(>F)
ITH112.2092.2095.610.019
Residuals16364.1910.394


Parameters (Session):
par1 = grey ; par2 = no ;
Parameters (R input):
par1 = 1 ; par2 = 2 ; par3 = TRUE ;
R code (references can be found in the software module):
library(boot)
cat1 <- as.numeric(par1)
cat2<- as.numeric(par2)
intercept<-as.logical(par3)
x <- na.omit(t(x))
rsq <- function(formula, data, indices) {
d <- data[indices,] # allows boot to select sample
fit <- lm(formula, data=d)
return(summary(fit)$r.square)
}
xdf<-data.frame(na.omit(t(y)))
(V1<-dimnames(y)[[1]][cat1])
(V2<-dimnames(y)[[1]][cat2])
xdf <- data.frame(xdf[[cat1]], xdf[[cat2]])
names(xdf)<-c('Y', 'X')
if(intercept == FALSE) (lmxdf<-lm(Y~ X - 1, data = xdf) ) else (lmxdf<-lm(Y~ X, data = xdf) )
(results <- boot(data=xdf, statistic=rsq, R=1000, formula=Y~X))
sumlmxdf<-summary(lmxdf)
(aov.xdf<-aov(lmxdf) )
(anova.xdf<-anova(lmxdf) )
load(file='createtable')
a<-table.start()
nc <- ncol(sumlmxdf$'coefficients')
nr <- nrow(sumlmxdf$'coefficients')
a<-table.row.start(a)
a<-table.element(a,'Linear Regression Model', nc+1,TRUE)
a<-table.row.end(a)
a<-table.row.start(a)
a<-table.element(a, lmxdf$call['formula'],nc+1)
a<-table.row.end(a)
a<-table.row.start(a)
a<-table.element(a, 'coefficients:',1,TRUE)
a<-table.element(a, ' ',nc,TRUE)
a<-table.row.end(a)
a<-table.row.start(a)
a<-table.element(a, ' ',1,TRUE)
for(i in 1 : nc){
a<-table.element(a, dimnames(sumlmxdf$'coefficients')[[2]][i],1,TRUE)
}#end header
a<-table.row.end(a)
for(i in 1: nr){
a<-table.element(a,dimnames(sumlmxdf$'coefficients')[[1]][i] ,1,TRUE)
for(j in 1 : nc){
a<-table.element(a, round(sumlmxdf$coefficients[i, j], digits=3), 1 ,FALSE)
}
a<-table.row.end(a)
}
a<-table.row.start(a)
a<-table.element(a, '- - - ',1,TRUE)
a<-table.element(a, ' ',nc,FALSE)
a<-table.row.end(a)
a<-table.row.start(a)
a<-table.element(a, 'Residual Std. Err. ',1,TRUE)
a<-table.element(a, paste(round(sumlmxdf$'sigma', digits=3), ' on ', sumlmxdf$'df'[2], 'df') ,nc, FALSE)
a<-table.row.end(a)
a<-table.row.start(a)
a<-table.element(a, 'Multiple R-sq. ',1,TRUE)
a<-table.element(a, round(sumlmxdf$'r.squared', digits=3) ,nc, FALSE)
a<-table.row.end(a)
a<-table.row.start(a)
a<-table.element(a, '95% CI Multiple R-sq. ',1,TRUE)
a<-table.element(a, paste('[',round(boot.ci(results,type='bca')$bca[1,4], digits=3),', ', round(boot.ci(results,type='bca')$bca[1,5], digits=3), ']',sep='') ,nc, FALSE)
a<-table.row.end(a)
a<-table.row.start(a)
a<-table.element(a, 'Adjusted R-sq. ',1,TRUE)
a<-table.element(a, round(sumlmxdf$'adj.r.squared', digits=3) ,nc, FALSE)
a<-table.row.end(a)
a<-table.end(a)
table.save(a,file='mytable.tab')
a<-table.start()
a<-table.row.start(a)
a<-table.element(a,'ANOVA Statistics', 5+1,TRUE)
a<-table.row.end(a)
a<-table.row.start(a)
a<-table.element(a, ' ',1,TRUE)
a<-table.element(a, 'Df',1,TRUE)
a<-table.element(a, 'Sum Sq',1,TRUE)
a<-table.element(a, 'Mean Sq',1,TRUE)
a<-table.element(a, 'F value',1,TRUE)
a<-table.element(a, 'Pr(>F)',1,TRUE)
a<-table.row.end(a)
a<-table.row.start(a)
a<-table.element(a, V2,1,TRUE)
a<-table.element(a, anova.xdf$Df[1])
a<-table.element(a, round(anova.xdf$'Sum Sq'[1], digits=3))
a<-table.element(a, round(anova.xdf$'Mean Sq'[1], digits=3))
a<-table.element(a, round(anova.xdf$'F value'[1], digits=3))
a<-table.element(a, round(anova.xdf$'Pr(>F)'[1], digits=3))
a<-table.row.end(a)
a<-table.row.start(a)
a<-table.element(a, 'Residuals',1,TRUE)
a<-table.element(a, anova.xdf$Df[2])
a<-table.element(a, round(anova.xdf$'Sum Sq'[2], digits=3))
a<-table.element(a, round(anova.xdf$'Mean Sq'[2], digits=3))
a<-table.element(a, ' ')
a<-table.row.end(a)
a<-table.end(a)
table.save(a,file='mytable1.tab')
bitmap(file='regressionplot.png')
plot(Y~ X, data=xdf, xlab=V2, ylab=V1, main='Regression Solution')
if(intercept == TRUE) abline(coef(lmxdf), col='red')
if(intercept == FALSE) abline(0.0, coef(lmxdf), col='red')
dev.off()
library(car)
bitmap(file='residualsQQplot.png')
qqPlot(resid(lmxdf), main='QQplot of Residuals of Fit')
dev.off()
bitmap(file='residualsplot.png')
plot(xdf$X, resid(lmxdf), main='Scatterplot of Residuals of Model Fit')
dev.off()
bitmap(file='cooksDistanceLmplot.png')
plot(lmxdf, which=4)
dev.off()