Free Statistics

of Irreproducible Research!

Author's title

Author*The author of this computation has been verified*
R Software Modulerwasp_arimabackwardselection.wasp
Title produced by softwareARIMA Backward Selection
Date of computationSat, 17 Dec 2016 22:05:18 +0100
Cite this page as followsStatistical Computations at FreeStatistics.org, Office for Research Development and Education, URL https://freestatistics.org/blog/index.php?v=date/2016/Dec/17/t1482008809j7uyi5o86r4t7tu.htm/, Retrieved Thu, 02 May 2024 09:24:53 +0000
Statistical Computations at FreeStatistics.org, Office for Research Development and Education, URL https://freestatistics.org/blog/index.php?pk=300953, Retrieved Thu, 02 May 2024 09:24:53 +0000
QR Codes:

Original text written by user:
IsPrivate?No (this computation is public)
User-defined keywords
Estimated Impact62
Family? (F = Feedback message, R = changed R code, M = changed R Module, P = changed Parameters, D = changed Data)
-       [ARIMA Backward Selection] [Arima backward se...] [2016-12-17 21:05:18] [f20c721eaecf28dbff8d9b9768e8b0c7] [Current]
Feedback Forum

Post a new message
Dataseries X:
3904.45
4137.2
4334.5
4188.6
4304.1
4570.45
4178.85
4515.15
4740.55
4582.2
4493.6
4437
4294
4581.35
4780.15
4632
4648.2
4834.85
4465.25
4671.65
4871.3
4707.8
4580.45
4562.25
4329.7
4646.1
4844.1
4623
4707.2
4844.9
4436.75
4680.85
4873.8
4735.15
4681.9
4607
4436.4
4614.1
4619.25
4507.1
4515.85
4725.4
4250.85
4591.6
4898.15
4675.45
4568.95
4531.05
4387.35
4826.1
4954.35
4814.85
4821.55
5148.05
4810.75
4988.05
5322.65
5157
5006.65
4910.2
4764.05
5093.7
5312.2
5157.6
5192.4
5546.6
5092.05
5423.25
5647.2
5450.05
5360.3
5309.25
5181
5488.6
5668.15
5560.8
5590.45
5850.7
5252.2
5626.1
5819.8
5676.35
5525.5
5359.55
5296.85
5623.75
5899.3
5672.6
5724.75
5995.1
5475.2
6143.95
6366.95
6306.1
6077
5672.4
5458.6
5716.9
5828.1
5706.85
5888.3
6007.7
5581.85
5970.95
6190.4
6079.15
5902.2
5554.4
5320.45
5683.1
5987.9
5843.7
5917.5
6299.45
5846.75
5998.1


Summary of computational transaction
Raw Input view raw input (R code)
Raw Outputview raw output of R engine
Computing time11 seconds
R ServerBig Analytics Cloud Computing Center

\begin{tabular}{lllllllll}
\hline
Summary of computational transaction \tabularnewline
Raw Input view raw input (R code)  \tabularnewline
Raw Outputview raw output of R engine  \tabularnewline
Computing time11 seconds \tabularnewline
R ServerBig Analytics Cloud Computing Center \tabularnewline
\hline
\end{tabular}
%Source: https://freestatistics.org/blog/index.php?pk=300953&T=0

[TABLE]
[ROW]
Summary of computational transaction[/C][/ROW] [ROW]Raw Input[/C] view raw input (R code) [/C][/ROW] [ROW]Raw Output[/C]view raw output of R engine [/C][/ROW] [ROW]Computing time[/C]11 seconds[/C][/ROW] [ROW]R Server[/C]Big Analytics Cloud Computing Center[/C][/ROW] [/TABLE] Source: https://freestatistics.org/blog/index.php?pk=300953&T=0

Globally Unique Identifier (entire table): ba.freestatistics.org/blog/index.php?pk=300953&T=0

As an alternative you can also use a QR Code:  

The GUIDs for individual cells are displayed in the table below:

Summary of computational transaction
Raw Input view raw input (R code)
Raw Outputview raw output of R engine
Computing time11 seconds
R ServerBig Analytics Cloud Computing Center


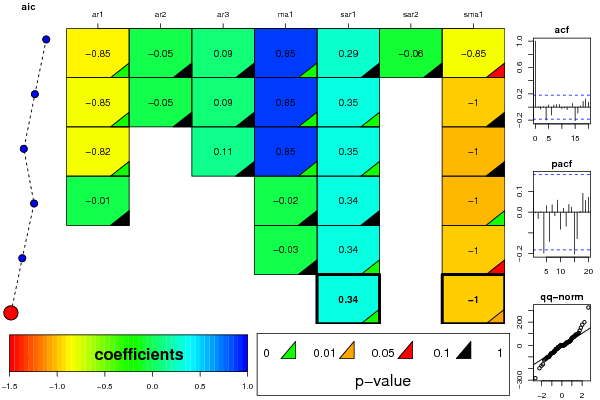
ARIMA Parameter Estimation and Backward Selection
Iterationar1ar2ar3ma1sar1sar2sma1
Estimates ( 1 )-0.8522-0.04650.09120.85280.2937-0.0564-0.8453
(p-val)(0 )(0.7259 )(0.4075 )(0 )(0.3605 )(0.7768 )(0.07 )
Estimates ( 2 )-0.8461-0.04590.08670.85420.34860-0.9994
(p-val)(0 )(0.7293 )(0.4225 )(0 )(0.0034 )(NA )(0.2014 )
Estimates ( 3 )-0.822500.10980.85340.34730-1.0003
(p-val)(0 )(NA )(0.1951 )(0 )(0.0035 )(NA )(0.1671 )
Estimates ( 4 )-0.007900-0.01990.3390-1.0017
(p-val)(0.9749 )(NA )(NA )(0.5863 )(0.2132 )(NA )(0 )
Estimates ( 5 )000-0.02910.33710-0.9982
(p-val)(NA )(NA )(NA )(0.7799 )(0.0036 )(NA )(0.0996 )
Estimates ( 6 )00000.3380-1
(p-val)(NA )(NA )(NA )(NA )(0.0034 )(NA )(0.0448 )
Estimates ( 7 )NANANANANANANA
(p-val)(NA )(NA )(NA )(NA )(NA )(NA )(NA )
Estimates ( 8 )NANANANANANANA
(p-val)(NA )(NA )(NA )(NA )(NA )(NA )(NA )
Estimates ( 9 )NANANANANANANA
(p-val)(NA )(NA )(NA )(NA )(NA )(NA )(NA )
Estimates ( 10 )NANANANANANANA
(p-val)(NA )(NA )(NA )(NA )(NA )(NA )(NA )
Estimates ( 11 )NANANANANANANA
(p-val)(NA )(NA )(NA )(NA )(NA )(NA )(NA )
Estimates ( 12 )NANANANANANANA
(p-val)(NA )(NA )(NA )(NA )(NA )(NA )(NA )
Estimates ( 13 )NANANANANANANA
(p-val)(NA )(NA )(NA )(NA )(NA )(NA )(NA )

\begin{tabular}{lllllllll}
\hline
ARIMA Parameter Estimation and Backward Selection \tabularnewline
Iteration & ar1 & ar2 & ar3 & ma1 & sar1 & sar2 & sma1 \tabularnewline
Estimates ( 1 ) & -0.8522 & -0.0465 & 0.0912 & 0.8528 & 0.2937 & -0.0564 & -0.8453 \tabularnewline
(p-val) & (0 ) & (0.7259 ) & (0.4075 ) & (0 ) & (0.3605 ) & (0.7768 ) & (0.07 ) \tabularnewline
Estimates ( 2 ) & -0.8461 & -0.0459 & 0.0867 & 0.8542 & 0.3486 & 0 & -0.9994 \tabularnewline
(p-val) & (0 ) & (0.7293 ) & (0.4225 ) & (0 ) & (0.0034 ) & (NA ) & (0.2014 ) \tabularnewline
Estimates ( 3 ) & -0.8225 & 0 & 0.1098 & 0.8534 & 0.3473 & 0 & -1.0003 \tabularnewline
(p-val) & (0 ) & (NA ) & (0.1951 ) & (0 ) & (0.0035 ) & (NA ) & (0.1671 ) \tabularnewline
Estimates ( 4 ) & -0.0079 & 0 & 0 & -0.0199 & 0.339 & 0 & -1.0017 \tabularnewline
(p-val) & (0.9749 ) & (NA ) & (NA ) & (0.5863 ) & (0.2132 ) & (NA ) & (0 ) \tabularnewline
Estimates ( 5 ) & 0 & 0 & 0 & -0.0291 & 0.3371 & 0 & -0.9982 \tabularnewline
(p-val) & (NA ) & (NA ) & (NA ) & (0.7799 ) & (0.0036 ) & (NA ) & (0.0996 ) \tabularnewline
Estimates ( 6 ) & 0 & 0 & 0 & 0 & 0.338 & 0 & -1 \tabularnewline
(p-val) & (NA ) & (NA ) & (NA ) & (NA ) & (0.0034 ) & (NA ) & (0.0448 ) \tabularnewline
Estimates ( 7 ) & NA & NA & NA & NA & NA & NA & NA \tabularnewline
(p-val) & (NA ) & (NA ) & (NA ) & (NA ) & (NA ) & (NA ) & (NA ) \tabularnewline
Estimates ( 8 ) & NA & NA & NA & NA & NA & NA & NA \tabularnewline
(p-val) & (NA ) & (NA ) & (NA ) & (NA ) & (NA ) & (NA ) & (NA ) \tabularnewline
Estimates ( 9 ) & NA & NA & NA & NA & NA & NA & NA \tabularnewline
(p-val) & (NA ) & (NA ) & (NA ) & (NA ) & (NA ) & (NA ) & (NA ) \tabularnewline
Estimates ( 10 ) & NA & NA & NA & NA & NA & NA & NA \tabularnewline
(p-val) & (NA ) & (NA ) & (NA ) & (NA ) & (NA ) & (NA ) & (NA ) \tabularnewline
Estimates ( 11 ) & NA & NA & NA & NA & NA & NA & NA \tabularnewline
(p-val) & (NA ) & (NA ) & (NA ) & (NA ) & (NA ) & (NA ) & (NA ) \tabularnewline
Estimates ( 12 ) & NA & NA & NA & NA & NA & NA & NA \tabularnewline
(p-val) & (NA ) & (NA ) & (NA ) & (NA ) & (NA ) & (NA ) & (NA ) \tabularnewline
Estimates ( 13 ) & NA & NA & NA & NA & NA & NA & NA \tabularnewline
(p-val) & (NA ) & (NA ) & (NA ) & (NA ) & (NA ) & (NA ) & (NA ) \tabularnewline
\hline
\end{tabular}
%Source: https://freestatistics.org/blog/index.php?pk=300953&T=1

[TABLE]
[ROW][C]ARIMA Parameter Estimation and Backward Selection[/C][/ROW]
[ROW][C]Iteration[/C][C]ar1[/C][C]ar2[/C][C]ar3[/C][C]ma1[/C][C]sar1[/C][C]sar2[/C][C]sma1[/C][/ROW]
[ROW][C]Estimates ( 1 )[/C][C]-0.8522[/C][C]-0.0465[/C][C]0.0912[/C][C]0.8528[/C][C]0.2937[/C][C]-0.0564[/C][C]-0.8453[/C][/ROW]
[ROW][C](p-val)[/C][C](0 )[/C][C](0.7259 )[/C][C](0.4075 )[/C][C](0 )[/C][C](0.3605 )[/C][C](0.7768 )[/C][C](0.07 )[/C][/ROW]
[ROW][C]Estimates ( 2 )[/C][C]-0.8461[/C][C]-0.0459[/C][C]0.0867[/C][C]0.8542[/C][C]0.3486[/C][C]0[/C][C]-0.9994[/C][/ROW]
[ROW][C](p-val)[/C][C](0 )[/C][C](0.7293 )[/C][C](0.4225 )[/C][C](0 )[/C][C](0.0034 )[/C][C](NA )[/C][C](0.2014 )[/C][/ROW]
[ROW][C]Estimates ( 3 )[/C][C]-0.8225[/C][C]0[/C][C]0.1098[/C][C]0.8534[/C][C]0.3473[/C][C]0[/C][C]-1.0003[/C][/ROW]
[ROW][C](p-val)[/C][C](0 )[/C][C](NA )[/C][C](0.1951 )[/C][C](0 )[/C][C](0.0035 )[/C][C](NA )[/C][C](0.1671 )[/C][/ROW]
[ROW][C]Estimates ( 4 )[/C][C]-0.0079[/C][C]0[/C][C]0[/C][C]-0.0199[/C][C]0.339[/C][C]0[/C][C]-1.0017[/C][/ROW]
[ROW][C](p-val)[/C][C](0.9749 )[/C][C](NA )[/C][C](NA )[/C][C](0.5863 )[/C][C](0.2132 )[/C][C](NA )[/C][C](0 )[/C][/ROW]
[ROW][C]Estimates ( 5 )[/C][C]0[/C][C]0[/C][C]0[/C][C]-0.0291[/C][C]0.3371[/C][C]0[/C][C]-0.9982[/C][/ROW]
[ROW][C](p-val)[/C][C](NA )[/C][C](NA )[/C][C](NA )[/C][C](0.7799 )[/C][C](0.0036 )[/C][C](NA )[/C][C](0.0996 )[/C][/ROW]
[ROW][C]Estimates ( 6 )[/C][C]0[/C][C]0[/C][C]0[/C][C]0[/C][C]0.338[/C][C]0[/C][C]-1[/C][/ROW]
[ROW][C](p-val)[/C][C](NA )[/C][C](NA )[/C][C](NA )[/C][C](NA )[/C][C](0.0034 )[/C][C](NA )[/C][C](0.0448 )[/C][/ROW]
[ROW][C]Estimates ( 7 )[/C][C]NA[/C][C]NA[/C][C]NA[/C][C]NA[/C][C]NA[/C][C]NA[/C][C]NA[/C][/ROW]
[ROW][C](p-val)[/C][C](NA )[/C][C](NA )[/C][C](NA )[/C][C](NA )[/C][C](NA )[/C][C](NA )[/C][C](NA )[/C][/ROW]
[ROW][C]Estimates ( 8 )[/C][C]NA[/C][C]NA[/C][C]NA[/C][C]NA[/C][C]NA[/C][C]NA[/C][C]NA[/C][/ROW]
[ROW][C](p-val)[/C][C](NA )[/C][C](NA )[/C][C](NA )[/C][C](NA )[/C][C](NA )[/C][C](NA )[/C][C](NA )[/C][/ROW]
[ROW][C]Estimates ( 9 )[/C][C]NA[/C][C]NA[/C][C]NA[/C][C]NA[/C][C]NA[/C][C]NA[/C][C]NA[/C][/ROW]
[ROW][C](p-val)[/C][C](NA )[/C][C](NA )[/C][C](NA )[/C][C](NA )[/C][C](NA )[/C][C](NA )[/C][C](NA )[/C][/ROW]
[ROW][C]Estimates ( 10 )[/C][C]NA[/C][C]NA[/C][C]NA[/C][C]NA[/C][C]NA[/C][C]NA[/C][C]NA[/C][/ROW]
[ROW][C](p-val)[/C][C](NA )[/C][C](NA )[/C][C](NA )[/C][C](NA )[/C][C](NA )[/C][C](NA )[/C][C](NA )[/C][/ROW]
[ROW][C]Estimates ( 11 )[/C][C]NA[/C][C]NA[/C][C]NA[/C][C]NA[/C][C]NA[/C][C]NA[/C][C]NA[/C][/ROW]
[ROW][C](p-val)[/C][C](NA )[/C][C](NA )[/C][C](NA )[/C][C](NA )[/C][C](NA )[/C][C](NA )[/C][C](NA )[/C][/ROW]
[ROW][C]Estimates ( 12 )[/C][C]NA[/C][C]NA[/C][C]NA[/C][C]NA[/C][C]NA[/C][C]NA[/C][C]NA[/C][/ROW]
[ROW][C](p-val)[/C][C](NA )[/C][C](NA )[/C][C](NA )[/C][C](NA )[/C][C](NA )[/C][C](NA )[/C][C](NA )[/C][/ROW]
[ROW][C]Estimates ( 13 )[/C][C]NA[/C][C]NA[/C][C]NA[/C][C]NA[/C][C]NA[/C][C]NA[/C][C]NA[/C][/ROW]
[ROW][C](p-val)[/C][C](NA )[/C][C](NA )[/C][C](NA )[/C][C](NA )[/C][C](NA )[/C][C](NA )[/C][C](NA )[/C][/ROW]
[/TABLE]
Source: https://freestatistics.org/blog/index.php?pk=300953&T=1

Globally Unique Identifier (entire table): ba.freestatistics.org/blog/index.php?pk=300953&T=1

As an alternative you can also use a QR Code:  

The GUIDs for individual cells are displayed in the table below:

ARIMA Parameter Estimation and Backward Selection
Iterationar1ar2ar3ma1sar1sar2sma1
Estimates ( 1 )-0.8522-0.04650.09120.85280.2937-0.0564-0.8453
(p-val)(0 )(0.7259 )(0.4075 )(0 )(0.3605 )(0.7768 )(0.07 )
Estimates ( 2 )-0.8461-0.04590.08670.85420.34860-0.9994
(p-val)(0 )(0.7293 )(0.4225 )(0 )(0.0034 )(NA )(0.2014 )
Estimates ( 3 )-0.822500.10980.85340.34730-1.0003
(p-val)(0 )(NA )(0.1951 )(0 )(0.0035 )(NA )(0.1671 )
Estimates ( 4 )-0.007900-0.01990.3390-1.0017
(p-val)(0.9749 )(NA )(NA )(0.5863 )(0.2132 )(NA )(0 )
Estimates ( 5 )000-0.02910.33710-0.9982
(p-val)(NA )(NA )(NA )(0.7799 )(0.0036 )(NA )(0.0996 )
Estimates ( 6 )00000.3380-1
(p-val)(NA )(NA )(NA )(NA )(0.0034 )(NA )(0.0448 )
Estimates ( 7 )NANANANANANANA
(p-val)(NA )(NA )(NA )(NA )(NA )(NA )(NA )
Estimates ( 8 )NANANANANANANA
(p-val)(NA )(NA )(NA )(NA )(NA )(NA )(NA )
Estimates ( 9 )NANANANANANANA
(p-val)(NA )(NA )(NA )(NA )(NA )(NA )(NA )
Estimates ( 10 )NANANANANANANA
(p-val)(NA )(NA )(NA )(NA )(NA )(NA )(NA )
Estimates ( 11 )NANANANANANANA
(p-val)(NA )(NA )(NA )(NA )(NA )(NA )(NA )
Estimates ( 12 )NANANANANANANA
(p-val)(NA )(NA )(NA )(NA )(NA )(NA )(NA )
Estimates ( 13 )NANANANANANANA
(p-val)(NA )(NA )(NA )(NA )(NA )(NA )(NA )


Estimated ARIMA Residuals
Value
-13.7563133507184
44.660894477436
2.52181889708448
-1.77370738337853
-81.3255198392276
-67.6001936347366
16.0283189901382
-105.855373776171
-24.1658931323848
-4.93273523194193
-31.8731148071538
30.4811501425228
-72.8579303040625
38.8936628196623
0.865400254522251
-63.9048962930326
28.5717673454131
-64.5504640035462
-28.9991332291106
-5.49723481756123
-13.3847000915761
19.6747996261923
53.6958236548534
-36.594296451548
26.5077336234835
-100.531693411738
-175.609524282068
64.9195762555451
-62.619073083164
26.6067031685686
-68.0889501163241
69.5907125954849
95.5343148467975
-64.4421341865123
-30.7423367208228
19.7736740586538
27.4983438364709
199.349684114035
36.6266902526185
-0.28169254789482
-31.3428459445541
107.067346146011
92.7473283445345
-117.988681323194
63.6098692051651
24.9631573539082
-46.5323320105324
-49.3783758992668
9.84266441393682
-14.4977866984958
70.8329256017106
-4.52900909233375
0.0580469130286938
80.4380920118692
-73.4261957686153
89.5282514434621
-52.0288049302259
-28.9903292619456
29.064883934801
20.6098611516631
27.5013642892204
1.77815888745135
-3.18033234568361
43.2110392900522
-12.2714607164087
-27.3923224972393
-164.219098794161
66.0386845365379
-38.8072987810248
35.2957605544084
-49.4071340018648
-106.238999420951
75.9470285865822
28.291741288414
100.966370373729
-86.5359475746905
8.42278365173003
15.8178378339543
-23.7242332953985
326.46769941735
10.8436817102091
93.3188284911731
-96.1877714345981
-283.926262234285
-102.007845213179
-50.9221595906017
-98.6963085764837
55.4324231845963
126.98419547348
-128.956099289986
38.7657502893604
-66.1484137938691
-13.4681821287054
8.50613869081826
-13.6580168213598
-121.560967855047
-58.1533874049546
76.5784441361046
151.927304220602
1.33425358137497
-30.8808838991672
178.240510569899
-12.236724468577
-198.157177022811

\begin{tabular}{lllllllll}
\hline
Estimated ARIMA Residuals \tabularnewline
Value \tabularnewline
-13.7563133507184 \tabularnewline
44.660894477436 \tabularnewline
2.52181889708448 \tabularnewline
-1.77370738337853 \tabularnewline
-81.3255198392276 \tabularnewline
-67.6001936347366 \tabularnewline
16.0283189901382 \tabularnewline
-105.855373776171 \tabularnewline
-24.1658931323848 \tabularnewline
-4.93273523194193 \tabularnewline
-31.8731148071538 \tabularnewline
30.4811501425228 \tabularnewline
-72.8579303040625 \tabularnewline
38.8936628196623 \tabularnewline
0.865400254522251 \tabularnewline
-63.9048962930326 \tabularnewline
28.5717673454131 \tabularnewline
-64.5504640035462 \tabularnewline
-28.9991332291106 \tabularnewline
-5.49723481756123 \tabularnewline
-13.3847000915761 \tabularnewline
19.6747996261923 \tabularnewline
53.6958236548534 \tabularnewline
-36.594296451548 \tabularnewline
26.5077336234835 \tabularnewline
-100.531693411738 \tabularnewline
-175.609524282068 \tabularnewline
64.9195762555451 \tabularnewline
-62.619073083164 \tabularnewline
26.6067031685686 \tabularnewline
-68.0889501163241 \tabularnewline
69.5907125954849 \tabularnewline
95.5343148467975 \tabularnewline
-64.4421341865123 \tabularnewline
-30.7423367208228 \tabularnewline
19.7736740586538 \tabularnewline
27.4983438364709 \tabularnewline
199.349684114035 \tabularnewline
36.6266902526185 \tabularnewline
-0.28169254789482 \tabularnewline
-31.3428459445541 \tabularnewline
107.067346146011 \tabularnewline
92.7473283445345 \tabularnewline
-117.988681323194 \tabularnewline
63.6098692051651 \tabularnewline
24.9631573539082 \tabularnewline
-46.5323320105324 \tabularnewline
-49.3783758992668 \tabularnewline
9.84266441393682 \tabularnewline
-14.4977866984958 \tabularnewline
70.8329256017106 \tabularnewline
-4.52900909233375 \tabularnewline
0.0580469130286938 \tabularnewline
80.4380920118692 \tabularnewline
-73.4261957686153 \tabularnewline
89.5282514434621 \tabularnewline
-52.0288049302259 \tabularnewline
-28.9903292619456 \tabularnewline
29.064883934801 \tabularnewline
20.6098611516631 \tabularnewline
27.5013642892204 \tabularnewline
1.77815888745135 \tabularnewline
-3.18033234568361 \tabularnewline
43.2110392900522 \tabularnewline
-12.2714607164087 \tabularnewline
-27.3923224972393 \tabularnewline
-164.219098794161 \tabularnewline
66.0386845365379 \tabularnewline
-38.8072987810248 \tabularnewline
35.2957605544084 \tabularnewline
-49.4071340018648 \tabularnewline
-106.238999420951 \tabularnewline
75.9470285865822 \tabularnewline
28.291741288414 \tabularnewline
100.966370373729 \tabularnewline
-86.5359475746905 \tabularnewline
8.42278365173003 \tabularnewline
15.8178378339543 \tabularnewline
-23.7242332953985 \tabularnewline
326.46769941735 \tabularnewline
10.8436817102091 \tabularnewline
93.3188284911731 \tabularnewline
-96.1877714345981 \tabularnewline
-283.926262234285 \tabularnewline
-102.007845213179 \tabularnewline
-50.9221595906017 \tabularnewline
-98.6963085764837 \tabularnewline
55.4324231845963 \tabularnewline
126.98419547348 \tabularnewline
-128.956099289986 \tabularnewline
38.7657502893604 \tabularnewline
-66.1484137938691 \tabularnewline
-13.4681821287054 \tabularnewline
8.50613869081826 \tabularnewline
-13.6580168213598 \tabularnewline
-121.560967855047 \tabularnewline
-58.1533874049546 \tabularnewline
76.5784441361046 \tabularnewline
151.927304220602 \tabularnewline
1.33425358137497 \tabularnewline
-30.8808838991672 \tabularnewline
178.240510569899 \tabularnewline
-12.236724468577 \tabularnewline
-198.157177022811 \tabularnewline
\hline
\end{tabular}
%Source: https://freestatistics.org/blog/index.php?pk=300953&T=2

[TABLE]
[ROW][C]Estimated ARIMA Residuals[/C][/ROW]
[ROW][C]Value[/C][/ROW]
[ROW][C]-13.7563133507184[/C][/ROW]
[ROW][C]44.660894477436[/C][/ROW]
[ROW][C]2.52181889708448[/C][/ROW]
[ROW][C]-1.77370738337853[/C][/ROW]
[ROW][C]-81.3255198392276[/C][/ROW]
[ROW][C]-67.6001936347366[/C][/ROW]
[ROW][C]16.0283189901382[/C][/ROW]
[ROW][C]-105.855373776171[/C][/ROW]
[ROW][C]-24.1658931323848[/C][/ROW]
[ROW][C]-4.93273523194193[/C][/ROW]
[ROW][C]-31.8731148071538[/C][/ROW]
[ROW][C]30.4811501425228[/C][/ROW]
[ROW][C]-72.8579303040625[/C][/ROW]
[ROW][C]38.8936628196623[/C][/ROW]
[ROW][C]0.865400254522251[/C][/ROW]
[ROW][C]-63.9048962930326[/C][/ROW]
[ROW][C]28.5717673454131[/C][/ROW]
[ROW][C]-64.5504640035462[/C][/ROW]
[ROW][C]-28.9991332291106[/C][/ROW]
[ROW][C]-5.49723481756123[/C][/ROW]
[ROW][C]-13.3847000915761[/C][/ROW]
[ROW][C]19.6747996261923[/C][/ROW]
[ROW][C]53.6958236548534[/C][/ROW]
[ROW][C]-36.594296451548[/C][/ROW]
[ROW][C]26.5077336234835[/C][/ROW]
[ROW][C]-100.531693411738[/C][/ROW]
[ROW][C]-175.609524282068[/C][/ROW]
[ROW][C]64.9195762555451[/C][/ROW]
[ROW][C]-62.619073083164[/C][/ROW]
[ROW][C]26.6067031685686[/C][/ROW]
[ROW][C]-68.0889501163241[/C][/ROW]
[ROW][C]69.5907125954849[/C][/ROW]
[ROW][C]95.5343148467975[/C][/ROW]
[ROW][C]-64.4421341865123[/C][/ROW]
[ROW][C]-30.7423367208228[/C][/ROW]
[ROW][C]19.7736740586538[/C][/ROW]
[ROW][C]27.4983438364709[/C][/ROW]
[ROW][C]199.349684114035[/C][/ROW]
[ROW][C]36.6266902526185[/C][/ROW]
[ROW][C]-0.28169254789482[/C][/ROW]
[ROW][C]-31.3428459445541[/C][/ROW]
[ROW][C]107.067346146011[/C][/ROW]
[ROW][C]92.7473283445345[/C][/ROW]
[ROW][C]-117.988681323194[/C][/ROW]
[ROW][C]63.6098692051651[/C][/ROW]
[ROW][C]24.9631573539082[/C][/ROW]
[ROW][C]-46.5323320105324[/C][/ROW]
[ROW][C]-49.3783758992668[/C][/ROW]
[ROW][C]9.84266441393682[/C][/ROW]
[ROW][C]-14.4977866984958[/C][/ROW]
[ROW][C]70.8329256017106[/C][/ROW]
[ROW][C]-4.52900909233375[/C][/ROW]
[ROW][C]0.0580469130286938[/C][/ROW]
[ROW][C]80.4380920118692[/C][/ROW]
[ROW][C]-73.4261957686153[/C][/ROW]
[ROW][C]89.5282514434621[/C][/ROW]
[ROW][C]-52.0288049302259[/C][/ROW]
[ROW][C]-28.9903292619456[/C][/ROW]
[ROW][C]29.064883934801[/C][/ROW]
[ROW][C]20.6098611516631[/C][/ROW]
[ROW][C]27.5013642892204[/C][/ROW]
[ROW][C]1.77815888745135[/C][/ROW]
[ROW][C]-3.18033234568361[/C][/ROW]
[ROW][C]43.2110392900522[/C][/ROW]
[ROW][C]-12.2714607164087[/C][/ROW]
[ROW][C]-27.3923224972393[/C][/ROW]
[ROW][C]-164.219098794161[/C][/ROW]
[ROW][C]66.0386845365379[/C][/ROW]
[ROW][C]-38.8072987810248[/C][/ROW]
[ROW][C]35.2957605544084[/C][/ROW]
[ROW][C]-49.4071340018648[/C][/ROW]
[ROW][C]-106.238999420951[/C][/ROW]
[ROW][C]75.9470285865822[/C][/ROW]
[ROW][C]28.291741288414[/C][/ROW]
[ROW][C]100.966370373729[/C][/ROW]
[ROW][C]-86.5359475746905[/C][/ROW]
[ROW][C]8.42278365173003[/C][/ROW]
[ROW][C]15.8178378339543[/C][/ROW]
[ROW][C]-23.7242332953985[/C][/ROW]
[ROW][C]326.46769941735[/C][/ROW]
[ROW][C]10.8436817102091[/C][/ROW]
[ROW][C]93.3188284911731[/C][/ROW]
[ROW][C]-96.1877714345981[/C][/ROW]
[ROW][C]-283.926262234285[/C][/ROW]
[ROW][C]-102.007845213179[/C][/ROW]
[ROW][C]-50.9221595906017[/C][/ROW]
[ROW][C]-98.6963085764837[/C][/ROW]
[ROW][C]55.4324231845963[/C][/ROW]
[ROW][C]126.98419547348[/C][/ROW]
[ROW][C]-128.956099289986[/C][/ROW]
[ROW][C]38.7657502893604[/C][/ROW]
[ROW][C]-66.1484137938691[/C][/ROW]
[ROW][C]-13.4681821287054[/C][/ROW]
[ROW][C]8.50613869081826[/C][/ROW]
[ROW][C]-13.6580168213598[/C][/ROW]
[ROW][C]-121.560967855047[/C][/ROW]
[ROW][C]-58.1533874049546[/C][/ROW]
[ROW][C]76.5784441361046[/C][/ROW]
[ROW][C]151.927304220602[/C][/ROW]
[ROW][C]1.33425358137497[/C][/ROW]
[ROW][C]-30.8808838991672[/C][/ROW]
[ROW][C]178.240510569899[/C][/ROW]
[ROW][C]-12.236724468577[/C][/ROW]
[ROW][C]-198.157177022811[/C][/ROW]
[/TABLE]
Source: https://freestatistics.org/blog/index.php?pk=300953&T=2

Globally Unique Identifier (entire table): ba.freestatistics.org/blog/index.php?pk=300953&T=2

As an alternative you can also use a QR Code:  

The GUIDs for individual cells are displayed in the table below:

Estimated ARIMA Residuals
Value
-13.7563133507184
44.660894477436
2.52181889708448
-1.77370738337853
-81.3255198392276
-67.6001936347366
16.0283189901382
-105.855373776171
-24.1658931323848
-4.93273523194193
-31.8731148071538
30.4811501425228
-72.8579303040625
38.8936628196623
0.865400254522251
-63.9048962930326
28.5717673454131
-64.5504640035462
-28.9991332291106
-5.49723481756123
-13.3847000915761
19.6747996261923
53.6958236548534
-36.594296451548
26.5077336234835
-100.531693411738
-175.609524282068
64.9195762555451
-62.619073083164
26.6067031685686
-68.0889501163241
69.5907125954849
95.5343148467975
-64.4421341865123
-30.7423367208228
19.7736740586538
27.4983438364709
199.349684114035
36.6266902526185
-0.28169254789482
-31.3428459445541
107.067346146011
92.7473283445345
-117.988681323194
63.6098692051651
24.9631573539082
-46.5323320105324
-49.3783758992668
9.84266441393682
-14.4977866984958
70.8329256017106
-4.52900909233375
0.0580469130286938
80.4380920118692
-73.4261957686153
89.5282514434621
-52.0288049302259
-28.9903292619456
29.064883934801
20.6098611516631
27.5013642892204
1.77815888745135
-3.18033234568361
43.2110392900522
-12.2714607164087
-27.3923224972393
-164.219098794161
66.0386845365379
-38.8072987810248
35.2957605544084
-49.4071340018648
-106.238999420951
75.9470285865822
28.291741288414
100.966370373729
-86.5359475746905
8.42278365173003
15.8178378339543
-23.7242332953985
326.46769941735
10.8436817102091
93.3188284911731
-96.1877714345981
-283.926262234285
-102.007845213179
-50.9221595906017
-98.6963085764837
55.4324231845963
126.98419547348
-128.956099289986
38.7657502893604
-66.1484137938691
-13.4681821287054
8.50613869081826
-13.6580168213598
-121.560967855047
-58.1533874049546
76.5784441361046
151.927304220602
1.33425358137497
-30.8808838991672
178.240510569899
-12.236724468577
-198.157177022811


Parameters (Session):
par1 = FALSE ; par2 = 1 ; par3 = 1 ; par4 = 1 ; par5 = 12 ; par6 = 3 ; par7 = 1 ; par8 = 2 ; par9 = 1 ;
Parameters (R input):
par1 = FALSE ; par2 = 1 ; par3 = 1 ; par4 = 1 ; par5 = 12 ; par6 = 3 ; par7 = 1 ; par8 = 2 ; par9 = 1 ;
R code (references can be found in the software module):
library(lattice)
if (par1 == 'TRUE') par1 <- TRUE
if (par1 == 'FALSE') par1 <- FALSE
par2 <- as.numeric(par2) #Box-Cox lambda transformation parameter
par3 <- as.numeric(par3) #degree of non-seasonal differencing
par4 <- as.numeric(par4) #degree of seasonal differencing
par5 <- as.numeric(par5) #seasonal period
par6 <- as.numeric(par6) #degree (p) of the non-seasonal AR(p) polynomial
par7 <- as.numeric(par7) #degree (q) of the non-seasonal MA(q) polynomial
par8 <- as.numeric(par8) #degree (P) of the seasonal AR(P) polynomial
par9 <- as.numeric(par9) #degree (Q) of the seasonal MA(Q) polynomial
armaGR <- function(arima.out, names, n){
try1 <- arima.out$coef
try2 <- sqrt(diag(arima.out$var.coef))
try.data.frame <- data.frame(matrix(NA,ncol=4,nrow=length(names)))
dimnames(try.data.frame) <- list(names,c('coef','std','tstat','pv'))
try.data.frame[,1] <- try1
for(i in 1:length(try2)) try.data.frame[which(rownames(try.data.frame)==names(try2)[i]),2] <- try2[i]
try.data.frame[,3] <- try.data.frame[,1] / try.data.frame[,2]
try.data.frame[,4] <- round((1-pt(abs(try.data.frame[,3]),df=n-(length(try2)+1)))*2,5)
vector <- rep(NA,length(names))
vector[is.na(try.data.frame[,4])] <- 0
maxi <- which.max(try.data.frame[,4])
continue <- max(try.data.frame[,4],na.rm=TRUE) > .05
vector[maxi] <- 0
list(summary=try.data.frame,next.vector=vector,continue=continue)
}
arimaSelect <- function(series, order=c(13,0,0), seasonal=list(order=c(2,0,0),period=12), include.mean=F){
nrc <- order[1]+order[3]+seasonal$order[1]+seasonal$order[3]
coeff <- matrix(NA, nrow=nrc*2, ncol=nrc)
pval <- matrix(NA, nrow=nrc*2, ncol=nrc)
mylist <- rep(list(NULL), nrc)
names <- NULL
if(order[1] > 0) names <- paste('ar',1:order[1],sep='')
if(order[3] > 0) names <- c( names , paste('ma',1:order[3],sep='') )
if(seasonal$order[1] > 0) names <- c(names, paste('sar',1:seasonal$order[1],sep=''))
if(seasonal$order[3] > 0) names <- c(names, paste('sma',1:seasonal$order[3],sep=''))
arima.out <- arima(series, order=order, seasonal=seasonal, include.mean=include.mean, method='ML')
mylist[[1]] <- arima.out
last.arma <- armaGR(arima.out, names, length(series))
mystop <- FALSE
i <- 1
coeff[i,] <- last.arma[[1]][,1]
pval [i,] <- last.arma[[1]][,4]
i <- 2
aic <- arima.out$aic
while(!mystop){
mylist[[i]] <- arima.out
arima.out <- arima(series, order=order, seasonal=seasonal, include.mean=include.mean, method='ML', fixed=last.arma$next.vector)
aic <- c(aic, arima.out$aic)
last.arma <- armaGR(arima.out, names, length(series))
mystop <- !last.arma$continue
coeff[i,] <- last.arma[[1]][,1]
pval [i,] <- last.arma[[1]][,4]
i <- i+1
}
list(coeff, pval, mylist, aic=aic)
}
arimaSelectplot <- function(arimaSelect.out,noms,choix){
noms <- names(arimaSelect.out[[3]][[1]]$coef)
coeff <- arimaSelect.out[[1]]
k <- min(which(is.na(coeff[,1])))-1
coeff <- coeff[1:k,]
pval <- arimaSelect.out[[2]][1:k,]
aic <- arimaSelect.out$aic[1:k]
coeff[coeff==0] <- NA
n <- ncol(coeff)
if(missing(choix)) choix <- k
layout(matrix(c(1,1,1,2,
3,3,3,2,
3,3,3,4,
5,6,7,7),nr=4),
widths=c(10,35,45,15),
heights=c(30,30,15,15))
couleurs <- rainbow(75)[1:50]#(50)
ticks <- pretty(coeff)
par(mar=c(1,1,3,1))
plot(aic,k:1-.5,type='o',pch=21,bg='blue',cex=2,axes=F,lty=2,xpd=NA)
points(aic[choix],k-choix+.5,pch=21,cex=4,bg=2,xpd=NA)
title('aic',line=2)
par(mar=c(3,0,0,0))
plot(0,axes=F,xlab='',ylab='',xlim=range(ticks),ylim=c(.1,1))
rect(xleft = min(ticks) + (0:49)/50*(max(ticks)-min(ticks)),
xright = min(ticks) + (1:50)/50*(max(ticks)-min(ticks)),
ytop = rep(1,50),
ybottom= rep(0,50),col=couleurs,border=NA)
axis(1,ticks)
rect(xleft=min(ticks),xright=max(ticks),ytop=1,ybottom=0)
text(mean(coeff,na.rm=T),.5,'coefficients',cex=2,font=2)
par(mar=c(1,1,3,1))
image(1:n,1:k,t(coeff[k:1,]),axes=F,col=couleurs,zlim=range(ticks))
for(i in 1:n) for(j in 1:k) if(!is.na(coeff[j,i])) {
if(pval[j,i]<.01) symb = 'green'
else if( (pval[j,i]<.05) & (pval[j,i]>=.01)) symb = 'orange'
else if( (pval[j,i]<.1) & (pval[j,i]>=.05)) symb = 'red'
else symb = 'black'
polygon(c(i+.5 ,i+.2 ,i+.5 ,i+.5),
c(k-j+0.5,k-j+0.5,k-j+0.8,k-j+0.5),
col=symb)
if(j==choix) {
rect(xleft=i-.5,
xright=i+.5,
ybottom=k-j+1.5,
ytop=k-j+.5,
lwd=4)
text(i,
k-j+1,
round(coeff[j,i],2),
cex=1.2,
font=2)
}
else{
rect(xleft=i-.5,xright=i+.5,ybottom=k-j+1.5,ytop=k-j+.5)
text(i,k-j+1,round(coeff[j,i],2),cex=1.2,font=1)
}
}
axis(3,1:n,noms)
par(mar=c(0.5,0,0,0.5))
plot(0,axes=F,xlab='',ylab='',type='n',xlim=c(0,8),ylim=c(-.2,.8))
cols <- c('green','orange','red','black')
niv <- c('0','0.01','0.05','0.1')
for(i in 0:3){
polygon(c(1+2*i ,1+2*i ,1+2*i-.5 ,1+2*i),
c(.4 ,.7 , .4 , .4),
col=cols[i+1])
text(2*i,0.5,niv[i+1],cex=1.5)
}
text(8,.5,1,cex=1.5)
text(4,0,'p-value',cex=2)
box()
residus <- arimaSelect.out[[3]][[choix]]$res
par(mar=c(1,2,4,1))
acf(residus,main='')
title('acf',line=.5)
par(mar=c(1,2,4,1))
pacf(residus,main='')
title('pacf',line=.5)
par(mar=c(2,2,4,1))
qqnorm(residus,main='')
title('qq-norm',line=.5)
qqline(residus)
residus
}
if (par2 == 0) x <- log(x)
if (par2 != 0) x <- x^par2
(selection <- arimaSelect(x, order=c(par6,par3,par7), seasonal=list(order=c(par8,par4,par9), period=par5)))
bitmap(file='test1.png')
resid <- arimaSelectplot(selection)
dev.off()
resid
bitmap(file='test2.png')
acf(resid,length(resid)/2, main='Residual Autocorrelation Function')
dev.off()
bitmap(file='test3.png')
pacf(resid,length(resid)/2, main='Residual Partial Autocorrelation Function')
dev.off()
bitmap(file='test4.png')
cpgram(resid, main='Residual Cumulative Periodogram')
dev.off()
bitmap(file='test5.png')
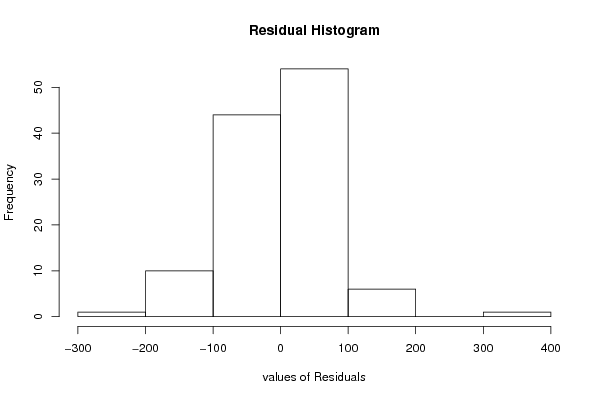
hist(resid, main='Residual Histogram', xlab='values of Residuals')
dev.off()
bitmap(file='test6.png')
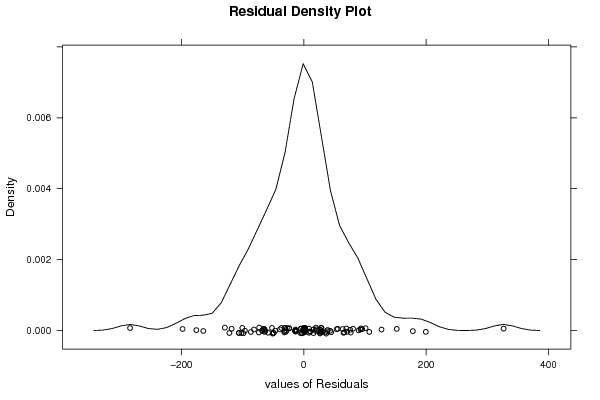
densityplot(~resid,col='black',main='Residual Density Plot', xlab='values of Residuals')
dev.off()
bitmap(file='test7.png')
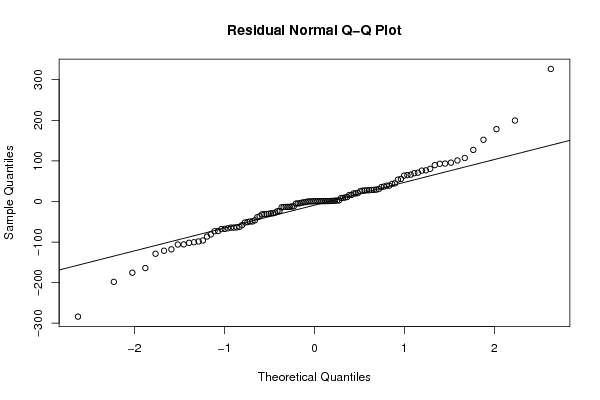
qqnorm(resid, main='Residual Normal Q-Q Plot')
qqline(resid)
dev.off()
ncols <- length(selection[[1]][1,])
nrows <- length(selection[[2]][,1])-1
load(file='createtable')
a<-table.start()
a<-table.row.start(a)
a<-table.element(a,'ARIMA Parameter Estimation and Backward Selection', ncols+1,TRUE)
a<-table.row.end(a)
a<-table.row.start(a)
a<-table.element(a,'Iteration', header=TRUE)
for (i in 1:ncols) {
a<-table.element(a,names(selection[[3]][[1]]$coef)[i],header=TRUE)
}
a<-table.row.end(a)
for (j in 1:nrows) {
a<-table.row.start(a)
mydum <- 'Estimates ('
mydum <- paste(mydum,j)
mydum <- paste(mydum,')')
a<-table.element(a,mydum, header=TRUE)
for (i in 1:ncols) {
a<-table.element(a,round(selection[[1]][j,i],4))
}
a<-table.row.end(a)
a<-table.row.start(a)
a<-table.element(a,'(p-val)', header=TRUE)
for (i in 1:ncols) {
mydum <- '('
mydum <- paste(mydum,round(selection[[2]][j,i],4),sep='')
mydum <- paste(mydum,')')
a<-table.element(a,mydum)
}
a<-table.row.end(a)
}
a<-table.end(a)
table.save(a,file='mytable.tab')
a<-table.start()
a<-table.row.start(a)
a<-table.element(a,'Estimated ARIMA Residuals', 1,TRUE)
a<-table.row.end(a)
a<-table.row.start(a)
a<-table.element(a,'Value', 1,TRUE)
a<-table.row.end(a)
for (i in (par4*par5+par3):length(resid)) {
a<-table.row.start(a)
a<-table.element(a,resid[i])
a<-table.row.end(a)
}
a<-table.end(a)
table.save(a,file='mytable1.tab')