Free Statistics

of Irreproducible Research!

Author's title

Author*The author of this computation has been verified*
R Software Modulerwasp_arimabackwardselection.wasp
Title produced by softwareARIMA Backward Selection
Date of computationSun, 18 Dec 2016 09:56:03 +0100
Cite this page as followsStatistical Computations at FreeStatistics.org, Office for Research Development and Education, URL https://freestatistics.org/blog/index.php?v=date/2016/Dec/18/t1482051501915nclfa065c00m.htm/, Retrieved Thu, 09 May 2024 01:13:37 +0000
Statistical Computations at FreeStatistics.org, Office for Research Development and Education, URL https://freestatistics.org/blog/index.php?pk=300982, Retrieved Thu, 09 May 2024 01:13:37 +0000
QR Codes:

Original text written by user:
IsPrivate?No (this computation is public)
User-defined keywords
Estimated Impact113
Family? (F = Feedback message, R = changed R code, M = changed R Module, P = changed Parameters, D = changed Data)
-       [ARIMA Backward Selection] [ARIMA Backward N2701] [2016-12-18 08:56:03] [08c254f01fc4fb8b56d19f4878327019] [Current]
Feedback Forum

Post a new message
Dataseries X:
5884.5
5879.1
5897.2
5920.7
5944.6
5982.4
6017.4
5980
6087.4
6114.5
6143.2
6173.1
6195.7
6236
6255.2
6282.5
6301.7
6330.9
6350.8
6363
6388.6
6411.5
6436.4
6449.2
6473.3
6479.5
6507.3
6516.1
6534.2
6540.6
6542.9
6562.6
6577
6596.6
6612.1
6626.3
6640.1
6642.4
6648.7
6660.8
6668.2
6657.7
6682.8
6696.8
6714.4
6728.2
6741.8
6758.4
6774
6792.3
6809.1
6832.2
6850.3
6861.1
6882.6
6900.7
6915.1
6947.8
6965.9
6991.7
6993.9
7031.7
7048.7
7067.4
7077.1
7107.4
7127.1
7137.3
7147.9
7170.6
7193
7220.1
7251
7268.1
7282.2
7290.2
7292.5
7299.6
7305.1
7306.9
7313.3
7325.6
7348.1
7354.7
7375.3
7396.3
7401.9
7390.4
7393.6
7398.5
7392.4
7390.8
7380.6
7365.8
7346.9
7334.1
7314.8
7287.8
7274.3
7252.7
7257.5
7256.5
7253.9
7262.6
7263.6
7261.3
7250.4
7249.3
7245.6
7244.4
7253.8
7271.6
7282.7
7283
7293.3
7291.2
7298.5


Summary of computational transaction
Raw Input view raw input (R code)
Raw Outputview raw output of R engine
Computing time3 seconds
R ServerBig Analytics Cloud Computing Center

\begin{tabular}{lllllllll}
\hline
Summary of computational transaction \tabularnewline
Raw Input view raw input (R code)  \tabularnewline
Raw Outputview raw output of R engine  \tabularnewline
Computing time3 seconds \tabularnewline
R ServerBig Analytics Cloud Computing Center \tabularnewline
\hline
\end{tabular}
%Source: https://freestatistics.org/blog/index.php?pk=300982&T=0

[TABLE]
[ROW]
Summary of computational transaction[/C][/ROW] [ROW]Raw Input[/C] view raw input (R code) [/C][/ROW] [ROW]Raw Output[/C]view raw output of R engine [/C][/ROW] [ROW]Computing time[/C]3 seconds[/C][/ROW] [ROW]R Server[/C]Big Analytics Cloud Computing Center[/C][/ROW] [/TABLE] Source: https://freestatistics.org/blog/index.php?pk=300982&T=0

Globally Unique Identifier (entire table): ba.freestatistics.org/blog/index.php?pk=300982&T=0

As an alternative you can also use a QR Code:  

The GUIDs for individual cells are displayed in the table below:

Summary of computational transaction
Raw Input view raw input (R code)
Raw Outputview raw output of R engine
Computing time3 seconds
R ServerBig Analytics Cloud Computing Center


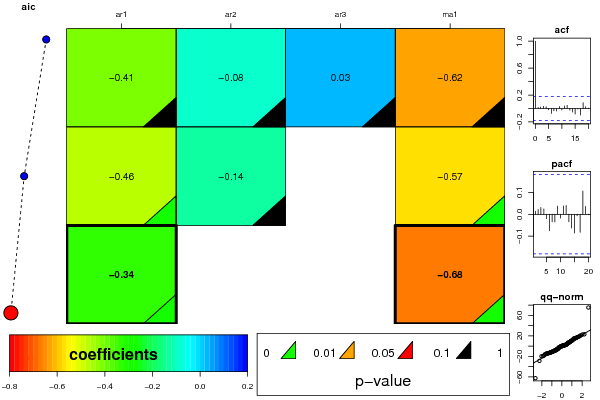
ARIMA Parameter Estimation and Backward Selection
Iterationar1ar2ar3ma1
Estimates ( 1 )-0.4085-0.08250.0348-0.6232
(p-val)(0.3504 )(0.8499 )(0.8925 )(0.1437 )
Estimates ( 2 )-0.4645-0.13930-0.5678
(p-val)(0.0099 )(0.3559 )(NA )(8e-04 )
Estimates ( 3 )-0.337700-0.6799
(p-val)(0.0022 )(NA )(NA )(0 )
Estimates ( 4 )NANANANA
(p-val)(NA )(NA )(NA )(NA )
Estimates ( 5 )NANANANA
(p-val)(NA )(NA )(NA )(NA )
Estimates ( 6 )NANANANA
(p-val)(NA )(NA )(NA )(NA )
Estimates ( 7 )NANANANA
(p-val)(NA )(NA )(NA )(NA )

\begin{tabular}{lllllllll}
\hline
ARIMA Parameter Estimation and Backward Selection \tabularnewline
Iteration & ar1 & ar2 & ar3 & ma1 \tabularnewline
Estimates ( 1 ) & -0.4085 & -0.0825 & 0.0348 & -0.6232 \tabularnewline
(p-val) & (0.3504 ) & (0.8499 ) & (0.8925 ) & (0.1437 ) \tabularnewline
Estimates ( 2 ) & -0.4645 & -0.1393 & 0 & -0.5678 \tabularnewline
(p-val) & (0.0099 ) & (0.3559 ) & (NA ) & (8e-04 ) \tabularnewline
Estimates ( 3 ) & -0.3377 & 0 & 0 & -0.6799 \tabularnewline
(p-val) & (0.0022 ) & (NA ) & (NA ) & (0 ) \tabularnewline
Estimates ( 4 ) & NA & NA & NA & NA \tabularnewline
(p-val) & (NA ) & (NA ) & (NA ) & (NA ) \tabularnewline
Estimates ( 5 ) & NA & NA & NA & NA \tabularnewline
(p-val) & (NA ) & (NA ) & (NA ) & (NA ) \tabularnewline
Estimates ( 6 ) & NA & NA & NA & NA \tabularnewline
(p-val) & (NA ) & (NA ) & (NA ) & (NA ) \tabularnewline
Estimates ( 7 ) & NA & NA & NA & NA \tabularnewline
(p-val) & (NA ) & (NA ) & (NA ) & (NA ) \tabularnewline
\hline
\end{tabular}
%Source: https://freestatistics.org/blog/index.php?pk=300982&T=1

[TABLE]
[ROW][C]ARIMA Parameter Estimation and Backward Selection[/C][/ROW]
[ROW][C]Iteration[/C][C]ar1[/C][C]ar2[/C][C]ar3[/C][C]ma1[/C][/ROW]
[ROW][C]Estimates ( 1 )[/C][C]-0.4085[/C][C]-0.0825[/C][C]0.0348[/C][C]-0.6232[/C][/ROW]
[ROW][C](p-val)[/C][C](0.3504 )[/C][C](0.8499 )[/C][C](0.8925 )[/C][C](0.1437 )[/C][/ROW]
[ROW][C]Estimates ( 2 )[/C][C]-0.4645[/C][C]-0.1393[/C][C]0[/C][C]-0.5678[/C][/ROW]
[ROW][C](p-val)[/C][C](0.0099 )[/C][C](0.3559 )[/C][C](NA )[/C][C](8e-04 )[/C][/ROW]
[ROW][C]Estimates ( 3 )[/C][C]-0.3377[/C][C]0[/C][C]0[/C][C]-0.6799[/C][/ROW]
[ROW][C](p-val)[/C][C](0.0022 )[/C][C](NA )[/C][C](NA )[/C][C](0 )[/C][/ROW]
[ROW][C]Estimates ( 4 )[/C][C]NA[/C][C]NA[/C][C]NA[/C][C]NA[/C][/ROW]
[ROW][C](p-val)[/C][C](NA )[/C][C](NA )[/C][C](NA )[/C][C](NA )[/C][/ROW]
[ROW][C]Estimates ( 5 )[/C][C]NA[/C][C]NA[/C][C]NA[/C][C]NA[/C][/ROW]
[ROW][C](p-val)[/C][C](NA )[/C][C](NA )[/C][C](NA )[/C][C](NA )[/C][/ROW]
[ROW][C]Estimates ( 6 )[/C][C]NA[/C][C]NA[/C][C]NA[/C][C]NA[/C][/ROW]
[ROW][C](p-val)[/C][C](NA )[/C][C](NA )[/C][C](NA )[/C][C](NA )[/C][/ROW]
[ROW][C]Estimates ( 7 )[/C][C]NA[/C][C]NA[/C][C]NA[/C][C]NA[/C][/ROW]
[ROW][C](p-val)[/C][C](NA )[/C][C](NA )[/C][C](NA )[/C][C](NA )[/C][/ROW]
[/TABLE]
Source: https://freestatistics.org/blog/index.php?pk=300982&T=1

Globally Unique Identifier (entire table): ba.freestatistics.org/blog/index.php?pk=300982&T=1

As an alternative you can also use a QR Code:  

The GUIDs for individual cells are displayed in the table below:

ARIMA Parameter Estimation and Backward Selection
Iterationar1ar2ar3ma1
Estimates ( 1 )-0.4085-0.08250.0348-0.6232
(p-val)(0.3504 )(0.8499 )(0.8925 )(0.1437 )
Estimates ( 2 )-0.4645-0.13930-0.5678
(p-val)(0.0099 )(0.3559 )(NA )(8e-04 )
Estimates ( 3 )-0.337700-0.6799
(p-val)(0.0022 )(NA )(NA )(0 )
Estimates ( 4 )NANANANA
(p-val)(NA )(NA )(NA )(NA )
Estimates ( 5 )NANANANA
(p-val)(NA )(NA )(NA )(NA )
Estimates ( 6 )NANANANA
(p-val)(NA )(NA )(NA )(NA )
Estimates ( 7 )NANANANA
(p-val)(NA )(NA )(NA )(NA )


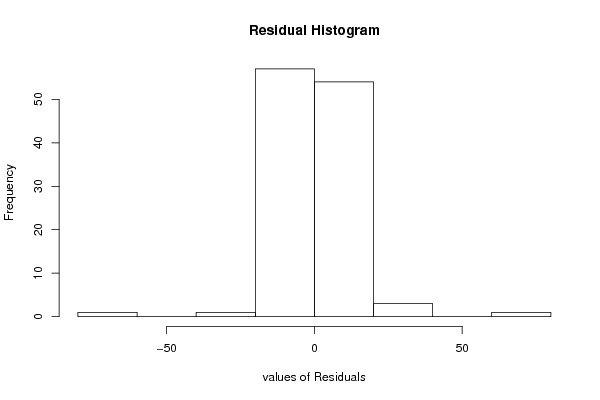
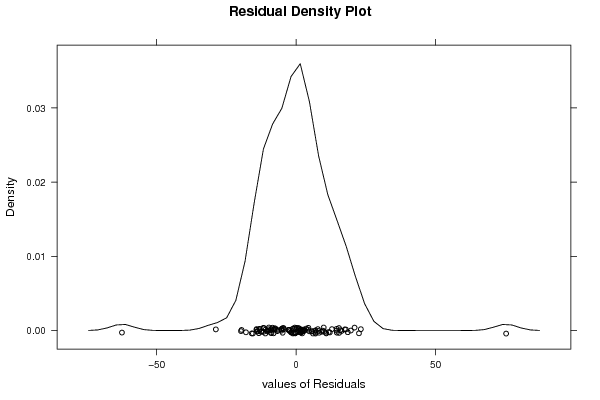
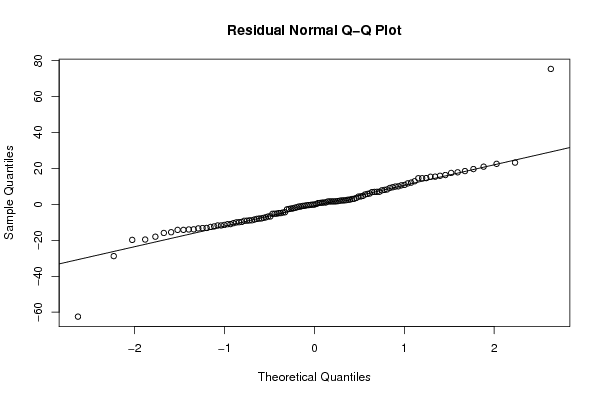
Estimated ARIMA Residuals
Value
-7.9069305058904
15.886809940795
17.8326295952337
14.5287503990584
22.5458711736374
16.3167180428559
-62.4616038932615
75.3230095420979
19.6332924708293
-4.38728801644035
-11.7315996919376
-13.1811750900239
6.99138850608982
-9.92460959747129
-4.87189871767049
-10.0424527099535
1.66301583229202
-4.83852702553587
-13.3748372538283
0.933193884116847
2.98216574436323
4.30543627192449
-9.10221929052505
0.789212364069229
-13.8879159317472
6.97273296375993
-7.49986047380901
-0.776363791839644
-10.4669616016234
-14.1832084870847
5.81221770425053
5.51214330962739
8.29136678653412
2.28549821817342
-1.18255571923783
-2.24641185385099
-13.1424557868595
-8.8605095070061
1.02516065435157
-0.866508533865272
-19.7675197609688
15.4056915651299
11.6920559636146
10.041070702664
2.02799133879489
-0.31225886289576
2.20053579387513
1.61526814327317
3.57049971317156
1.64239891602574
6.91185816053712
1.64239805836405
-7.81260188981014
2.17630918635587
1.78952859536275
-2.77299667864827
14.5331070375232
1.63793446611362
4.39669192315432
-19.5599659032196
14.6027497833038
0.742248049870796
-2.58251925483364
-12.5736732865189
9.51626555352687
3.11946457725207
-9.78359635478228
-11.0447936174005
4.69109949771337
8.04027199737448
10.8114051144394
12.0805718390102
-4.52045178863318
-11.448114337014
-15.9162037507904
-17.9891931646807
-8.91224696923291
-5.22479521037894
-6.74153199954435
-1.16966015763228
6.85734298575699
17.475212634311
-0.417081814084668
7.79776581014903
9.11674978498741
-8.0875415530154
-28.7904079480977
-11.7364244336704
-0.517359261025376
-8.45672115320122
-5.17505342916138
-10.9802150780661
-14.2031334386438
-15.499606261912
-5.24641834917838
-7.21648946123878
-13.9676152625016
1.08656717998019
-2.28429099267669
23.2204409368314
18.5207583783613
9.89929822514478
15.3700978581519
6.0539799168746
-1.86541247603145
-12.2646109478956
-1.61880560024383
-0.164595672610631
2.56366320235611
12.8549374536406
20.9716499572278
10.5867523005227
-6.7309272260718
0.227898506946985
-9.12947770460141
-0.151419051399898

\begin{tabular}{lllllllll}
\hline
Estimated ARIMA Residuals \tabularnewline
Value \tabularnewline
-7.9069305058904 \tabularnewline
15.886809940795 \tabularnewline
17.8326295952337 \tabularnewline
14.5287503990584 \tabularnewline
22.5458711736374 \tabularnewline
16.3167180428559 \tabularnewline
-62.4616038932615 \tabularnewline
75.3230095420979 \tabularnewline
19.6332924708293 \tabularnewline
-4.38728801644035 \tabularnewline
-11.7315996919376 \tabularnewline
-13.1811750900239 \tabularnewline
6.99138850608982 \tabularnewline
-9.92460959747129 \tabularnewline
-4.87189871767049 \tabularnewline
-10.0424527099535 \tabularnewline
1.66301583229202 \tabularnewline
-4.83852702553587 \tabularnewline
-13.3748372538283 \tabularnewline
0.933193884116847 \tabularnewline
2.98216574436323 \tabularnewline
4.30543627192449 \tabularnewline
-9.10221929052505 \tabularnewline
0.789212364069229 \tabularnewline
-13.8879159317472 \tabularnewline
6.97273296375993 \tabularnewline
-7.49986047380901 \tabularnewline
-0.776363791839644 \tabularnewline
-10.4669616016234 \tabularnewline
-14.1832084870847 \tabularnewline
5.81221770425053 \tabularnewline
5.51214330962739 \tabularnewline
8.29136678653412 \tabularnewline
2.28549821817342 \tabularnewline
-1.18255571923783 \tabularnewline
-2.24641185385099 \tabularnewline
-13.1424557868595 \tabularnewline
-8.8605095070061 \tabularnewline
1.02516065435157 \tabularnewline
-0.866508533865272 \tabularnewline
-19.7675197609688 \tabularnewline
15.4056915651299 \tabularnewline
11.6920559636146 \tabularnewline
10.041070702664 \tabularnewline
2.02799133879489 \tabularnewline
-0.31225886289576 \tabularnewline
2.20053579387513 \tabularnewline
1.61526814327317 \tabularnewline
3.57049971317156 \tabularnewline
1.64239891602574 \tabularnewline
6.91185816053712 \tabularnewline
1.64239805836405 \tabularnewline
-7.81260188981014 \tabularnewline
2.17630918635587 \tabularnewline
1.78952859536275 \tabularnewline
-2.77299667864827 \tabularnewline
14.5331070375232 \tabularnewline
1.63793446611362 \tabularnewline
4.39669192315432 \tabularnewline
-19.5599659032196 \tabularnewline
14.6027497833038 \tabularnewline
0.742248049870796 \tabularnewline
-2.58251925483364 \tabularnewline
-12.5736732865189 \tabularnewline
9.51626555352687 \tabularnewline
3.11946457725207 \tabularnewline
-9.78359635478228 \tabularnewline
-11.0447936174005 \tabularnewline
4.69109949771337 \tabularnewline
8.04027199737448 \tabularnewline
10.8114051144394 \tabularnewline
12.0805718390102 \tabularnewline
-4.52045178863318 \tabularnewline
-11.448114337014 \tabularnewline
-15.9162037507904 \tabularnewline
-17.9891931646807 \tabularnewline
-8.91224696923291 \tabularnewline
-5.22479521037894 \tabularnewline
-6.74153199954435 \tabularnewline
-1.16966015763228 \tabularnewline
6.85734298575699 \tabularnewline
17.475212634311 \tabularnewline
-0.417081814084668 \tabularnewline
7.79776581014903 \tabularnewline
9.11674978498741 \tabularnewline
-8.0875415530154 \tabularnewline
-28.7904079480977 \tabularnewline
-11.7364244336704 \tabularnewline
-0.517359261025376 \tabularnewline
-8.45672115320122 \tabularnewline
-5.17505342916138 \tabularnewline
-10.9802150780661 \tabularnewline
-14.2031334386438 \tabularnewline
-15.499606261912 \tabularnewline
-5.24641834917838 \tabularnewline
-7.21648946123878 \tabularnewline
-13.9676152625016 \tabularnewline
1.08656717998019 \tabularnewline
-2.28429099267669 \tabularnewline
23.2204409368314 \tabularnewline
18.5207583783613 \tabularnewline
9.89929822514478 \tabularnewline
15.3700978581519 \tabularnewline
6.0539799168746 \tabularnewline
-1.86541247603145 \tabularnewline
-12.2646109478956 \tabularnewline
-1.61880560024383 \tabularnewline
-0.164595672610631 \tabularnewline
2.56366320235611 \tabularnewline
12.8549374536406 \tabularnewline
20.9716499572278 \tabularnewline
10.5867523005227 \tabularnewline
-6.7309272260718 \tabularnewline
0.227898506946985 \tabularnewline
-9.12947770460141 \tabularnewline
-0.151419051399898 \tabularnewline
\hline
\end{tabular}
%Source: https://freestatistics.org/blog/index.php?pk=300982&T=2

[TABLE]
[ROW][C]Estimated ARIMA Residuals[/C][/ROW]
[ROW][C]Value[/C][/ROW]
[ROW][C]-7.9069305058904[/C][/ROW]
[ROW][C]15.886809940795[/C][/ROW]
[ROW][C]17.8326295952337[/C][/ROW]
[ROW][C]14.5287503990584[/C][/ROW]
[ROW][C]22.5458711736374[/C][/ROW]
[ROW][C]16.3167180428559[/C][/ROW]
[ROW][C]-62.4616038932615[/C][/ROW]
[ROW][C]75.3230095420979[/C][/ROW]
[ROW][C]19.6332924708293[/C][/ROW]
[ROW][C]-4.38728801644035[/C][/ROW]
[ROW][C]-11.7315996919376[/C][/ROW]
[ROW][C]-13.1811750900239[/C][/ROW]
[ROW][C]6.99138850608982[/C][/ROW]
[ROW][C]-9.92460959747129[/C][/ROW]
[ROW][C]-4.87189871767049[/C][/ROW]
[ROW][C]-10.0424527099535[/C][/ROW]
[ROW][C]1.66301583229202[/C][/ROW]
[ROW][C]-4.83852702553587[/C][/ROW]
[ROW][C]-13.3748372538283[/C][/ROW]
[ROW][C]0.933193884116847[/C][/ROW]
[ROW][C]2.98216574436323[/C][/ROW]
[ROW][C]4.30543627192449[/C][/ROW]
[ROW][C]-9.10221929052505[/C][/ROW]
[ROW][C]0.789212364069229[/C][/ROW]
[ROW][C]-13.8879159317472[/C][/ROW]
[ROW][C]6.97273296375993[/C][/ROW]
[ROW][C]-7.49986047380901[/C][/ROW]
[ROW][C]-0.776363791839644[/C][/ROW]
[ROW][C]-10.4669616016234[/C][/ROW]
[ROW][C]-14.1832084870847[/C][/ROW]
[ROW][C]5.81221770425053[/C][/ROW]
[ROW][C]5.51214330962739[/C][/ROW]
[ROW][C]8.29136678653412[/C][/ROW]
[ROW][C]2.28549821817342[/C][/ROW]
[ROW][C]-1.18255571923783[/C][/ROW]
[ROW][C]-2.24641185385099[/C][/ROW]
[ROW][C]-13.1424557868595[/C][/ROW]
[ROW][C]-8.8605095070061[/C][/ROW]
[ROW][C]1.02516065435157[/C][/ROW]
[ROW][C]-0.866508533865272[/C][/ROW]
[ROW][C]-19.7675197609688[/C][/ROW]
[ROW][C]15.4056915651299[/C][/ROW]
[ROW][C]11.6920559636146[/C][/ROW]
[ROW][C]10.041070702664[/C][/ROW]
[ROW][C]2.02799133879489[/C][/ROW]
[ROW][C]-0.31225886289576[/C][/ROW]
[ROW][C]2.20053579387513[/C][/ROW]
[ROW][C]1.61526814327317[/C][/ROW]
[ROW][C]3.57049971317156[/C][/ROW]
[ROW][C]1.64239891602574[/C][/ROW]
[ROW][C]6.91185816053712[/C][/ROW]
[ROW][C]1.64239805836405[/C][/ROW]
[ROW][C]-7.81260188981014[/C][/ROW]
[ROW][C]2.17630918635587[/C][/ROW]
[ROW][C]1.78952859536275[/C][/ROW]
[ROW][C]-2.77299667864827[/C][/ROW]
[ROW][C]14.5331070375232[/C][/ROW]
[ROW][C]1.63793446611362[/C][/ROW]
[ROW][C]4.39669192315432[/C][/ROW]
[ROW][C]-19.5599659032196[/C][/ROW]
[ROW][C]14.6027497833038[/C][/ROW]
[ROW][C]0.742248049870796[/C][/ROW]
[ROW][C]-2.58251925483364[/C][/ROW]
[ROW][C]-12.5736732865189[/C][/ROW]
[ROW][C]9.51626555352687[/C][/ROW]
[ROW][C]3.11946457725207[/C][/ROW]
[ROW][C]-9.78359635478228[/C][/ROW]
[ROW][C]-11.0447936174005[/C][/ROW]
[ROW][C]4.69109949771337[/C][/ROW]
[ROW][C]8.04027199737448[/C][/ROW]
[ROW][C]10.8114051144394[/C][/ROW]
[ROW][C]12.0805718390102[/C][/ROW]
[ROW][C]-4.52045178863318[/C][/ROW]
[ROW][C]-11.448114337014[/C][/ROW]
[ROW][C]-15.9162037507904[/C][/ROW]
[ROW][C]-17.9891931646807[/C][/ROW]
[ROW][C]-8.91224696923291[/C][/ROW]
[ROW][C]-5.22479521037894[/C][/ROW]
[ROW][C]-6.74153199954435[/C][/ROW]
[ROW][C]-1.16966015763228[/C][/ROW]
[ROW][C]6.85734298575699[/C][/ROW]
[ROW][C]17.475212634311[/C][/ROW]
[ROW][C]-0.417081814084668[/C][/ROW]
[ROW][C]7.79776581014903[/C][/ROW]
[ROW][C]9.11674978498741[/C][/ROW]
[ROW][C]-8.0875415530154[/C][/ROW]
[ROW][C]-28.7904079480977[/C][/ROW]
[ROW][C]-11.7364244336704[/C][/ROW]
[ROW][C]-0.517359261025376[/C][/ROW]
[ROW][C]-8.45672115320122[/C][/ROW]
[ROW][C]-5.17505342916138[/C][/ROW]
[ROW][C]-10.9802150780661[/C][/ROW]
[ROW][C]-14.2031334386438[/C][/ROW]
[ROW][C]-15.499606261912[/C][/ROW]
[ROW][C]-5.24641834917838[/C][/ROW]
[ROW][C]-7.21648946123878[/C][/ROW]
[ROW][C]-13.9676152625016[/C][/ROW]
[ROW][C]1.08656717998019[/C][/ROW]
[ROW][C]-2.28429099267669[/C][/ROW]
[ROW][C]23.2204409368314[/C][/ROW]
[ROW][C]18.5207583783613[/C][/ROW]
[ROW][C]9.89929822514478[/C][/ROW]
[ROW][C]15.3700978581519[/C][/ROW]
[ROW][C]6.0539799168746[/C][/ROW]
[ROW][C]-1.86541247603145[/C][/ROW]
[ROW][C]-12.2646109478956[/C][/ROW]
[ROW][C]-1.61880560024383[/C][/ROW]
[ROW][C]-0.164595672610631[/C][/ROW]
[ROW][C]2.56366320235611[/C][/ROW]
[ROW][C]12.8549374536406[/C][/ROW]
[ROW][C]20.9716499572278[/C][/ROW]
[ROW][C]10.5867523005227[/C][/ROW]
[ROW][C]-6.7309272260718[/C][/ROW]
[ROW][C]0.227898506946985[/C][/ROW]
[ROW][C]-9.12947770460141[/C][/ROW]
[ROW][C]-0.151419051399898[/C][/ROW]
[/TABLE]
Source: https://freestatistics.org/blog/index.php?pk=300982&T=2

Globally Unique Identifier (entire table): ba.freestatistics.org/blog/index.php?pk=300982&T=2

As an alternative you can also use a QR Code:  

The GUIDs for individual cells are displayed in the table below:

Estimated ARIMA Residuals
Value
-7.9069305058904
15.886809940795
17.8326295952337
14.5287503990584
22.5458711736374
16.3167180428559
-62.4616038932615
75.3230095420979
19.6332924708293
-4.38728801644035
-11.7315996919376
-13.1811750900239
6.99138850608982
-9.92460959747129
-4.87189871767049
-10.0424527099535
1.66301583229202
-4.83852702553587
-13.3748372538283
0.933193884116847
2.98216574436323
4.30543627192449
-9.10221929052505
0.789212364069229
-13.8879159317472
6.97273296375993
-7.49986047380901
-0.776363791839644
-10.4669616016234
-14.1832084870847
5.81221770425053
5.51214330962739
8.29136678653412
2.28549821817342
-1.18255571923783
-2.24641185385099
-13.1424557868595
-8.8605095070061
1.02516065435157
-0.866508533865272
-19.7675197609688
15.4056915651299
11.6920559636146
10.041070702664
2.02799133879489
-0.31225886289576
2.20053579387513
1.61526814327317
3.57049971317156
1.64239891602574
6.91185816053712
1.64239805836405
-7.81260188981014
2.17630918635587
1.78952859536275
-2.77299667864827
14.5331070375232
1.63793446611362
4.39669192315432
-19.5599659032196
14.6027497833038
0.742248049870796
-2.58251925483364
-12.5736732865189
9.51626555352687
3.11946457725207
-9.78359635478228
-11.0447936174005
4.69109949771337
8.04027199737448
10.8114051144394
12.0805718390102
-4.52045178863318
-11.448114337014
-15.9162037507904
-17.9891931646807
-8.91224696923291
-5.22479521037894
-6.74153199954435
-1.16966015763228
6.85734298575699
17.475212634311
-0.417081814084668
7.79776581014903
9.11674978498741
-8.0875415530154
-28.7904079480977
-11.7364244336704
-0.517359261025376
-8.45672115320122
-5.17505342916138
-10.9802150780661
-14.2031334386438
-15.499606261912
-5.24641834917838
-7.21648946123878
-13.9676152625016
1.08656717998019
-2.28429099267669
23.2204409368314
18.5207583783613
9.89929822514478
15.3700978581519
6.0539799168746
-1.86541247603145
-12.2646109478956
-1.61880560024383
-0.164595672610631
2.56366320235611
12.8549374536406
20.9716499572278
10.5867523005227
-6.7309272260718
0.227898506946985
-9.12947770460141
-0.151419051399898


Parameters (Session):
par1 = FALSE ; par2 = 1 ; par3 = 2 ; par4 = 0 ; par5 = 1 ; par6 = 3 ; par7 = 1 ; par8 = 0 ; par9 = 0 ;
Parameters (R input):
par1 = FALSE ; par2 = 1 ; par3 = 2 ; par4 = 0 ; par5 = 1 ; par6 = 3 ; par7 = 1 ; par8 = 0 ; par9 = 0 ;
R code (references can be found in the software module):
library(lattice)
if (par1 == 'TRUE') par1 <- TRUE
if (par1 == 'FALSE') par1 <- FALSE
par2 <- as.numeric(par2) #Box-Cox lambda transformation parameter
par3 <- as.numeric(par3) #degree of non-seasonal differencing
par4 <- as.numeric(par4) #degree of seasonal differencing
par5 <- as.numeric(par5) #seasonal period
par6 <- as.numeric(par6) #degree (p) of the non-seasonal AR(p) polynomial
par7 <- as.numeric(par7) #degree (q) of the non-seasonal MA(q) polynomial
par8 <- as.numeric(par8) #degree (P) of the seasonal AR(P) polynomial
par9 <- as.numeric(par9) #degree (Q) of the seasonal MA(Q) polynomial
armaGR <- function(arima.out, names, n){
try1 <- arima.out$coef
try2 <- sqrt(diag(arima.out$var.coef))
try.data.frame <- data.frame(matrix(NA,ncol=4,nrow=length(names)))
dimnames(try.data.frame) <- list(names,c('coef','std','tstat','pv'))
try.data.frame[,1] <- try1
for(i in 1:length(try2)) try.data.frame[which(rownames(try.data.frame)==names(try2)[i]),2] <- try2[i]
try.data.frame[,3] <- try.data.frame[,1] / try.data.frame[,2]
try.data.frame[,4] <- round((1-pt(abs(try.data.frame[,3]),df=n-(length(try2)+1)))*2,5)
vector <- rep(NA,length(names))
vector[is.na(try.data.frame[,4])] <- 0
maxi <- which.max(try.data.frame[,4])
continue <- max(try.data.frame[,4],na.rm=TRUE) > .05
vector[maxi] <- 0
list(summary=try.data.frame,next.vector=vector,continue=continue)
}
arimaSelect <- function(series, order=c(13,0,0), seasonal=list(order=c(2,0,0),period=12), include.mean=F){
nrc <- order[1]+order[3]+seasonal$order[1]+seasonal$order[3]
coeff <- matrix(NA, nrow=nrc*2, ncol=nrc)
pval <- matrix(NA, nrow=nrc*2, ncol=nrc)
mylist <- rep(list(NULL), nrc)
names <- NULL
if(order[1] > 0) names <- paste('ar',1:order[1],sep='')
if(order[3] > 0) names <- c( names , paste('ma',1:order[3],sep='') )
if(seasonal$order[1] > 0) names <- c(names, paste('sar',1:seasonal$order[1],sep=''))
if(seasonal$order[3] > 0) names <- c(names, paste('sma',1:seasonal$order[3],sep=''))
arima.out <- arima(series, order=order, seasonal=seasonal, include.mean=include.mean, method='ML')
mylist[[1]] <- arima.out
last.arma <- armaGR(arima.out, names, length(series))
mystop <- FALSE
i <- 1
coeff[i,] <- last.arma[[1]][,1]
pval [i,] <- last.arma[[1]][,4]
i <- 2
aic <- arima.out$aic
while(!mystop){
mylist[[i]] <- arima.out
arima.out <- arima(series, order=order, seasonal=seasonal, include.mean=include.mean, method='ML', fixed=last.arma$next.vector)
aic <- c(aic, arima.out$aic)
last.arma <- armaGR(arima.out, names, length(series))
mystop <- !last.arma$continue
coeff[i,] <- last.arma[[1]][,1]
pval [i,] <- last.arma[[1]][,4]
i <- i+1
}
list(coeff, pval, mylist, aic=aic)
}
arimaSelectplot <- function(arimaSelect.out,noms,choix){
noms <- names(arimaSelect.out[[3]][[1]]$coef)
coeff <- arimaSelect.out[[1]]
k <- min(which(is.na(coeff[,1])))-1
coeff <- coeff[1:k,]
pval <- arimaSelect.out[[2]][1:k,]
aic <- arimaSelect.out$aic[1:k]
coeff[coeff==0] <- NA
n <- ncol(coeff)
if(missing(choix)) choix <- k
layout(matrix(c(1,1,1,2,
3,3,3,2,
3,3,3,4,
5,6,7,7),nr=4),
widths=c(10,35,45,15),
heights=c(30,30,15,15))
couleurs <- rainbow(75)[1:50]#(50)
ticks <- pretty(coeff)
par(mar=c(1,1,3,1))
plot(aic,k:1-.5,type='o',pch=21,bg='blue',cex=2,axes=F,lty=2,xpd=NA)
points(aic[choix],k-choix+.5,pch=21,cex=4,bg=2,xpd=NA)
title('aic',line=2)
par(mar=c(3,0,0,0))
plot(0,axes=F,xlab='',ylab='',xlim=range(ticks),ylim=c(.1,1))
rect(xleft = min(ticks) + (0:49)/50*(max(ticks)-min(ticks)),
xright = min(ticks) + (1:50)/50*(max(ticks)-min(ticks)),
ytop = rep(1,50),
ybottom= rep(0,50),col=couleurs,border=NA)
axis(1,ticks)
rect(xleft=min(ticks),xright=max(ticks),ytop=1,ybottom=0)
text(mean(coeff,na.rm=T),.5,'coefficients',cex=2,font=2)
par(mar=c(1,1,3,1))
image(1:n,1:k,t(coeff[k:1,]),axes=F,col=couleurs,zlim=range(ticks))
for(i in 1:n) for(j in 1:k) if(!is.na(coeff[j,i])) {
if(pval[j,i]<.01) symb = 'green'
else if( (pval[j,i]<.05) & (pval[j,i]>=.01)) symb = 'orange'
else if( (pval[j,i]<.1) & (pval[j,i]>=.05)) symb = 'red'
else symb = 'black'
polygon(c(i+.5 ,i+.2 ,i+.5 ,i+.5),
c(k-j+0.5,k-j+0.5,k-j+0.8,k-j+0.5),
col=symb)
if(j==choix) {
rect(xleft=i-.5,
xright=i+.5,
ybottom=k-j+1.5,
ytop=k-j+.5,
lwd=4)
text(i,
k-j+1,
round(coeff[j,i],2),
cex=1.2,
font=2)
}
else{
rect(xleft=i-.5,xright=i+.5,ybottom=k-j+1.5,ytop=k-j+.5)
text(i,k-j+1,round(coeff[j,i],2),cex=1.2,font=1)
}
}
axis(3,1:n,noms)
par(mar=c(0.5,0,0,0.5))
plot(0,axes=F,xlab='',ylab='',type='n',xlim=c(0,8),ylim=c(-.2,.8))
cols <- c('green','orange','red','black')
niv <- c('0','0.01','0.05','0.1')
for(i in 0:3){
polygon(c(1+2*i ,1+2*i ,1+2*i-.5 ,1+2*i),
c(.4 ,.7 , .4 , .4),
col=cols[i+1])
text(2*i,0.5,niv[i+1],cex=1.5)
}
text(8,.5,1,cex=1.5)
text(4,0,'p-value',cex=2)
box()
residus <- arimaSelect.out[[3]][[choix]]$res
par(mar=c(1,2,4,1))
acf(residus,main='')
title('acf',line=.5)
par(mar=c(1,2,4,1))
pacf(residus,main='')
title('pacf',line=.5)
par(mar=c(2,2,4,1))
qqnorm(residus,main='')
title('qq-norm',line=.5)
qqline(residus)
residus
}
if (par2 == 0) x <- log(x)
if (par2 != 0) x <- x^par2
(selection <- arimaSelect(x, order=c(par6,par3,par7), seasonal=list(order=c(par8,par4,par9), period=par5)))
bitmap(file='test1.png')
resid <- arimaSelectplot(selection)
dev.off()
resid
bitmap(file='test2.png')
acf(resid,length(resid)/2, main='Residual Autocorrelation Function')
dev.off()
bitmap(file='test3.png')
pacf(resid,length(resid)/2, main='Residual Partial Autocorrelation Function')
dev.off()
bitmap(file='test4.png')
cpgram(resid, main='Residual Cumulative Periodogram')
dev.off()
bitmap(file='test5.png')
hist(resid, main='Residual Histogram', xlab='values of Residuals')
dev.off()
bitmap(file='test6.png')
densityplot(~resid,col='black',main='Residual Density Plot', xlab='values of Residuals')
dev.off()
bitmap(file='test7.png')
qqnorm(resid, main='Residual Normal Q-Q Plot')
qqline(resid)
dev.off()
ncols <- length(selection[[1]][1,])
nrows <- length(selection[[2]][,1])-1
load(file='createtable')
a<-table.start()
a<-table.row.start(a)
a<-table.element(a,'ARIMA Parameter Estimation and Backward Selection', ncols+1,TRUE)
a<-table.row.end(a)
a<-table.row.start(a)
a<-table.element(a,'Iteration', header=TRUE)
for (i in 1:ncols) {
a<-table.element(a,names(selection[[3]][[1]]$coef)[i],header=TRUE)
}
a<-table.row.end(a)
for (j in 1:nrows) {
a<-table.row.start(a)
mydum <- 'Estimates ('
mydum <- paste(mydum,j)
mydum <- paste(mydum,')')
a<-table.element(a,mydum, header=TRUE)
for (i in 1:ncols) {
a<-table.element(a,round(selection[[1]][j,i],4))
}
a<-table.row.end(a)
a<-table.row.start(a)
a<-table.element(a,'(p-val)', header=TRUE)
for (i in 1:ncols) {
mydum <- '('
mydum <- paste(mydum,round(selection[[2]][j,i],4),sep='')
mydum <- paste(mydum,')')
a<-table.element(a,mydum)
}
a<-table.row.end(a)
}
a<-table.end(a)
table.save(a,file='mytable.tab')
a<-table.start()
a<-table.row.start(a)
a<-table.element(a,'Estimated ARIMA Residuals', 1,TRUE)
a<-table.row.end(a)
a<-table.row.start(a)
a<-table.element(a,'Value', 1,TRUE)
a<-table.row.end(a)
for (i in (par4*par5+par3):length(resid)) {
a<-table.row.start(a)
a<-table.element(a,resid[i])
a<-table.row.end(a)
}
a<-table.end(a)
table.save(a,file='mytable1.tab')