Free Statistics

of Irreproducible Research!

Author's title

Author*The author of this computation has been verified*
R Software Modulerwasp_autocorrelation.wasp
Title produced by software(Partial) Autocorrelation Function
Date of computationSun, 18 Dec 2016 11:52:42 +0100
Cite this page as followsStatistical Computations at FreeStatistics.org, Office for Research Development and Education, URL https://freestatistics.org/blog/index.php?v=date/2016/Dec/18/t1482058475ebdnq009qt5k2t4.htm/, Retrieved Wed, 08 May 2024 18:48:30 +0000
Statistical Computations at FreeStatistics.org, Office for Research Development and Education, URL https://freestatistics.org/blog/index.php?pk=301000, Retrieved Wed, 08 May 2024 18:48:30 +0000
QR Codes:

Original text written by user:
IsPrivate?No (this computation is public)
User-defined keywords
Estimated Impact117
Family? (F = Feedback message, R = changed R code, M = changed R Module, P = changed Parameters, D = changed Data)
-       [(Partial) Autocorrelation Function] [n2383 autocorr 2] [2016-12-18 10:52:42] [afe7f6443461a2cd6ee0b843643e84a9] [Current]
Feedback Forum

Post a new message
Dataseries X:
2119.9
2108.7
2092
2104.2
2110.1
2114
2138.8
2165.5
2155.1
2135.2
2163.1
2175.2
2183.3
2201.5
2212.3
2223.8
2241.9
2269.2
2261.4
2273.4
2299.3
2315.5
2338.7
2333
2311
2303.6
2310.5
2295.8
2265.5
2271.1
2231.9
2245
2249.7
2300.5
2280.4
2290.7
2261.5
2259.1
2249.8
2271.2
2259
2259.4
2250.2
2243.3
2234.3
2216.5
2197.6
2211.7
2206.7
2214.6
2229.8
2219.5
2213.8
2214.1
2224.1
2229.6
2251.7
2262.9
2268.9
2293.7
2312.4
2342
2327.4
2366.2
2371.8
2364.4
2370.5
2412.8
2447.3
2443.5
2459.3
2480.7
2504.4
2505.5
2534
2538.7
2538.1
2522
2566.4
2572.8
2557.3
2541
2540.7
2508.5
2567.1
2553.6
2522.4
2520.6
2499.4
2470.8
2479.3
2481.8
2470.3
2491
2479.1
2456.6
2456.1
2482.2
2444.7
2425.3
2389.3
2367.7
2339.3
2342.4
2343.6
2346.3
2363.5
2338.7
2369.4
2356
2348.6
2349.7
2371.9
2364.9
2394.1
2399.2


Summary of computational transaction
Raw Input view raw input (R code)
Raw Outputview raw output of R engine
Computing time1 seconds
R ServerBig Analytics Cloud Computing Center

\begin{tabular}{lllllllll}
\hline
Summary of computational transaction \tabularnewline
Raw Input view raw input (R code)  \tabularnewline
Raw Outputview raw output of R engine  \tabularnewline
Computing time1 seconds \tabularnewline
R ServerBig Analytics Cloud Computing Center \tabularnewline
\hline
\end{tabular}
%Source: https://freestatistics.org/blog/index.php?pk=301000&T=0

[TABLE]
[ROW]
Summary of computational transaction[/C][/ROW] [ROW]Raw Input[/C] view raw input (R code) [/C][/ROW] [ROW]Raw Output[/C]view raw output of R engine [/C][/ROW] [ROW]Computing time[/C]1 seconds[/C][/ROW] [ROW]R Server[/C]Big Analytics Cloud Computing Center[/C][/ROW] [/TABLE] Source: https://freestatistics.org/blog/index.php?pk=301000&T=0

Globally Unique Identifier (entire table): ba.freestatistics.org/blog/index.php?pk=301000&T=0

As an alternative you can also use a QR Code:  

The GUIDs for individual cells are displayed in the table below:

Summary of computational transaction
Raw Input view raw input (R code)
Raw Outputview raw output of R engine
Computing time1 seconds
R ServerBig Analytics Cloud Computing Center


Autocorrelation Function
Time lag kACF(k)T-STATP-value
10.0291690.31280.377497
20.1478751.58580.057767
30.0895350.96020.169495
40.1984982.12870.017708
5-0.096189-1.03150.152233
60.3156513.3850.000487
70.1005651.07840.141546
8-0.007424-0.07960.46834
90.0793130.85050.198397
100.0382490.41020.341221
110.0514810.55210.290986
120.0738780.79220.214924
130.0327040.35070.363224
14-0.108413-1.16260.1237
150.0418110.44840.327364
16-0.051629-0.55370.290444
17-0.014506-0.15560.438326
18-0.025701-0.27560.391669
19-0.004959-0.05320.478841
20-0.192071-2.05970.020841
210.0136630.14650.441884
22-0.105861-1.13520.129318
23-0.13185-1.41390.080042
24-0.072425-0.77670.219475
25-0.14938-1.60190.055958
26-0.130339-1.39770.082442
27-0.133947-1.43640.076798
28-0.044-0.47180.318964
29-0.189343-2.03050.022308
30-0.02338-0.25070.401238
31-0.272147-2.91850.002116
32-0.17237-1.84850.033552
33-0.183701-1.970.025622
340.0137220.14720.441634
35-0.073037-0.78320.217549
36-0.042187-0.45240.325915
370.0042640.04570.481803
38-0.083224-0.89250.187
39-0.087886-0.94250.173964
40-0.028573-0.30640.379924
410.0272280.2920.385411
42-0.081588-0.87490.191716
430.0606840.65080.25825
44-0.055331-0.59340.277053
450.1119011.20.116301
460.020020.21470.415193
470.1087281.1660.123017
48-0.072138-0.77360.220378

\begin{tabular}{lllllllll}
\hline
Autocorrelation Function \tabularnewline
Time lag k & ACF(k) & T-STAT & P-value \tabularnewline
1 & 0.029169 & 0.3128 & 0.377497 \tabularnewline
2 & 0.147875 & 1.5858 & 0.057767 \tabularnewline
3 & 0.089535 & 0.9602 & 0.169495 \tabularnewline
4 & 0.198498 & 2.1287 & 0.017708 \tabularnewline
5 & -0.096189 & -1.0315 & 0.152233 \tabularnewline
6 & 0.315651 & 3.385 & 0.000487 \tabularnewline
7 & 0.100565 & 1.0784 & 0.141546 \tabularnewline
8 & -0.007424 & -0.0796 & 0.46834 \tabularnewline
9 & 0.079313 & 0.8505 & 0.198397 \tabularnewline
10 & 0.038249 & 0.4102 & 0.341221 \tabularnewline
11 & 0.051481 & 0.5521 & 0.290986 \tabularnewline
12 & 0.073878 & 0.7922 & 0.214924 \tabularnewline
13 & 0.032704 & 0.3507 & 0.363224 \tabularnewline
14 & -0.108413 & -1.1626 & 0.1237 \tabularnewline
15 & 0.041811 & 0.4484 & 0.327364 \tabularnewline
16 & -0.051629 & -0.5537 & 0.290444 \tabularnewline
17 & -0.014506 & -0.1556 & 0.438326 \tabularnewline
18 & -0.025701 & -0.2756 & 0.391669 \tabularnewline
19 & -0.004959 & -0.0532 & 0.478841 \tabularnewline
20 & -0.192071 & -2.0597 & 0.020841 \tabularnewline
21 & 0.013663 & 0.1465 & 0.441884 \tabularnewline
22 & -0.105861 & -1.1352 & 0.129318 \tabularnewline
23 & -0.13185 & -1.4139 & 0.080042 \tabularnewline
24 & -0.072425 & -0.7767 & 0.219475 \tabularnewline
25 & -0.14938 & -1.6019 & 0.055958 \tabularnewline
26 & -0.130339 & -1.3977 & 0.082442 \tabularnewline
27 & -0.133947 & -1.4364 & 0.076798 \tabularnewline
28 & -0.044 & -0.4718 & 0.318964 \tabularnewline
29 & -0.189343 & -2.0305 & 0.022308 \tabularnewline
30 & -0.02338 & -0.2507 & 0.401238 \tabularnewline
31 & -0.272147 & -2.9185 & 0.002116 \tabularnewline
32 & -0.17237 & -1.8485 & 0.033552 \tabularnewline
33 & -0.183701 & -1.97 & 0.025622 \tabularnewline
34 & 0.013722 & 0.1472 & 0.441634 \tabularnewline
35 & -0.073037 & -0.7832 & 0.217549 \tabularnewline
36 & -0.042187 & -0.4524 & 0.325915 \tabularnewline
37 & 0.004264 & 0.0457 & 0.481803 \tabularnewline
38 & -0.083224 & -0.8925 & 0.187 \tabularnewline
39 & -0.087886 & -0.9425 & 0.173964 \tabularnewline
40 & -0.028573 & -0.3064 & 0.379924 \tabularnewline
41 & 0.027228 & 0.292 & 0.385411 \tabularnewline
42 & -0.081588 & -0.8749 & 0.191716 \tabularnewline
43 & 0.060684 & 0.6508 & 0.25825 \tabularnewline
44 & -0.055331 & -0.5934 & 0.277053 \tabularnewline
45 & 0.111901 & 1.2 & 0.116301 \tabularnewline
46 & 0.02002 & 0.2147 & 0.415193 \tabularnewline
47 & 0.108728 & 1.166 & 0.123017 \tabularnewline
48 & -0.072138 & -0.7736 & 0.220378 \tabularnewline
\hline
\end{tabular}
%Source: https://freestatistics.org/blog/index.php?pk=301000&T=1

[TABLE]
[ROW][C]Autocorrelation Function[/C][/ROW]
[ROW][C]Time lag k[/C][C]ACF(k)[/C][C]T-STAT[/C][C]P-value[/C][/ROW]
[ROW][C]1[/C][C]0.029169[/C][C]0.3128[/C][C]0.377497[/C][/ROW]
[ROW][C]2[/C][C]0.147875[/C][C]1.5858[/C][C]0.057767[/C][/ROW]
[ROW][C]3[/C][C]0.089535[/C][C]0.9602[/C][C]0.169495[/C][/ROW]
[ROW][C]4[/C][C]0.198498[/C][C]2.1287[/C][C]0.017708[/C][/ROW]
[ROW][C]5[/C][C]-0.096189[/C][C]-1.0315[/C][C]0.152233[/C][/ROW]
[ROW][C]6[/C][C]0.315651[/C][C]3.385[/C][C]0.000487[/C][/ROW]
[ROW][C]7[/C][C]0.100565[/C][C]1.0784[/C][C]0.141546[/C][/ROW]
[ROW][C]8[/C][C]-0.007424[/C][C]-0.0796[/C][C]0.46834[/C][/ROW]
[ROW][C]9[/C][C]0.079313[/C][C]0.8505[/C][C]0.198397[/C][/ROW]
[ROW][C]10[/C][C]0.038249[/C][C]0.4102[/C][C]0.341221[/C][/ROW]
[ROW][C]11[/C][C]0.051481[/C][C]0.5521[/C][C]0.290986[/C][/ROW]
[ROW][C]12[/C][C]0.073878[/C][C]0.7922[/C][C]0.214924[/C][/ROW]
[ROW][C]13[/C][C]0.032704[/C][C]0.3507[/C][C]0.363224[/C][/ROW]
[ROW][C]14[/C][C]-0.108413[/C][C]-1.1626[/C][C]0.1237[/C][/ROW]
[ROW][C]15[/C][C]0.041811[/C][C]0.4484[/C][C]0.327364[/C][/ROW]
[ROW][C]16[/C][C]-0.051629[/C][C]-0.5537[/C][C]0.290444[/C][/ROW]
[ROW][C]17[/C][C]-0.014506[/C][C]-0.1556[/C][C]0.438326[/C][/ROW]
[ROW][C]18[/C][C]-0.025701[/C][C]-0.2756[/C][C]0.391669[/C][/ROW]
[ROW][C]19[/C][C]-0.004959[/C][C]-0.0532[/C][C]0.478841[/C][/ROW]
[ROW][C]20[/C][C]-0.192071[/C][C]-2.0597[/C][C]0.020841[/C][/ROW]
[ROW][C]21[/C][C]0.013663[/C][C]0.1465[/C][C]0.441884[/C][/ROW]
[ROW][C]22[/C][C]-0.105861[/C][C]-1.1352[/C][C]0.129318[/C][/ROW]
[ROW][C]23[/C][C]-0.13185[/C][C]-1.4139[/C][C]0.080042[/C][/ROW]
[ROW][C]24[/C][C]-0.072425[/C][C]-0.7767[/C][C]0.219475[/C][/ROW]
[ROW][C]25[/C][C]-0.14938[/C][C]-1.6019[/C][C]0.055958[/C][/ROW]
[ROW][C]26[/C][C]-0.130339[/C][C]-1.3977[/C][C]0.082442[/C][/ROW]
[ROW][C]27[/C][C]-0.133947[/C][C]-1.4364[/C][C]0.076798[/C][/ROW]
[ROW][C]28[/C][C]-0.044[/C][C]-0.4718[/C][C]0.318964[/C][/ROW]
[ROW][C]29[/C][C]-0.189343[/C][C]-2.0305[/C][C]0.022308[/C][/ROW]
[ROW][C]30[/C][C]-0.02338[/C][C]-0.2507[/C][C]0.401238[/C][/ROW]
[ROW][C]31[/C][C]-0.272147[/C][C]-2.9185[/C][C]0.002116[/C][/ROW]
[ROW][C]32[/C][C]-0.17237[/C][C]-1.8485[/C][C]0.033552[/C][/ROW]
[ROW][C]33[/C][C]-0.183701[/C][C]-1.97[/C][C]0.025622[/C][/ROW]
[ROW][C]34[/C][C]0.013722[/C][C]0.1472[/C][C]0.441634[/C][/ROW]
[ROW][C]35[/C][C]-0.073037[/C][C]-0.7832[/C][C]0.217549[/C][/ROW]
[ROW][C]36[/C][C]-0.042187[/C][C]-0.4524[/C][C]0.325915[/C][/ROW]
[ROW][C]37[/C][C]0.004264[/C][C]0.0457[/C][C]0.481803[/C][/ROW]
[ROW][C]38[/C][C]-0.083224[/C][C]-0.8925[/C][C]0.187[/C][/ROW]
[ROW][C]39[/C][C]-0.087886[/C][C]-0.9425[/C][C]0.173964[/C][/ROW]
[ROW][C]40[/C][C]-0.028573[/C][C]-0.3064[/C][C]0.379924[/C][/ROW]
[ROW][C]41[/C][C]0.027228[/C][C]0.292[/C][C]0.385411[/C][/ROW]
[ROW][C]42[/C][C]-0.081588[/C][C]-0.8749[/C][C]0.191716[/C][/ROW]
[ROW][C]43[/C][C]0.060684[/C][C]0.6508[/C][C]0.25825[/C][/ROW]
[ROW][C]44[/C][C]-0.055331[/C][C]-0.5934[/C][C]0.277053[/C][/ROW]
[ROW][C]45[/C][C]0.111901[/C][C]1.2[/C][C]0.116301[/C][/ROW]
[ROW][C]46[/C][C]0.02002[/C][C]0.2147[/C][C]0.415193[/C][/ROW]
[ROW][C]47[/C][C]0.108728[/C][C]1.166[/C][C]0.123017[/C][/ROW]
[ROW][C]48[/C][C]-0.072138[/C][C]-0.7736[/C][C]0.220378[/C][/ROW]
[/TABLE]
Source: https://freestatistics.org/blog/index.php?pk=301000&T=1

Globally Unique Identifier (entire table): ba.freestatistics.org/blog/index.php?pk=301000&T=1

As an alternative you can also use a QR Code:  

The GUIDs for individual cells are displayed in the table below:

Autocorrelation Function
Time lag kACF(k)T-STATP-value
10.0291690.31280.377497
20.1478751.58580.057767
30.0895350.96020.169495
40.1984982.12870.017708
5-0.096189-1.03150.152233
60.3156513.3850.000487
70.1005651.07840.141546
8-0.007424-0.07960.46834
90.0793130.85050.198397
100.0382490.41020.341221
110.0514810.55210.290986
120.0738780.79220.214924
130.0327040.35070.363224
14-0.108413-1.16260.1237
150.0418110.44840.327364
16-0.051629-0.55370.290444
17-0.014506-0.15560.438326
18-0.025701-0.27560.391669
19-0.004959-0.05320.478841
20-0.192071-2.05970.020841
210.0136630.14650.441884
22-0.105861-1.13520.129318
23-0.13185-1.41390.080042
24-0.072425-0.77670.219475
25-0.14938-1.60190.055958
26-0.130339-1.39770.082442
27-0.133947-1.43640.076798
28-0.044-0.47180.318964
29-0.189343-2.03050.022308
30-0.02338-0.25070.401238
31-0.272147-2.91850.002116
32-0.17237-1.84850.033552
33-0.183701-1.970.025622
340.0137220.14720.441634
35-0.073037-0.78320.217549
36-0.042187-0.45240.325915
370.0042640.04570.481803
38-0.083224-0.89250.187
39-0.087886-0.94250.173964
40-0.028573-0.30640.379924
410.0272280.2920.385411
42-0.081588-0.87490.191716
430.0606840.65080.25825
44-0.055331-0.59340.277053
450.1119011.20.116301
460.020020.21470.415193
470.1087281.1660.123017
48-0.072138-0.77360.220378


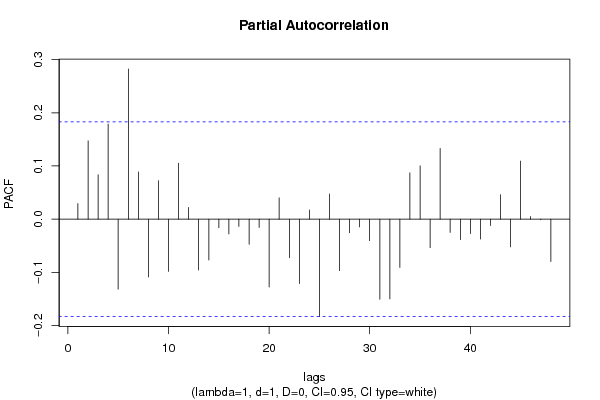
Partial Autocorrelation Function
Time lag kPACF(k)T-STATP-value
10.0291690.31280.377497
20.147151.5780.058656
30.083440.89480.186382
40.1787181.91650.028889
5-0.131548-1.41070.080517
60.2823143.02750.001522
70.088730.95150.171668
8-0.108839-1.16720.122778
90.0721560.77380.220322
10-0.098193-1.0530.147273
110.1051921.12810.130823
120.0219130.2350.407318
13-0.095642-1.02560.153605
14-0.076798-0.82360.205946
15-0.016136-0.1730.431461
16-0.0277-0.2970.383484
17-0.013587-0.14570.442205
18-0.047284-0.50710.306541
19-0.015403-0.16520.434548
20-0.127644-1.36880.086859
210.0399730.42870.334485
22-0.072549-0.7780.219084
23-0.120963-1.29720.098581
240.0172070.18450.426964
25-0.183229-1.96490.025918
260.0474510.50890.305916
27-0.09676-1.03760.150808
28-0.025609-0.27460.392049
29-0.014548-0.1560.438151
30-0.04073-0.43680.331544
31-0.15049-1.61380.054653
32-0.14982-1.60660.055438
33-0.090611-0.97170.16662
340.0870790.93380.176176
350.1002361.07490.142332
36-0.053542-0.57420.283485
370.1329691.42590.078298
38-0.024855-0.26650.395152
39-0.038408-0.41190.340599
40-0.027145-0.29110.385749
41-0.037162-0.39850.345492
42-0.012018-0.12890.44884
430.0459610.49290.31152
44-0.052068-0.55840.288841
450.1091371.17040.122136
460.0050070.05370.478635
47-0.001233-0.01320.494738
48-0.079537-0.85290.197733

\begin{tabular}{lllllllll}
\hline
Partial Autocorrelation Function \tabularnewline
Time lag k & PACF(k) & T-STAT & P-value \tabularnewline
1 & 0.029169 & 0.3128 & 0.377497 \tabularnewline
2 & 0.14715 & 1.578 & 0.058656 \tabularnewline
3 & 0.08344 & 0.8948 & 0.186382 \tabularnewline
4 & 0.178718 & 1.9165 & 0.028889 \tabularnewline
5 & -0.131548 & -1.4107 & 0.080517 \tabularnewline
6 & 0.282314 & 3.0275 & 0.001522 \tabularnewline
7 & 0.08873 & 0.9515 & 0.171668 \tabularnewline
8 & -0.108839 & -1.1672 & 0.122778 \tabularnewline
9 & 0.072156 & 0.7738 & 0.220322 \tabularnewline
10 & -0.098193 & -1.053 & 0.147273 \tabularnewline
11 & 0.105192 & 1.1281 & 0.130823 \tabularnewline
12 & 0.021913 & 0.235 & 0.407318 \tabularnewline
13 & -0.095642 & -1.0256 & 0.153605 \tabularnewline
14 & -0.076798 & -0.8236 & 0.205946 \tabularnewline
15 & -0.016136 & -0.173 & 0.431461 \tabularnewline
16 & -0.0277 & -0.297 & 0.383484 \tabularnewline
17 & -0.013587 & -0.1457 & 0.442205 \tabularnewline
18 & -0.047284 & -0.5071 & 0.306541 \tabularnewline
19 & -0.015403 & -0.1652 & 0.434548 \tabularnewline
20 & -0.127644 & -1.3688 & 0.086859 \tabularnewline
21 & 0.039973 & 0.4287 & 0.334485 \tabularnewline
22 & -0.072549 & -0.778 & 0.219084 \tabularnewline
23 & -0.120963 & -1.2972 & 0.098581 \tabularnewline
24 & 0.017207 & 0.1845 & 0.426964 \tabularnewline
25 & -0.183229 & -1.9649 & 0.025918 \tabularnewline
26 & 0.047451 & 0.5089 & 0.305916 \tabularnewline
27 & -0.09676 & -1.0376 & 0.150808 \tabularnewline
28 & -0.025609 & -0.2746 & 0.392049 \tabularnewline
29 & -0.014548 & -0.156 & 0.438151 \tabularnewline
30 & -0.04073 & -0.4368 & 0.331544 \tabularnewline
31 & -0.15049 & -1.6138 & 0.054653 \tabularnewline
32 & -0.14982 & -1.6066 & 0.055438 \tabularnewline
33 & -0.090611 & -0.9717 & 0.16662 \tabularnewline
34 & 0.087079 & 0.9338 & 0.176176 \tabularnewline
35 & 0.100236 & 1.0749 & 0.142332 \tabularnewline
36 & -0.053542 & -0.5742 & 0.283485 \tabularnewline
37 & 0.132969 & 1.4259 & 0.078298 \tabularnewline
38 & -0.024855 & -0.2665 & 0.395152 \tabularnewline
39 & -0.038408 & -0.4119 & 0.340599 \tabularnewline
40 & -0.027145 & -0.2911 & 0.385749 \tabularnewline
41 & -0.037162 & -0.3985 & 0.345492 \tabularnewline
42 & -0.012018 & -0.1289 & 0.44884 \tabularnewline
43 & 0.045961 & 0.4929 & 0.31152 \tabularnewline
44 & -0.052068 & -0.5584 & 0.288841 \tabularnewline
45 & 0.109137 & 1.1704 & 0.122136 \tabularnewline
46 & 0.005007 & 0.0537 & 0.478635 \tabularnewline
47 & -0.001233 & -0.0132 & 0.494738 \tabularnewline
48 & -0.079537 & -0.8529 & 0.197733 \tabularnewline
\hline
\end{tabular}
%Source: https://freestatistics.org/blog/index.php?pk=301000&T=2

[TABLE]
[ROW][C]Partial Autocorrelation Function[/C][/ROW]
[ROW][C]Time lag k[/C][C]PACF(k)[/C][C]T-STAT[/C][C]P-value[/C][/ROW]
[ROW][C]1[/C][C]0.029169[/C][C]0.3128[/C][C]0.377497[/C][/ROW]
[ROW][C]2[/C][C]0.14715[/C][C]1.578[/C][C]0.058656[/C][/ROW]
[ROW][C]3[/C][C]0.08344[/C][C]0.8948[/C][C]0.186382[/C][/ROW]
[ROW][C]4[/C][C]0.178718[/C][C]1.9165[/C][C]0.028889[/C][/ROW]
[ROW][C]5[/C][C]-0.131548[/C][C]-1.4107[/C][C]0.080517[/C][/ROW]
[ROW][C]6[/C][C]0.282314[/C][C]3.0275[/C][C]0.001522[/C][/ROW]
[ROW][C]7[/C][C]0.08873[/C][C]0.9515[/C][C]0.171668[/C][/ROW]
[ROW][C]8[/C][C]-0.108839[/C][C]-1.1672[/C][C]0.122778[/C][/ROW]
[ROW][C]9[/C][C]0.072156[/C][C]0.7738[/C][C]0.220322[/C][/ROW]
[ROW][C]10[/C][C]-0.098193[/C][C]-1.053[/C][C]0.147273[/C][/ROW]
[ROW][C]11[/C][C]0.105192[/C][C]1.1281[/C][C]0.130823[/C][/ROW]
[ROW][C]12[/C][C]0.021913[/C][C]0.235[/C][C]0.407318[/C][/ROW]
[ROW][C]13[/C][C]-0.095642[/C][C]-1.0256[/C][C]0.153605[/C][/ROW]
[ROW][C]14[/C][C]-0.076798[/C][C]-0.8236[/C][C]0.205946[/C][/ROW]
[ROW][C]15[/C][C]-0.016136[/C][C]-0.173[/C][C]0.431461[/C][/ROW]
[ROW][C]16[/C][C]-0.0277[/C][C]-0.297[/C][C]0.383484[/C][/ROW]
[ROW][C]17[/C][C]-0.013587[/C][C]-0.1457[/C][C]0.442205[/C][/ROW]
[ROW][C]18[/C][C]-0.047284[/C][C]-0.5071[/C][C]0.306541[/C][/ROW]
[ROW][C]19[/C][C]-0.015403[/C][C]-0.1652[/C][C]0.434548[/C][/ROW]
[ROW][C]20[/C][C]-0.127644[/C][C]-1.3688[/C][C]0.086859[/C][/ROW]
[ROW][C]21[/C][C]0.039973[/C][C]0.4287[/C][C]0.334485[/C][/ROW]
[ROW][C]22[/C][C]-0.072549[/C][C]-0.778[/C][C]0.219084[/C][/ROW]
[ROW][C]23[/C][C]-0.120963[/C][C]-1.2972[/C][C]0.098581[/C][/ROW]
[ROW][C]24[/C][C]0.017207[/C][C]0.1845[/C][C]0.426964[/C][/ROW]
[ROW][C]25[/C][C]-0.183229[/C][C]-1.9649[/C][C]0.025918[/C][/ROW]
[ROW][C]26[/C][C]0.047451[/C][C]0.5089[/C][C]0.305916[/C][/ROW]
[ROW][C]27[/C][C]-0.09676[/C][C]-1.0376[/C][C]0.150808[/C][/ROW]
[ROW][C]28[/C][C]-0.025609[/C][C]-0.2746[/C][C]0.392049[/C][/ROW]
[ROW][C]29[/C][C]-0.014548[/C][C]-0.156[/C][C]0.438151[/C][/ROW]
[ROW][C]30[/C][C]-0.04073[/C][C]-0.4368[/C][C]0.331544[/C][/ROW]
[ROW][C]31[/C][C]-0.15049[/C][C]-1.6138[/C][C]0.054653[/C][/ROW]
[ROW][C]32[/C][C]-0.14982[/C][C]-1.6066[/C][C]0.055438[/C][/ROW]
[ROW][C]33[/C][C]-0.090611[/C][C]-0.9717[/C][C]0.16662[/C][/ROW]
[ROW][C]34[/C][C]0.087079[/C][C]0.9338[/C][C]0.176176[/C][/ROW]
[ROW][C]35[/C][C]0.100236[/C][C]1.0749[/C][C]0.142332[/C][/ROW]
[ROW][C]36[/C][C]-0.053542[/C][C]-0.5742[/C][C]0.283485[/C][/ROW]
[ROW][C]37[/C][C]0.132969[/C][C]1.4259[/C][C]0.078298[/C][/ROW]
[ROW][C]38[/C][C]-0.024855[/C][C]-0.2665[/C][C]0.395152[/C][/ROW]
[ROW][C]39[/C][C]-0.038408[/C][C]-0.4119[/C][C]0.340599[/C][/ROW]
[ROW][C]40[/C][C]-0.027145[/C][C]-0.2911[/C][C]0.385749[/C][/ROW]
[ROW][C]41[/C][C]-0.037162[/C][C]-0.3985[/C][C]0.345492[/C][/ROW]
[ROW][C]42[/C][C]-0.012018[/C][C]-0.1289[/C][C]0.44884[/C][/ROW]
[ROW][C]43[/C][C]0.045961[/C][C]0.4929[/C][C]0.31152[/C][/ROW]
[ROW][C]44[/C][C]-0.052068[/C][C]-0.5584[/C][C]0.288841[/C][/ROW]
[ROW][C]45[/C][C]0.109137[/C][C]1.1704[/C][C]0.122136[/C][/ROW]
[ROW][C]46[/C][C]0.005007[/C][C]0.0537[/C][C]0.478635[/C][/ROW]
[ROW][C]47[/C][C]-0.001233[/C][C]-0.0132[/C][C]0.494738[/C][/ROW]
[ROW][C]48[/C][C]-0.079537[/C][C]-0.8529[/C][C]0.197733[/C][/ROW]
[/TABLE]
Source: https://freestatistics.org/blog/index.php?pk=301000&T=2

Globally Unique Identifier (entire table): ba.freestatistics.org/blog/index.php?pk=301000&T=2

As an alternative you can also use a QR Code:  

The GUIDs for individual cells are displayed in the table below:

Partial Autocorrelation Function
Time lag kPACF(k)T-STATP-value
10.0291690.31280.377497
20.147151.5780.058656
30.083440.89480.186382
40.1787181.91650.028889
5-0.131548-1.41070.080517
60.2823143.02750.001522
70.088730.95150.171668
8-0.108839-1.16720.122778
90.0721560.77380.220322
10-0.098193-1.0530.147273
110.1051921.12810.130823
120.0219130.2350.407318
13-0.095642-1.02560.153605
14-0.076798-0.82360.205946
15-0.016136-0.1730.431461
16-0.0277-0.2970.383484
17-0.013587-0.14570.442205
18-0.047284-0.50710.306541
19-0.015403-0.16520.434548
20-0.127644-1.36880.086859
210.0399730.42870.334485
22-0.072549-0.7780.219084
23-0.120963-1.29720.098581
240.0172070.18450.426964
25-0.183229-1.96490.025918
260.0474510.50890.305916
27-0.09676-1.03760.150808
28-0.025609-0.27460.392049
29-0.014548-0.1560.438151
30-0.04073-0.43680.331544
31-0.15049-1.61380.054653
32-0.14982-1.60660.055438
33-0.090611-0.97170.16662
340.0870790.93380.176176
350.1002361.07490.142332
36-0.053542-0.57420.283485
370.1329691.42590.078298
38-0.024855-0.26650.395152
39-0.038408-0.41190.340599
40-0.027145-0.29110.385749
41-0.037162-0.39850.345492
42-0.012018-0.12890.44884
430.0459610.49290.31152
44-0.052068-0.55840.288841
450.1091371.17040.122136
460.0050070.05370.478635
47-0.001233-0.01320.494738
48-0.079537-0.85290.197733


Parameters (Session):
par1 = n1862 ; par4 = 12 ;
Parameters (R input):
par1 = 48 ; par2 = 1 ; par3 = 1 ; par4 = 0 ; par5 = 12 ; par6 = White Noise ; par7 = 0.95 ; par8 = ;
R code (references can be found in the software module):
par8 <- ''
par7 <- '0.95'
par6 <- 'White Noise'
par5 <- '12'
par4 <- '0'
par3 <- '0'
par2 <- '1'
par1 <- 'Default'
if (par1 == 'Default') {
par1 = 10*log10(length(x))
} else {
par1 <- as.numeric(par1)
}
par2 <- as.numeric(par2)
par3 <- as.numeric(par3)
par4 <- as.numeric(par4)
par5 <- as.numeric(par5)
if (par6 == 'White Noise') par6 <- 'white' else par6 <- 'ma'
par7 <- as.numeric(par7)
if (par8 != '') par8 <- as.numeric(par8)
x <- na.omit(x)
ox <- x
if (par8 == '') {
if (par2 == 0) {
x <- log(x)
} else {
x <- (x ^ par2 - 1) / par2
}
} else {
x <- log(x,base=par8)
}
if (par3 > 0) x <- diff(x,lag=1,difference=par3)
if (par4 > 0) x <- diff(x,lag=par5,difference=par4)
bitmap(file='picts.png')
op <- par(mfrow=c(2,1))
plot(ox,type='l',main='Original Time Series',xlab='time',ylab='value')
if (par8=='') {
mytitle <- paste('Working Time Series (lambda=',par2,', d=',par3,', D=',par4,')',sep='')
mysub <- paste('(lambda=',par2,', d=',par3,', D=',par4,', CI=', par7, ', CI type=',par6,')',sep='')
} else {
mytitle <- paste('Working Time Series (base=',par8,', d=',par3,', D=',par4,')',sep='')
mysub <- paste('(base=',par8,', d=',par3,', D=',par4,', CI=', par7, ', CI type=',par6,')',sep='')
}
plot(x,type='l', main=mytitle,xlab='time',ylab='value')
par(op)
dev.off()
bitmap(file='pic1.png')
racf <- acf(x, par1, main='Autocorrelation', xlab='time lag', ylab='ACF', ci.type=par6, ci=par7, sub=mysub)
dev.off()
bitmap(file='pic2.png')
rpacf <- pacf(x,par1,main='Partial Autocorrelation',xlab='lags',ylab='PACF',sub=mysub)
dev.off()
(myacf <- c(racf$acf))
(mypacf <- c(rpacf$acf))
lengthx <- length(x)
sqrtn <- sqrt(lengthx)
load(file='createtable')
a<-table.start()
a<-table.row.start(a)
a<-table.element(a,'Autocorrelation Function',4,TRUE)
a<-table.row.end(a)
a<-table.row.start(a)
a<-table.element(a,'Time lag k',header=TRUE)
a<-table.element(a,'ACF(k)',header=TRUE)
a<-table.element(a,'T-STAT',header=TRUE)
a<-table.element(a,'P-value',header=TRUE)
a<-table.row.end(a)
for (i in 2:(par1+1)) {
a<-table.row.start(a)
a<-table.element(a,i-1,header=TRUE)
a<-table.element(a,round(myacf[i],6))
mytstat <- myacf[i]*sqrtn
a<-table.element(a,round(mytstat,4))
a<-table.element(a,round(1-pt(abs(mytstat),lengthx),6))
a<-table.row.end(a)
}
a<-table.end(a)
table.save(a,file='mytable.tab')
a<-table.start()
a<-table.row.start(a)
a<-table.element(a,'Partial Autocorrelation Function',4,TRUE)
a<-table.row.end(a)
a<-table.row.start(a)
a<-table.element(a,'Time lag k',header=TRUE)
a<-table.element(a,'PACF(k)',header=TRUE)
a<-table.element(a,'T-STAT',header=TRUE)
a<-table.element(a,'P-value',header=TRUE)
a<-table.row.end(a)
for (i in 1:par1) {
a<-table.row.start(a)
a<-table.element(a,i,header=TRUE)
a<-table.element(a,round(mypacf[i],6))
mytstat <- mypacf[i]*sqrtn
a<-table.element(a,round(mytstat,4))
a<-table.element(a,round(1-pt(abs(mytstat),lengthx),6))
a<-table.row.end(a)
}
a<-table.end(a)
table.save(a,file='mytable1.tab')