Free Statistics

of Irreproducible Research!

Author's title

Author*The author of this computation has been verified*
R Software Modulerwasp_exponentialsmoothing.wasp
Title produced by softwareExponential Smoothing
Date of computationSun, 18 Dec 2016 13:33:21 +0100
Cite this page as followsStatistical Computations at FreeStatistics.org, Office for Research Development and Education, URL https://freestatistics.org/blog/index.php?v=date/2016/Dec/18/t14820644187mp9x45v0inmshg.htm/, Retrieved Wed, 08 May 2024 22:37:59 +0000
Statistical Computations at FreeStatistics.org, Office for Research Development and Education, URL https://freestatistics.org/blog/index.php?pk=301030, Retrieved Wed, 08 May 2024 22:37:59 +0000
QR Codes:

Original text written by user:
IsPrivate?No (this computation is public)
User-defined keywords
Estimated Impact99
Family? (F = Feedback message, R = changed R code, M = changed R Module, P = changed Parameters, D = changed Data)
-     [Exponential Smoothing] [] [2016-12-18 12:31:12] [683f400e1b95307fc738e729f07c4fce]
- R       [Exponential Smoothing] [] [2016-12-18 12:33:21] [404ac5ee4f7301873f6a96ef36861981] [Current]
Feedback Forum

Post a new message
Dataseries X:
9290
6160
8320
8310
6750
8710
6300
5710
5740
6710
7310
7240
8650
8330
7810
8260
6680
5580
6340
4490
5000
7030
6100
9740
7940
7740
7820
7820
5380
7070
6970
4080
4930
4820
6220
6360
7630
5130
6960
5350
6290
4630
5130
3620
3980
3120
4310
4250
5730
3630
5680


Summary of computational transaction
Raw Input view raw input (R code)
Raw Outputview raw output of R engine
Computing time1 seconds
R ServerBig Analytics Cloud Computing Center

\begin{tabular}{lllllllll}
\hline
Summary of computational transaction \tabularnewline
Raw Input view raw input (R code)  \tabularnewline
Raw Outputview raw output of R engine  \tabularnewline
Computing time1 seconds \tabularnewline
R ServerBig Analytics Cloud Computing Center \tabularnewline
\hline
\end{tabular}
%Source: https://freestatistics.org/blog/index.php?pk=301030&T=0

[TABLE]
[ROW]
Summary of computational transaction[/C][/ROW] [ROW]Raw Input[/C] view raw input (R code) [/C][/ROW] [ROW]Raw Output[/C]view raw output of R engine [/C][/ROW] [ROW]Computing time[/C]1 seconds[/C][/ROW] [ROW]R Server[/C]Big Analytics Cloud Computing Center[/C][/ROW] [/TABLE] Source: https://freestatistics.org/blog/index.php?pk=301030&T=0

Globally Unique Identifier (entire table): ba.freestatistics.org/blog/index.php?pk=301030&T=0

As an alternative you can also use a QR Code:  

The GUIDs for individual cells are displayed in the table below:

Summary of computational transaction
Raw Input view raw input (R code)
Raw Outputview raw output of R engine
Computing time1 seconds
R ServerBig Analytics Cloud Computing Center


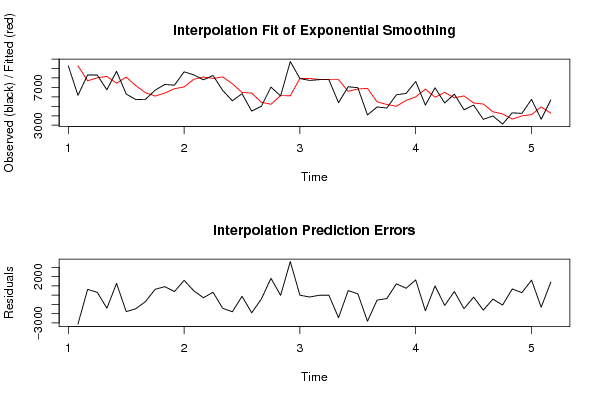
Estimated Parameters of Exponential Smoothing
ParameterValue
alpha0.506936910736287
betaFALSE
gammaFALSE

\begin{tabular}{lllllllll}
\hline
Estimated Parameters of Exponential Smoothing \tabularnewline
Parameter & Value \tabularnewline
alpha & 0.506936910736287 \tabularnewline
beta & FALSE \tabularnewline
gamma & FALSE \tabularnewline
\hline
\end{tabular}
%Source: https://freestatistics.org/blog/index.php?pk=301030&T=1

[TABLE]
[ROW][C]Estimated Parameters of Exponential Smoothing[/C][/ROW]
[ROW][C]Parameter[/C][C]Value[/C][/ROW]
[ROW][C]alpha[/C][C]0.506936910736287[/C][/ROW]
[ROW][C]beta[/C][C]FALSE[/C][/ROW]
[ROW][C]gamma[/C][C]FALSE[/C][/ROW]
[/TABLE]
Source: https://freestatistics.org/blog/index.php?pk=301030&T=1

Globally Unique Identifier (entire table): ba.freestatistics.org/blog/index.php?pk=301030&T=1

As an alternative you can also use a QR Code:  

The GUIDs for individual cells are displayed in the table below:

Estimated Parameters of Exponential Smoothing
ParameterValue
alpha0.506936910736287
betaFALSE
gammaFALSE


Interpolation Forecasts of Exponential Smoothing
tObservedFittedResiduals
261609290-3130
383207703.28746939542616.712530604578
483108015.92181447246294.078185527535
567508165.00090135873-1415.00090135873
687107447.684715734871262.31528426513
763008087.59892631543-1787.59892631543
857107181.39904897358-1471.39904897358
957406435.4925606266-695.492560626604
1067106082.92171050248627.078289497516
1173106400.81084137015909.18915862985
1272406861.71238472089378.28761527911
1386507053.480339780281596.51966021972
1483307862.81508426181467.184915738188
1578108099.64836218872-289.648362188722
1682607952.81491626095307.185083739054
1766808108.53837363589-1428.53837363589
1855807384.35954363667-1804.35954363667
1963406469.66309072796-129.66309072796
2044906403.93208407781-1913.93208407781
2150005433.68926601634-433.689266016341
2270305213.836169282531816.16383071747
2361006134.51665101742-34.5166510174249
2497406117.018886581693622.98111341831
2579407953.64173987388-13.6417398738822
2677407946.72623840515-206.726238405148
2778207841.92907773991-21.9290777399092
2878207830.81241881514-10.8124188151432
2953807825.33120462341-2445.33120462341
3070706585.70255802457484.297441975426
3169706831.21080713708138.789192862918
3240806901.56817181059-2821.56817181059
3349305471.2111193611-541.211119361096
3448205196.85122645605-376.851226456054
3562205005.811429909241214.18857009076
3663605621.32843268236738.67156731764
3776305995.78831506711634.2116849329
3851306824.23053811612-1694.23053811612
3969605965.36254304846994.637456951541
4053506469.58098277807-1119.58098277807
4162905902.02405804946387.975941950541
4246306098.70338350187-1468.70338350187
4351305354.1634274815-224.163427481499
4436205240.52671205397-1620.52671205397
4539804419.0219068797-439.021906879698
4631204196.46549766055-1076.46549766055
4743103650.76540376231659.234596237689
4842503984.95575342953265.044246570471
4957304119.316464994391610.68353500561
5036304935.83140040394-1305.83140040394
5156804273.857264340731406.14273565927

\begin{tabular}{lllllllll}
\hline
Interpolation Forecasts of Exponential Smoothing \tabularnewline
t & Observed & Fitted & Residuals \tabularnewline
2 & 6160 & 9290 & -3130 \tabularnewline
3 & 8320 & 7703.28746939542 & 616.712530604578 \tabularnewline
4 & 8310 & 8015.92181447246 & 294.078185527535 \tabularnewline
5 & 6750 & 8165.00090135873 & -1415.00090135873 \tabularnewline
6 & 8710 & 7447.68471573487 & 1262.31528426513 \tabularnewline
7 & 6300 & 8087.59892631543 & -1787.59892631543 \tabularnewline
8 & 5710 & 7181.39904897358 & -1471.39904897358 \tabularnewline
9 & 5740 & 6435.4925606266 & -695.492560626604 \tabularnewline
10 & 6710 & 6082.92171050248 & 627.078289497516 \tabularnewline
11 & 7310 & 6400.81084137015 & 909.18915862985 \tabularnewline
12 & 7240 & 6861.71238472089 & 378.28761527911 \tabularnewline
13 & 8650 & 7053.48033978028 & 1596.51966021972 \tabularnewline
14 & 8330 & 7862.81508426181 & 467.184915738188 \tabularnewline
15 & 7810 & 8099.64836218872 & -289.648362188722 \tabularnewline
16 & 8260 & 7952.81491626095 & 307.185083739054 \tabularnewline
17 & 6680 & 8108.53837363589 & -1428.53837363589 \tabularnewline
18 & 5580 & 7384.35954363667 & -1804.35954363667 \tabularnewline
19 & 6340 & 6469.66309072796 & -129.66309072796 \tabularnewline
20 & 4490 & 6403.93208407781 & -1913.93208407781 \tabularnewline
21 & 5000 & 5433.68926601634 & -433.689266016341 \tabularnewline
22 & 7030 & 5213.83616928253 & 1816.16383071747 \tabularnewline
23 & 6100 & 6134.51665101742 & -34.5166510174249 \tabularnewline
24 & 9740 & 6117.01888658169 & 3622.98111341831 \tabularnewline
25 & 7940 & 7953.64173987388 & -13.6417398738822 \tabularnewline
26 & 7740 & 7946.72623840515 & -206.726238405148 \tabularnewline
27 & 7820 & 7841.92907773991 & -21.9290777399092 \tabularnewline
28 & 7820 & 7830.81241881514 & -10.8124188151432 \tabularnewline
29 & 5380 & 7825.33120462341 & -2445.33120462341 \tabularnewline
30 & 7070 & 6585.70255802457 & 484.297441975426 \tabularnewline
31 & 6970 & 6831.21080713708 & 138.789192862918 \tabularnewline
32 & 4080 & 6901.56817181059 & -2821.56817181059 \tabularnewline
33 & 4930 & 5471.2111193611 & -541.211119361096 \tabularnewline
34 & 4820 & 5196.85122645605 & -376.851226456054 \tabularnewline
35 & 6220 & 5005.81142990924 & 1214.18857009076 \tabularnewline
36 & 6360 & 5621.32843268236 & 738.67156731764 \tabularnewline
37 & 7630 & 5995.7883150671 & 1634.2116849329 \tabularnewline
38 & 5130 & 6824.23053811612 & -1694.23053811612 \tabularnewline
39 & 6960 & 5965.36254304846 & 994.637456951541 \tabularnewline
40 & 5350 & 6469.58098277807 & -1119.58098277807 \tabularnewline
41 & 6290 & 5902.02405804946 & 387.975941950541 \tabularnewline
42 & 4630 & 6098.70338350187 & -1468.70338350187 \tabularnewline
43 & 5130 & 5354.1634274815 & -224.163427481499 \tabularnewline
44 & 3620 & 5240.52671205397 & -1620.52671205397 \tabularnewline
45 & 3980 & 4419.0219068797 & -439.021906879698 \tabularnewline
46 & 3120 & 4196.46549766055 & -1076.46549766055 \tabularnewline
47 & 4310 & 3650.76540376231 & 659.234596237689 \tabularnewline
48 & 4250 & 3984.95575342953 & 265.044246570471 \tabularnewline
49 & 5730 & 4119.31646499439 & 1610.68353500561 \tabularnewline
50 & 3630 & 4935.83140040394 & -1305.83140040394 \tabularnewline
51 & 5680 & 4273.85726434073 & 1406.14273565927 \tabularnewline
\hline
\end{tabular}
%Source: https://freestatistics.org/blog/index.php?pk=301030&T=2

[TABLE]
[ROW][C]Interpolation Forecasts of Exponential Smoothing[/C][/ROW]
[ROW][C]t[/C][C]Observed[/C][C]Fitted[/C][C]Residuals[/C][/ROW]
[ROW][C]2[/C][C]6160[/C][C]9290[/C][C]-3130[/C][/ROW]
[ROW][C]3[/C][C]8320[/C][C]7703.28746939542[/C][C]616.712530604578[/C][/ROW]
[ROW][C]4[/C][C]8310[/C][C]8015.92181447246[/C][C]294.078185527535[/C][/ROW]
[ROW][C]5[/C][C]6750[/C][C]8165.00090135873[/C][C]-1415.00090135873[/C][/ROW]
[ROW][C]6[/C][C]8710[/C][C]7447.68471573487[/C][C]1262.31528426513[/C][/ROW]
[ROW][C]7[/C][C]6300[/C][C]8087.59892631543[/C][C]-1787.59892631543[/C][/ROW]
[ROW][C]8[/C][C]5710[/C][C]7181.39904897358[/C][C]-1471.39904897358[/C][/ROW]
[ROW][C]9[/C][C]5740[/C][C]6435.4925606266[/C][C]-695.492560626604[/C][/ROW]
[ROW][C]10[/C][C]6710[/C][C]6082.92171050248[/C][C]627.078289497516[/C][/ROW]
[ROW][C]11[/C][C]7310[/C][C]6400.81084137015[/C][C]909.18915862985[/C][/ROW]
[ROW][C]12[/C][C]7240[/C][C]6861.71238472089[/C][C]378.28761527911[/C][/ROW]
[ROW][C]13[/C][C]8650[/C][C]7053.48033978028[/C][C]1596.51966021972[/C][/ROW]
[ROW][C]14[/C][C]8330[/C][C]7862.81508426181[/C][C]467.184915738188[/C][/ROW]
[ROW][C]15[/C][C]7810[/C][C]8099.64836218872[/C][C]-289.648362188722[/C][/ROW]
[ROW][C]16[/C][C]8260[/C][C]7952.81491626095[/C][C]307.185083739054[/C][/ROW]
[ROW][C]17[/C][C]6680[/C][C]8108.53837363589[/C][C]-1428.53837363589[/C][/ROW]
[ROW][C]18[/C][C]5580[/C][C]7384.35954363667[/C][C]-1804.35954363667[/C][/ROW]
[ROW][C]19[/C][C]6340[/C][C]6469.66309072796[/C][C]-129.66309072796[/C][/ROW]
[ROW][C]20[/C][C]4490[/C][C]6403.93208407781[/C][C]-1913.93208407781[/C][/ROW]
[ROW][C]21[/C][C]5000[/C][C]5433.68926601634[/C][C]-433.689266016341[/C][/ROW]
[ROW][C]22[/C][C]7030[/C][C]5213.83616928253[/C][C]1816.16383071747[/C][/ROW]
[ROW][C]23[/C][C]6100[/C][C]6134.51665101742[/C][C]-34.5166510174249[/C][/ROW]
[ROW][C]24[/C][C]9740[/C][C]6117.01888658169[/C][C]3622.98111341831[/C][/ROW]
[ROW][C]25[/C][C]7940[/C][C]7953.64173987388[/C][C]-13.6417398738822[/C][/ROW]
[ROW][C]26[/C][C]7740[/C][C]7946.72623840515[/C][C]-206.726238405148[/C][/ROW]
[ROW][C]27[/C][C]7820[/C][C]7841.92907773991[/C][C]-21.9290777399092[/C][/ROW]
[ROW][C]28[/C][C]7820[/C][C]7830.81241881514[/C][C]-10.8124188151432[/C][/ROW]
[ROW][C]29[/C][C]5380[/C][C]7825.33120462341[/C][C]-2445.33120462341[/C][/ROW]
[ROW][C]30[/C][C]7070[/C][C]6585.70255802457[/C][C]484.297441975426[/C][/ROW]
[ROW][C]31[/C][C]6970[/C][C]6831.21080713708[/C][C]138.789192862918[/C][/ROW]
[ROW][C]32[/C][C]4080[/C][C]6901.56817181059[/C][C]-2821.56817181059[/C][/ROW]
[ROW][C]33[/C][C]4930[/C][C]5471.2111193611[/C][C]-541.211119361096[/C][/ROW]
[ROW][C]34[/C][C]4820[/C][C]5196.85122645605[/C][C]-376.851226456054[/C][/ROW]
[ROW][C]35[/C][C]6220[/C][C]5005.81142990924[/C][C]1214.18857009076[/C][/ROW]
[ROW][C]36[/C][C]6360[/C][C]5621.32843268236[/C][C]738.67156731764[/C][/ROW]
[ROW][C]37[/C][C]7630[/C][C]5995.7883150671[/C][C]1634.2116849329[/C][/ROW]
[ROW][C]38[/C][C]5130[/C][C]6824.23053811612[/C][C]-1694.23053811612[/C][/ROW]
[ROW][C]39[/C][C]6960[/C][C]5965.36254304846[/C][C]994.637456951541[/C][/ROW]
[ROW][C]40[/C][C]5350[/C][C]6469.58098277807[/C][C]-1119.58098277807[/C][/ROW]
[ROW][C]41[/C][C]6290[/C][C]5902.02405804946[/C][C]387.975941950541[/C][/ROW]
[ROW][C]42[/C][C]4630[/C][C]6098.70338350187[/C][C]-1468.70338350187[/C][/ROW]
[ROW][C]43[/C][C]5130[/C][C]5354.1634274815[/C][C]-224.163427481499[/C][/ROW]
[ROW][C]44[/C][C]3620[/C][C]5240.52671205397[/C][C]-1620.52671205397[/C][/ROW]
[ROW][C]45[/C][C]3980[/C][C]4419.0219068797[/C][C]-439.021906879698[/C][/ROW]
[ROW][C]46[/C][C]3120[/C][C]4196.46549766055[/C][C]-1076.46549766055[/C][/ROW]
[ROW][C]47[/C][C]4310[/C][C]3650.76540376231[/C][C]659.234596237689[/C][/ROW]
[ROW][C]48[/C][C]4250[/C][C]3984.95575342953[/C][C]265.044246570471[/C][/ROW]
[ROW][C]49[/C][C]5730[/C][C]4119.31646499439[/C][C]1610.68353500561[/C][/ROW]
[ROW][C]50[/C][C]3630[/C][C]4935.83140040394[/C][C]-1305.83140040394[/C][/ROW]
[ROW][C]51[/C][C]5680[/C][C]4273.85726434073[/C][C]1406.14273565927[/C][/ROW]
[/TABLE]
Source: https://freestatistics.org/blog/index.php?pk=301030&T=2

Globally Unique Identifier (entire table): ba.freestatistics.org/blog/index.php?pk=301030&T=2

As an alternative you can also use a QR Code:  

The GUIDs for individual cells are displayed in the table below:

Interpolation Forecasts of Exponential Smoothing
tObservedFittedResiduals
261609290-3130
383207703.28746939542616.712530604578
483108015.92181447246294.078185527535
567508165.00090135873-1415.00090135873
687107447.684715734871262.31528426513
763008087.59892631543-1787.59892631543
857107181.39904897358-1471.39904897358
957406435.4925606266-695.492560626604
1067106082.92171050248627.078289497516
1173106400.81084137015909.18915862985
1272406861.71238472089378.28761527911
1386507053.480339780281596.51966021972
1483307862.81508426181467.184915738188
1578108099.64836218872-289.648362188722
1682607952.81491626095307.185083739054
1766808108.53837363589-1428.53837363589
1855807384.35954363667-1804.35954363667
1963406469.66309072796-129.66309072796
2044906403.93208407781-1913.93208407781
2150005433.68926601634-433.689266016341
2270305213.836169282531816.16383071747
2361006134.51665101742-34.5166510174249
2497406117.018886581693622.98111341831
2579407953.64173987388-13.6417398738822
2677407946.72623840515-206.726238405148
2778207841.92907773991-21.9290777399092
2878207830.81241881514-10.8124188151432
2953807825.33120462341-2445.33120462341
3070706585.70255802457484.297441975426
3169706831.21080713708138.789192862918
3240806901.56817181059-2821.56817181059
3349305471.2111193611-541.211119361096
3448205196.85122645605-376.851226456054
3562205005.811429909241214.18857009076
3663605621.32843268236738.67156731764
3776305995.78831506711634.2116849329
3851306824.23053811612-1694.23053811612
3969605965.36254304846994.637456951541
4053506469.58098277807-1119.58098277807
4162905902.02405804946387.975941950541
4246306098.70338350187-1468.70338350187
4351305354.1634274815-224.163427481499
4436205240.52671205397-1620.52671205397
4539804419.0219068797-439.021906879698
4631204196.46549766055-1076.46549766055
4743103650.76540376231659.234596237689
4842503984.95575342953265.044246570471
4957304119.316464994391610.68353500561
5036304935.83140040394-1305.83140040394
5156804273.857264340731406.14273565927


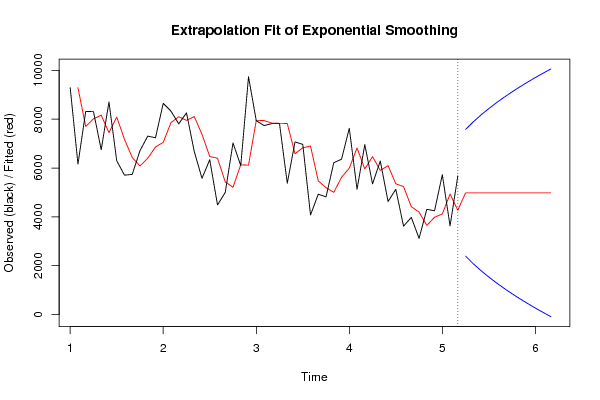
Extrapolation Forecasts of Exponential Smoothing
tForecast95% Lower Bound95% Upper Bound
524986.682918810112393.821957509027579.5438801112
534986.682918810112079.687937875097893.67789974513
544986.682918810111796.336280320258177.02955729997
554986.682918810111536.175198449858437.19063917037
564986.682918810111294.299490344448679.06634727578
574986.682918810111067.322353953898906.04348366633
584986.68291881011852.7889806578179120.5768569624
594986.68291881011648.8527070066969324.51313061352
604986.68291881011454.0829142898989519.28292333032
614986.68291881011267.3445482841329706.02128933609
624986.6829188101187.71909877010339885.64673885012
634986.68291881011-85.549170182185710058.9150078024

\begin{tabular}{lllllllll}
\hline
Extrapolation Forecasts of Exponential Smoothing \tabularnewline
t & Forecast & 95% Lower Bound & 95% Upper Bound \tabularnewline
52 & 4986.68291881011 & 2393.82195750902 & 7579.5438801112 \tabularnewline
53 & 4986.68291881011 & 2079.68793787509 & 7893.67789974513 \tabularnewline
54 & 4986.68291881011 & 1796.33628032025 & 8177.02955729997 \tabularnewline
55 & 4986.68291881011 & 1536.17519844985 & 8437.19063917037 \tabularnewline
56 & 4986.68291881011 & 1294.29949034444 & 8679.06634727578 \tabularnewline
57 & 4986.68291881011 & 1067.32235395389 & 8906.04348366633 \tabularnewline
58 & 4986.68291881011 & 852.788980657817 & 9120.5768569624 \tabularnewline
59 & 4986.68291881011 & 648.852707006696 & 9324.51313061352 \tabularnewline
60 & 4986.68291881011 & 454.082914289898 & 9519.28292333032 \tabularnewline
61 & 4986.68291881011 & 267.344548284132 & 9706.02128933609 \tabularnewline
62 & 4986.68291881011 & 87.7190987701033 & 9885.64673885012 \tabularnewline
63 & 4986.68291881011 & -85.5491701821857 & 10058.9150078024 \tabularnewline
\hline
\end{tabular}
%Source: https://freestatistics.org/blog/index.php?pk=301030&T=3

[TABLE]
[ROW][C]Extrapolation Forecasts of Exponential Smoothing[/C][/ROW]
[ROW][C]t[/C][C]Forecast[/C][C]95% Lower Bound[/C][C]95% Upper Bound[/C][/ROW]
[ROW][C]52[/C][C]4986.68291881011[/C][C]2393.82195750902[/C][C]7579.5438801112[/C][/ROW]
[ROW][C]53[/C][C]4986.68291881011[/C][C]2079.68793787509[/C][C]7893.67789974513[/C][/ROW]
[ROW][C]54[/C][C]4986.68291881011[/C][C]1796.33628032025[/C][C]8177.02955729997[/C][/ROW]
[ROW][C]55[/C][C]4986.68291881011[/C][C]1536.17519844985[/C][C]8437.19063917037[/C][/ROW]
[ROW][C]56[/C][C]4986.68291881011[/C][C]1294.29949034444[/C][C]8679.06634727578[/C][/ROW]
[ROW][C]57[/C][C]4986.68291881011[/C][C]1067.32235395389[/C][C]8906.04348366633[/C][/ROW]
[ROW][C]58[/C][C]4986.68291881011[/C][C]852.788980657817[/C][C]9120.5768569624[/C][/ROW]
[ROW][C]59[/C][C]4986.68291881011[/C][C]648.852707006696[/C][C]9324.51313061352[/C][/ROW]
[ROW][C]60[/C][C]4986.68291881011[/C][C]454.082914289898[/C][C]9519.28292333032[/C][/ROW]
[ROW][C]61[/C][C]4986.68291881011[/C][C]267.344548284132[/C][C]9706.02128933609[/C][/ROW]
[ROW][C]62[/C][C]4986.68291881011[/C][C]87.7190987701033[/C][C]9885.64673885012[/C][/ROW]
[ROW][C]63[/C][C]4986.68291881011[/C][C]-85.5491701821857[/C][C]10058.9150078024[/C][/ROW]
[/TABLE]
Source: https://freestatistics.org/blog/index.php?pk=301030&T=3

Globally Unique Identifier (entire table): ba.freestatistics.org/blog/index.php?pk=301030&T=3

As an alternative you can also use a QR Code:  

The GUIDs for individual cells are displayed in the table below:

Extrapolation Forecasts of Exponential Smoothing
tForecast95% Lower Bound95% Upper Bound
524986.682918810112393.821957509027579.5438801112
534986.682918810112079.687937875097893.67789974513
544986.682918810111796.336280320258177.02955729997
554986.682918810111536.175198449858437.19063917037
564986.682918810111294.299490344448679.06634727578
574986.682918810111067.322353953898906.04348366633
584986.68291881011852.7889806578179120.5768569624
594986.68291881011648.8527070066969324.51313061352
604986.68291881011454.0829142898989519.28292333032
614986.68291881011267.3445482841329706.02128933609
624986.6829188101187.71909877010339885.64673885012
634986.68291881011-85.549170182185710058.9150078024


Parameters (Session):
par1 = 12 ; par2 = Double ; par3 = additive ; par4 = 12 ;
Parameters (R input):
par1 = 12 ; par2 = Single ; par3 = additive ; par4 = 12 ;
R code (references can be found in the software module):
par1 <- as.numeric(par1)
par4 <- as.numeric(par4)
if (par2 == 'Single') K <- 1
if (par2 == 'Double') K <- 2
if (par2 == 'Triple') K <- par1
nx <- length(x)
nxmK <- nx - K
x <- ts(x, frequency = par1)
if (par2 == 'Single') fit <- HoltWinters(x, gamma=F, beta=F)
if (par2 == 'Double') fit <- HoltWinters(x, gamma=F)
if (par2 == 'Triple') fit <- HoltWinters(x, seasonal=par3)
fit
myresid <- x - fit$fitted[,'xhat']
bitmap(file='test1.png')
op <- par(mfrow=c(2,1))
plot(fit,ylab='Observed (black) / Fitted (red)',main='Interpolation Fit of Exponential Smoothing')
plot(myresid,ylab='Residuals',main='Interpolation Prediction Errors')
par(op)
dev.off()
bitmap(file='test2.png')
p <- predict(fit, par4, prediction.interval=TRUE)
np <- length(p[,1])
plot(fit,p,ylab='Observed (black) / Fitted (red)',main='Extrapolation Fit of Exponential Smoothing')
dev.off()
bitmap(file='test3.png')
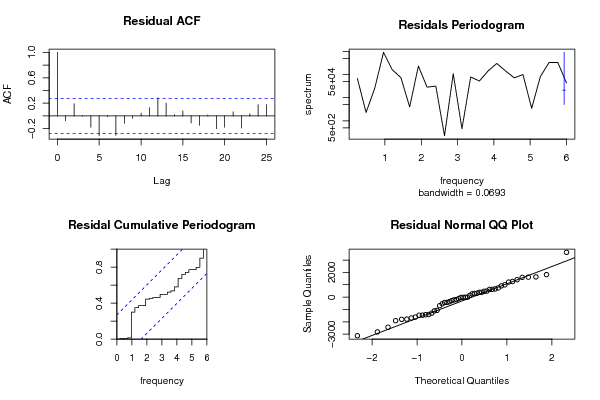
op <- par(mfrow = c(2,2))
acf(as.numeric(myresid),lag.max = nx/2,main='Residual ACF')
spectrum(myresid,main='Residals Periodogram')
cpgram(myresid,main='Residal Cumulative Periodogram')
qqnorm(myresid,main='Residual Normal QQ Plot')
qqline(myresid)
par(op)
dev.off()
load(file='createtable')
a<-table.start()
a<-table.row.start(a)
a<-table.element(a,'Estimated Parameters of Exponential Smoothing',2,TRUE)
a<-table.row.end(a)
a<-table.row.start(a)
a<-table.element(a,'Parameter',header=TRUE)
a<-table.element(a,'Value',header=TRUE)
a<-table.row.end(a)
a<-table.row.start(a)
a<-table.element(a,'alpha',header=TRUE)
a<-table.element(a,fit$alpha)
a<-table.row.end(a)
a<-table.row.start(a)
a<-table.element(a,'beta',header=TRUE)
a<-table.element(a,fit$beta)
a<-table.row.end(a)
a<-table.row.start(a)
a<-table.element(a,'gamma',header=TRUE)
a<-table.element(a,fit$gamma)
a<-table.row.end(a)
a<-table.end(a)
table.save(a,file='mytable.tab')
a<-table.start()
a<-table.row.start(a)
a<-table.element(a,'Interpolation Forecasts of Exponential Smoothing',4,TRUE)
a<-table.row.end(a)
a<-table.row.start(a)
a<-table.element(a,'t',header=TRUE)
a<-table.element(a,'Observed',header=TRUE)
a<-table.element(a,'Fitted',header=TRUE)
a<-table.element(a,'Residuals',header=TRUE)
a<-table.row.end(a)
for (i in 1:nxmK) {
a<-table.row.start(a)
a<-table.element(a,i+K,header=TRUE)
a<-table.element(a,x[i+K])
a<-table.element(a,fit$fitted[i,'xhat'])
a<-table.element(a,myresid[i])
a<-table.row.end(a)
}
a<-table.end(a)
table.save(a,file='mytable1.tab')
a<-table.start()
a<-table.row.start(a)
a<-table.element(a,'Extrapolation Forecasts of Exponential Smoothing',4,TRUE)
a<-table.row.end(a)
a<-table.row.start(a)
a<-table.element(a,'t',header=TRUE)
a<-table.element(a,'Forecast',header=TRUE)
a<-table.element(a,'95% Lower Bound',header=TRUE)
a<-table.element(a,'95% Upper Bound',header=TRUE)
a<-table.row.end(a)
for (i in 1:np) {
a<-table.row.start(a)
a<-table.element(a,nx+i,header=TRUE)
a<-table.element(a,p[i,'fit'])
a<-table.element(a,p[i,'lwr'])
a<-table.element(a,p[i,'upr'])
a<-table.row.end(a)
}
a<-table.end(a)
table.save(a,file='mytable2.tab')