Free Statistics

of Irreproducible Research!

Author's title

Author*The author of this computation has been verified*
R Software Modulerwasp_univariatedataseries.wasp
Title produced by softwareUnivariate Data Series
Date of computationSun, 18 Dec 2016 13:40:05 +0100
Cite this page as followsStatistical Computations at FreeStatistics.org, Office for Research Development and Education, URL https://freestatistics.org/blog/index.php?v=date/2016/Dec/18/t1482064812vww0vntec4pnz6e.htm/, Retrieved Wed, 08 May 2024 14:50:50 +0000
Statistical Computations at FreeStatistics.org, Office for Research Development and Education, URL https://freestatistics.org/blog/index.php?pk=301035, Retrieved Wed, 08 May 2024 14:50:50 +0000
QR Codes:

Original text written by user:
IsPrivate?No (this computation is public)
User-defined keywords
Estimated Impact102
Family? (F = Feedback message, R = changed R code, M = changed R Module, P = changed Parameters, D = changed Data)
-     [Exponential Smoothing] [] [2016-12-18 12:31:12] [683f400e1b95307fc738e729f07c4fce]
- RM D    [Univariate Data Series] [] [2016-12-18 12:40:05] [404ac5ee4f7301873f6a96ef36861981] [Current]
Feedback Forum

Post a new message
Dataseries X:
305
408
2730
954
272
486
801
21
933
821
310
452
313
968
882
470
504
561
98
793
781
321
84
705
252
737
832
330
469
758
903
55
731
390
976
323
921
878
835
318
503
390
717
68
286
500
632
678
765
3
703
2
981
2671
15
19
246
997
296
111
551
522
165
641
758
558
662
577
540
298
537
690
920
622
355
405
603
106
44
678
754
259
2605
858
514
223
832
550
250
23
520
581
680
581
929
686
335
153
494
534
666
52
184
357
742
559
563
373
758
101
367
216
682
90
124
998
180
764
877
637
971
637
169
404
949
477
2228
781
330
248
647
170
29
721


Summary of computational transaction
Raw Input view raw input (R code)
Raw Outputview raw output of R engine
Computing time1 seconds
R ServerBig Analytics Cloud Computing Center

\begin{tabular}{lllllllll}
\hline
Summary of computational transaction \tabularnewline
Raw Input view raw input (R code)  \tabularnewline
Raw Outputview raw output of R engine  \tabularnewline
Computing time1 seconds \tabularnewline
R ServerBig Analytics Cloud Computing Center \tabularnewline
\hline
\end{tabular}
%Source: https://freestatistics.org/blog/index.php?pk=301035&T=0

[TABLE]
[ROW]
Summary of computational transaction[/C][/ROW] [ROW]Raw Input[/C] view raw input (R code) [/C][/ROW] [ROW]Raw Output[/C]view raw output of R engine [/C][/ROW] [ROW]Computing time[/C]1 seconds[/C][/ROW] [ROW]R Server[/C]Big Analytics Cloud Computing Center[/C][/ROW] [/TABLE] Source: https://freestatistics.org/blog/index.php?pk=301035&T=0

Globally Unique Identifier (entire table): ba.freestatistics.org/blog/index.php?pk=301035&T=0

As an alternative you can also use a QR Code:  

The GUIDs for individual cells are displayed in the table below:

Summary of computational transaction
Raw Input view raw input (R code)
Raw Outputview raw output of R engine
Computing time1 seconds
R ServerBig Analytics Cloud Computing Center


Univariate Dataseries
Name of dataseries12
SourceDouble
Descriptionadditive
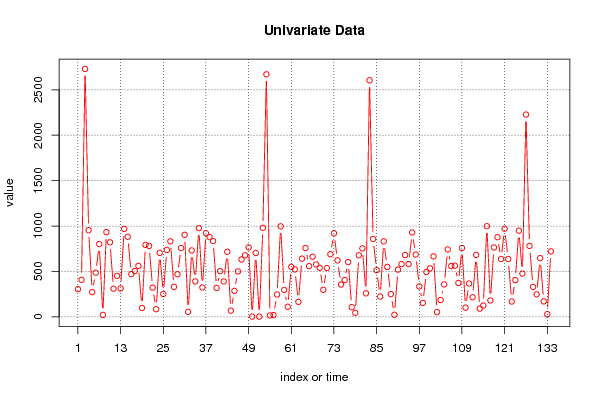
Number of observations134

\begin{tabular}{lllllllll}
\hline
Univariate Dataseries \tabularnewline
Name of dataseries & 12 \tabularnewline
Source & Double \tabularnewline
Description & additive \tabularnewline
Number of observations & 134 \tabularnewline
\hline
\end{tabular}
%Source: https://freestatistics.org/blog/index.php?pk=301035&T=1

[TABLE]
[ROW][C]Univariate Dataseries[/C][/ROW]
[ROW][C]Name of dataseries[/C][C]12[/C][/ROW]
[ROW][C]Source[/C][C]Double[/C][/ROW]
[ROW][C]Description[/C][C]additive[/C][/ROW]
[ROW][C]Number of observations[/C][C]134[/C][/ROW]
[/TABLE]
Source: https://freestatistics.org/blog/index.php?pk=301035&T=1

Globally Unique Identifier (entire table): ba.freestatistics.org/blog/index.php?pk=301035&T=1

As an alternative you can also use a QR Code:  

The GUIDs for individual cells are displayed in the table below:

Univariate Dataseries
Name of dataseries12
SourceDouble
Descriptionadditive
Number of observations134


Summary Statistics of dataseries x
> summary(x)
   Min. 1st Qu.  Median    Mean 3rd Qu.    Max. 
    2.0   296.5   538.5   566.5   757.0  2730.0 

\begin{tabular}{lllllllll}
\hline
Summary Statistics of dataseries x \tabularnewline
> summary(x)
   Min. 1st Qu.  Median    Mean 3rd Qu.    Max. 
    2.0   296.5   538.5   566.5   757.0  2730.0 
\tabularnewline \hline \end{tabular} %Source: https://freestatistics.org/blog/index.php?pk=301035&T=2

[TABLE]
[ROW][C]Summary Statistics of dataseries x[/C][/ROW]
[ROW][C]
> summary(x)
   Min. 1st Qu.  Median    Mean 3rd Qu.    Max. 
    2.0   296.5   538.5   566.5   757.0  2730.0 
[/C][/ROW] [/TABLE] Source: https://freestatistics.org/blog/index.php?pk=301035&T=2

Globally Unique Identifier (entire table): ba.freestatistics.org/blog/index.php?pk=301035&T=2

As an alternative you can also use a QR Code:  

The GUIDs for individual cells are displayed in the table below:

Summary Statistics of dataseries x
> summary(x)
   Min. 1st Qu.  Median    Mean 3rd Qu.    Max. 
    2.0   296.5   538.5   566.5   757.0  2730.0 


Parameters (Session):
par1 = 12 ; par2 = Double ; par3 = additive ; par4 = 12 ;
Parameters (R input):
par1 = 12 ; par2 = Double ; par3 = additive ; par4 = 12 ;
R code (references can be found in the software module):
if (par4 != 'No season') {
par4 <- as.numeric(par4)
if (par4 < 4) par4 <- 12
}
summary(x)
n <- length(x)
bitmap(file='test1.png')
if (par4=='No season') {
plot(x,col=2,type='b',main=main,xlab=xlab,ylab=ylab,xaxt='n')
axis(1,at=seq(1,n,10))
}
if (par4!='No season') {
plot(x,col=2,type='b',main=main,xlab=xlab,ylab=ylab,xaxt='n')
axis(1,at=seq(1,n,par4))
grid(nx=0,ny=NULL,col='black')
abline(v=seq(1,n,par4),col='black',lty='dotted')
}
dev.off()
load(file='createtable')
a<-table.start()
a<-table.row.start(a)
a<-table.element(a,'Univariate Dataseries',2,TRUE)
a<-table.row.end(a)
a<-table.row.start(a)
a<-table.element(a,'Name of dataseries',header=TRUE)
a<-table.element(a,par1)
a<-table.row.end(a)
a<-table.row.start(a)
a<-table.element(a,'Source',header=TRUE)
a<-table.element(a,par2)
a<-table.row.end(a)
a<-table.row.start(a)
a<-table.element(a,'Description',header=TRUE)
a<-table.element(a,par3)
a<-table.row.end(a)
a<-table.row.start(a)
a<-table.element(a,'Number of observations',header=TRUE)
a<-table.element(a,length(x))
a<-table.row.end(a)
a<-table.end(a)
table.save(a,file='mytable.tab')
a<-table.start()
a<-table.row.start(a)
a<-table.element(a,'Summary Statistics of dataseries x',1,TRUE)
a<-table.row.end(a)
a<-table.row.start(a)
a<-table.element(a,paste('
',RC.texteval('summary(x)'),'
',sep=''))
a<-table.row.end(a)
a<-table.end(a)
table.save(a,file='mytable1.tab')