Free Statistics

of Irreproducible Research!

Author's title

Author*The author of this computation has been verified*
R Software Modulerwasp_autocorrelation.wasp
Title produced by software(Partial) Autocorrelation Function
Date of computationSun, 18 Dec 2016 13:41:27 +0100
Cite this page as followsStatistical Computations at FreeStatistics.org, Office for Research Development and Education, URL https://freestatistics.org/blog/index.php?v=date/2016/Dec/18/t1482064913h7hxerat348clfj.htm/, Retrieved Wed, 08 May 2024 06:18:38 +0000
Statistical Computations at FreeStatistics.org, Office for Research Development and Education, URL https://freestatistics.org/blog/index.php?pk=301036, Retrieved Wed, 08 May 2024 06:18:38 +0000
QR Codes:

Original text written by user:
IsPrivate?No (this computation is public)
User-defined keywords
Estimated Impact90
Family? (F = Feedback message, R = changed R code, M = changed R Module, P = changed Parameters, D = changed Data)
-     [Exponential Smoothing] [] [2016-12-18 12:31:12] [683f400e1b95307fc738e729f07c4fce]
- RM D    [(Partial) Autocorrelation Function] [] [2016-12-18 12:41:27] [404ac5ee4f7301873f6a96ef36861981] [Current]
Feedback Forum

Post a new message
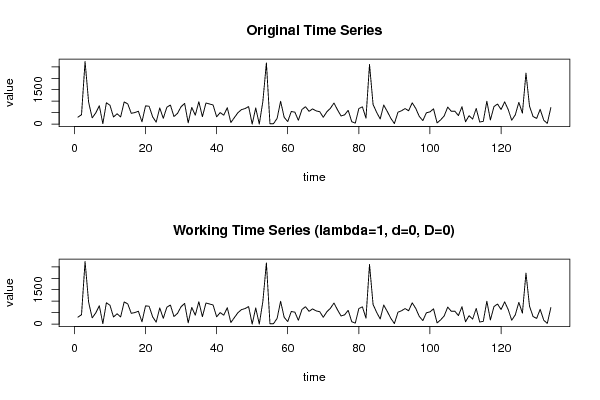
Dataseries X:
305
408
2730
954
272
486
801
21
933
821
310
452
313
968
882
470
504
561
98
793
781
321
84
705
252
737
832
330
469
758
903
55
731
390
976
323
921
878
835
318
503
390
717
68
286
500
632
678
765
3
703
2
981
2671
15
19
246
997
296
111
551
522
165
641
758
558
662
577
540
298
537
690
920
622
355
405
603
106
44
678
754
259
2605
858
514
223
832
550
250
23
520
581
680
581
929
686
335
153
494
534
666
52
184
357
742
559
563
373
758
101
367
216
682
90
124
998
180
764
877
637
971
637
169
404
949
477
2228
781
330
248
647
170
29
721


Summary of computational transaction
Raw Input view raw input (R code)
Raw Outputview raw output of R engine
Computing time1 seconds
R ServerBig Analytics Cloud Computing Center

\begin{tabular}{lllllllll}
\hline
Summary of computational transaction \tabularnewline
Raw Input view raw input (R code)  \tabularnewline
Raw Outputview raw output of R engine  \tabularnewline
Computing time1 seconds \tabularnewline
R ServerBig Analytics Cloud Computing Center \tabularnewline
\hline
\end{tabular}
%Source: https://freestatistics.org/blog/index.php?pk=301036&T=0

[TABLE]
[ROW]
Summary of computational transaction[/C][/ROW] [ROW]Raw Input[/C] view raw input (R code) [/C][/ROW] [ROW]Raw Output[/C]view raw output of R engine [/C][/ROW] [ROW]Computing time[/C]1 seconds[/C][/ROW] [ROW]R Server[/C]Big Analytics Cloud Computing Center[/C][/ROW] [/TABLE] Source: https://freestatistics.org/blog/index.php?pk=301036&T=0

Globally Unique Identifier (entire table): ba.freestatistics.org/blog/index.php?pk=301036&T=0

As an alternative you can also use a QR Code:  

The GUIDs for individual cells are displayed in the table below:

Summary of computational transaction
Raw Input view raw input (R code)
Raw Outputview raw output of R engine
Computing time1 seconds
R ServerBig Analytics Cloud Computing Center


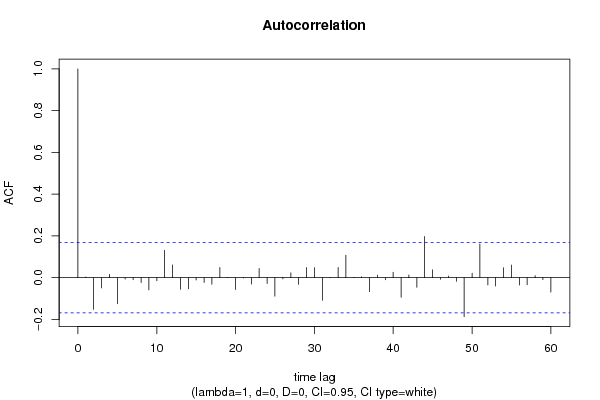
Autocorrelation Function
Time lag kACF(k)T-STATP-value
10.0030040.03480.486158
2-0.152328-1.76330.040062
3-0.049249-0.57010.284781
40.0156650.18130.42819
5-0.12505-1.44760.075038
6-0.00691-0.080.468181
7-0.010434-0.12080.452022
8-0.023583-0.2730.392639
9-0.058885-0.68160.248319
10-0.015055-0.17430.430958
110.1309691.51610.065928
120.0609440.70550.240868
13-0.055565-0.64320.260594
14-0.053167-0.61540.269651
15-0.011642-0.13480.446502
16-0.022856-0.26460.39587
17-0.031743-0.36750.35693
180.0485540.56210.287508
190.0008920.01030.49589
20-0.057193-0.66210.254537
21-0.002118-0.02450.490239
22-0.030752-0.3560.361207
230.0435140.50370.307644
24-0.028216-0.32660.372233
25-0.08877-1.02760.152999
26-0.005878-0.0680.472926
270.022870.26470.39581
28-0.032324-0.37420.354434
290.0486510.56320.287127
300.0481820.55770.288976
31-0.108735-1.25870.105164
320.001110.01280.494885
330.0488630.56560.286294
340.1073671.24290.108043
350.0013430.01550.493812
360.0038890.0450.482078
37-0.067183-0.77770.21906
380.0117150.13560.446167
39-0.009914-0.11480.454403
400.0258470.29920.382625
41-0.094107-1.08940.138973
420.0124810.14450.442669
43-0.045897-0.53130.298047
440.1975152.28640.0119
450.0371570.43010.333899
46-0.007753-0.08970.464313
470.0072390.08380.466673
48-0.017538-0.2030.419714
49-0.186965-2.16430.016108
500.0210490.24370.403932
510.1609281.86290.032335
52-0.034639-0.4010.34454
53-0.04044-0.46810.320227
540.0478080.55340.29045
550.060060.69520.244052
56-0.035227-0.40780.342042
57-0.033863-0.3920.347844
580.0095260.11030.456178
59-0.009694-0.11220.45541
60-0.069319-0.80240.211863

\begin{tabular}{lllllllll}
\hline
Autocorrelation Function \tabularnewline
Time lag k & ACF(k) & T-STAT & P-value \tabularnewline
1 & 0.003004 & 0.0348 & 0.486158 \tabularnewline
2 & -0.152328 & -1.7633 & 0.040062 \tabularnewline
3 & -0.049249 & -0.5701 & 0.284781 \tabularnewline
4 & 0.015665 & 0.1813 & 0.42819 \tabularnewline
5 & -0.12505 & -1.4476 & 0.075038 \tabularnewline
6 & -0.00691 & -0.08 & 0.468181 \tabularnewline
7 & -0.010434 & -0.1208 & 0.452022 \tabularnewline
8 & -0.023583 & -0.273 & 0.392639 \tabularnewline
9 & -0.058885 & -0.6816 & 0.248319 \tabularnewline
10 & -0.015055 & -0.1743 & 0.430958 \tabularnewline
11 & 0.130969 & 1.5161 & 0.065928 \tabularnewline
12 & 0.060944 & 0.7055 & 0.240868 \tabularnewline
13 & -0.055565 & -0.6432 & 0.260594 \tabularnewline
14 & -0.053167 & -0.6154 & 0.269651 \tabularnewline
15 & -0.011642 & -0.1348 & 0.446502 \tabularnewline
16 & -0.022856 & -0.2646 & 0.39587 \tabularnewline
17 & -0.031743 & -0.3675 & 0.35693 \tabularnewline
18 & 0.048554 & 0.5621 & 0.287508 \tabularnewline
19 & 0.000892 & 0.0103 & 0.49589 \tabularnewline
20 & -0.057193 & -0.6621 & 0.254537 \tabularnewline
21 & -0.002118 & -0.0245 & 0.490239 \tabularnewline
22 & -0.030752 & -0.356 & 0.361207 \tabularnewline
23 & 0.043514 & 0.5037 & 0.307644 \tabularnewline
24 & -0.028216 & -0.3266 & 0.372233 \tabularnewline
25 & -0.08877 & -1.0276 & 0.152999 \tabularnewline
26 & -0.005878 & -0.068 & 0.472926 \tabularnewline
27 & 0.02287 & 0.2647 & 0.39581 \tabularnewline
28 & -0.032324 & -0.3742 & 0.354434 \tabularnewline
29 & 0.048651 & 0.5632 & 0.287127 \tabularnewline
30 & 0.048182 & 0.5577 & 0.288976 \tabularnewline
31 & -0.108735 & -1.2587 & 0.105164 \tabularnewline
32 & 0.00111 & 0.0128 & 0.494885 \tabularnewline
33 & 0.048863 & 0.5656 & 0.286294 \tabularnewline
34 & 0.107367 & 1.2429 & 0.108043 \tabularnewline
35 & 0.001343 & 0.0155 & 0.493812 \tabularnewline
36 & 0.003889 & 0.045 & 0.482078 \tabularnewline
37 & -0.067183 & -0.7777 & 0.21906 \tabularnewline
38 & 0.011715 & 0.1356 & 0.446167 \tabularnewline
39 & -0.009914 & -0.1148 & 0.454403 \tabularnewline
40 & 0.025847 & 0.2992 & 0.382625 \tabularnewline
41 & -0.094107 & -1.0894 & 0.138973 \tabularnewline
42 & 0.012481 & 0.1445 & 0.442669 \tabularnewline
43 & -0.045897 & -0.5313 & 0.298047 \tabularnewline
44 & 0.197515 & 2.2864 & 0.0119 \tabularnewline
45 & 0.037157 & 0.4301 & 0.333899 \tabularnewline
46 & -0.007753 & -0.0897 & 0.464313 \tabularnewline
47 & 0.007239 & 0.0838 & 0.466673 \tabularnewline
48 & -0.017538 & -0.203 & 0.419714 \tabularnewline
49 & -0.186965 & -2.1643 & 0.016108 \tabularnewline
50 & 0.021049 & 0.2437 & 0.403932 \tabularnewline
51 & 0.160928 & 1.8629 & 0.032335 \tabularnewline
52 & -0.034639 & -0.401 & 0.34454 \tabularnewline
53 & -0.04044 & -0.4681 & 0.320227 \tabularnewline
54 & 0.047808 & 0.5534 & 0.29045 \tabularnewline
55 & 0.06006 & 0.6952 & 0.244052 \tabularnewline
56 & -0.035227 & -0.4078 & 0.342042 \tabularnewline
57 & -0.033863 & -0.392 & 0.347844 \tabularnewline
58 & 0.009526 & 0.1103 & 0.456178 \tabularnewline
59 & -0.009694 & -0.1122 & 0.45541 \tabularnewline
60 & -0.069319 & -0.8024 & 0.211863 \tabularnewline
\hline
\end{tabular}
%Source: https://freestatistics.org/blog/index.php?pk=301036&T=1

[TABLE]
[ROW][C]Autocorrelation Function[/C][/ROW]
[ROW][C]Time lag k[/C][C]ACF(k)[/C][C]T-STAT[/C][C]P-value[/C][/ROW]
[ROW][C]1[/C][C]0.003004[/C][C]0.0348[/C][C]0.486158[/C][/ROW]
[ROW][C]2[/C][C]-0.152328[/C][C]-1.7633[/C][C]0.040062[/C][/ROW]
[ROW][C]3[/C][C]-0.049249[/C][C]-0.5701[/C][C]0.284781[/C][/ROW]
[ROW][C]4[/C][C]0.015665[/C][C]0.1813[/C][C]0.42819[/C][/ROW]
[ROW][C]5[/C][C]-0.12505[/C][C]-1.4476[/C][C]0.075038[/C][/ROW]
[ROW][C]6[/C][C]-0.00691[/C][C]-0.08[/C][C]0.468181[/C][/ROW]
[ROW][C]7[/C][C]-0.010434[/C][C]-0.1208[/C][C]0.452022[/C][/ROW]
[ROW][C]8[/C][C]-0.023583[/C][C]-0.273[/C][C]0.392639[/C][/ROW]
[ROW][C]9[/C][C]-0.058885[/C][C]-0.6816[/C][C]0.248319[/C][/ROW]
[ROW][C]10[/C][C]-0.015055[/C][C]-0.1743[/C][C]0.430958[/C][/ROW]
[ROW][C]11[/C][C]0.130969[/C][C]1.5161[/C][C]0.065928[/C][/ROW]
[ROW][C]12[/C][C]0.060944[/C][C]0.7055[/C][C]0.240868[/C][/ROW]
[ROW][C]13[/C][C]-0.055565[/C][C]-0.6432[/C][C]0.260594[/C][/ROW]
[ROW][C]14[/C][C]-0.053167[/C][C]-0.6154[/C][C]0.269651[/C][/ROW]
[ROW][C]15[/C][C]-0.011642[/C][C]-0.1348[/C][C]0.446502[/C][/ROW]
[ROW][C]16[/C][C]-0.022856[/C][C]-0.2646[/C][C]0.39587[/C][/ROW]
[ROW][C]17[/C][C]-0.031743[/C][C]-0.3675[/C][C]0.35693[/C][/ROW]
[ROW][C]18[/C][C]0.048554[/C][C]0.5621[/C][C]0.287508[/C][/ROW]
[ROW][C]19[/C][C]0.000892[/C][C]0.0103[/C][C]0.49589[/C][/ROW]
[ROW][C]20[/C][C]-0.057193[/C][C]-0.6621[/C][C]0.254537[/C][/ROW]
[ROW][C]21[/C][C]-0.002118[/C][C]-0.0245[/C][C]0.490239[/C][/ROW]
[ROW][C]22[/C][C]-0.030752[/C][C]-0.356[/C][C]0.361207[/C][/ROW]
[ROW][C]23[/C][C]0.043514[/C][C]0.5037[/C][C]0.307644[/C][/ROW]
[ROW][C]24[/C][C]-0.028216[/C][C]-0.3266[/C][C]0.372233[/C][/ROW]
[ROW][C]25[/C][C]-0.08877[/C][C]-1.0276[/C][C]0.152999[/C][/ROW]
[ROW][C]26[/C][C]-0.005878[/C][C]-0.068[/C][C]0.472926[/C][/ROW]
[ROW][C]27[/C][C]0.02287[/C][C]0.2647[/C][C]0.39581[/C][/ROW]
[ROW][C]28[/C][C]-0.032324[/C][C]-0.3742[/C][C]0.354434[/C][/ROW]
[ROW][C]29[/C][C]0.048651[/C][C]0.5632[/C][C]0.287127[/C][/ROW]
[ROW][C]30[/C][C]0.048182[/C][C]0.5577[/C][C]0.288976[/C][/ROW]
[ROW][C]31[/C][C]-0.108735[/C][C]-1.2587[/C][C]0.105164[/C][/ROW]
[ROW][C]32[/C][C]0.00111[/C][C]0.0128[/C][C]0.494885[/C][/ROW]
[ROW][C]33[/C][C]0.048863[/C][C]0.5656[/C][C]0.286294[/C][/ROW]
[ROW][C]34[/C][C]0.107367[/C][C]1.2429[/C][C]0.108043[/C][/ROW]
[ROW][C]35[/C][C]0.001343[/C][C]0.0155[/C][C]0.493812[/C][/ROW]
[ROW][C]36[/C][C]0.003889[/C][C]0.045[/C][C]0.482078[/C][/ROW]
[ROW][C]37[/C][C]-0.067183[/C][C]-0.7777[/C][C]0.21906[/C][/ROW]
[ROW][C]38[/C][C]0.011715[/C][C]0.1356[/C][C]0.446167[/C][/ROW]
[ROW][C]39[/C][C]-0.009914[/C][C]-0.1148[/C][C]0.454403[/C][/ROW]
[ROW][C]40[/C][C]0.025847[/C][C]0.2992[/C][C]0.382625[/C][/ROW]
[ROW][C]41[/C][C]-0.094107[/C][C]-1.0894[/C][C]0.138973[/C][/ROW]
[ROW][C]42[/C][C]0.012481[/C][C]0.1445[/C][C]0.442669[/C][/ROW]
[ROW][C]43[/C][C]-0.045897[/C][C]-0.5313[/C][C]0.298047[/C][/ROW]
[ROW][C]44[/C][C]0.197515[/C][C]2.2864[/C][C]0.0119[/C][/ROW]
[ROW][C]45[/C][C]0.037157[/C][C]0.4301[/C][C]0.333899[/C][/ROW]
[ROW][C]46[/C][C]-0.007753[/C][C]-0.0897[/C][C]0.464313[/C][/ROW]
[ROW][C]47[/C][C]0.007239[/C][C]0.0838[/C][C]0.466673[/C][/ROW]
[ROW][C]48[/C][C]-0.017538[/C][C]-0.203[/C][C]0.419714[/C][/ROW]
[ROW][C]49[/C][C]-0.186965[/C][C]-2.1643[/C][C]0.016108[/C][/ROW]
[ROW][C]50[/C][C]0.021049[/C][C]0.2437[/C][C]0.403932[/C][/ROW]
[ROW][C]51[/C][C]0.160928[/C][C]1.8629[/C][C]0.032335[/C][/ROW]
[ROW][C]52[/C][C]-0.034639[/C][C]-0.401[/C][C]0.34454[/C][/ROW]
[ROW][C]53[/C][C]-0.04044[/C][C]-0.4681[/C][C]0.320227[/C][/ROW]
[ROW][C]54[/C][C]0.047808[/C][C]0.5534[/C][C]0.29045[/C][/ROW]
[ROW][C]55[/C][C]0.06006[/C][C]0.6952[/C][C]0.244052[/C][/ROW]
[ROW][C]56[/C][C]-0.035227[/C][C]-0.4078[/C][C]0.342042[/C][/ROW]
[ROW][C]57[/C][C]-0.033863[/C][C]-0.392[/C][C]0.347844[/C][/ROW]
[ROW][C]58[/C][C]0.009526[/C][C]0.1103[/C][C]0.456178[/C][/ROW]
[ROW][C]59[/C][C]-0.009694[/C][C]-0.1122[/C][C]0.45541[/C][/ROW]
[ROW][C]60[/C][C]-0.069319[/C][C]-0.8024[/C][C]0.211863[/C][/ROW]
[/TABLE]
Source: https://freestatistics.org/blog/index.php?pk=301036&T=1

Globally Unique Identifier (entire table): ba.freestatistics.org/blog/index.php?pk=301036&T=1

As an alternative you can also use a QR Code:  

The GUIDs for individual cells are displayed in the table below:

Autocorrelation Function
Time lag kACF(k)T-STATP-value
10.0030040.03480.486158
2-0.152328-1.76330.040062
3-0.049249-0.57010.284781
40.0156650.18130.42819
5-0.12505-1.44760.075038
6-0.00691-0.080.468181
7-0.010434-0.12080.452022
8-0.023583-0.2730.392639
9-0.058885-0.68160.248319
10-0.015055-0.17430.430958
110.1309691.51610.065928
120.0609440.70550.240868
13-0.055565-0.64320.260594
14-0.053167-0.61540.269651
15-0.011642-0.13480.446502
16-0.022856-0.26460.39587
17-0.031743-0.36750.35693
180.0485540.56210.287508
190.0008920.01030.49589
20-0.057193-0.66210.254537
21-0.002118-0.02450.490239
22-0.030752-0.3560.361207
230.0435140.50370.307644
24-0.028216-0.32660.372233
25-0.08877-1.02760.152999
26-0.005878-0.0680.472926
270.022870.26470.39581
28-0.032324-0.37420.354434
290.0486510.56320.287127
300.0481820.55770.288976
31-0.108735-1.25870.105164
320.001110.01280.494885
330.0488630.56560.286294
340.1073671.24290.108043
350.0013430.01550.493812
360.0038890.0450.482078
37-0.067183-0.77770.21906
380.0117150.13560.446167
39-0.009914-0.11480.454403
400.0258470.29920.382625
41-0.094107-1.08940.138973
420.0124810.14450.442669
43-0.045897-0.53130.298047
440.1975152.28640.0119
450.0371570.43010.333899
46-0.007753-0.08970.464313
470.0072390.08380.466673
48-0.017538-0.2030.419714
49-0.186965-2.16430.016108
500.0210490.24370.403932
510.1609281.86290.032335
52-0.034639-0.4010.34454
53-0.04044-0.46810.320227
540.0478080.55340.29045
550.060060.69520.244052
56-0.035227-0.40780.342042
57-0.033863-0.3920.347844
580.0095260.11030.456178
59-0.009694-0.11220.45541
60-0.069319-0.80240.211863


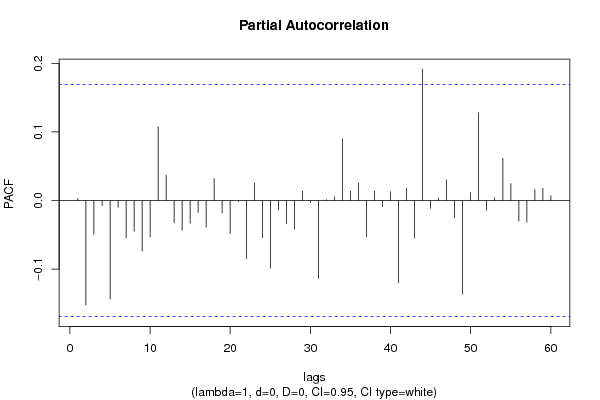
Partial Autocorrelation Function
Time lag kPACF(k)T-STATP-value
10.0030040.03480.486158
2-0.152339-1.76340.040052
3-0.049412-0.5720.284146
4-0.007765-0.08990.464255
5-0.143729-1.66380.049246
6-0.009916-0.11480.454393
7-0.054282-0.62840.265418
8-0.0448-0.51860.302449
9-0.073598-0.8520.197879
10-0.053155-0.61530.269697
110.1073741.24290.10803
120.036940.42760.334811
13-0.032446-0.37560.353907
14-0.043191-0.50.308957
15-0.033166-0.38390.35082
16-0.017137-0.19840.421526
17-0.03891-0.45040.32657
180.0319160.36950.356184
19-0.018355-0.21250.416029
20-0.047977-0.55540.289783
21-0.00165-0.01910.492397
22-0.084875-0.98250.163812
230.0255620.29590.383881
24-0.054125-0.62650.266014
25-0.098378-1.13880.128409
26-0.013885-0.16070.436273
27-0.033962-0.39310.34742
28-0.041551-0.4810.315655
290.0134040.15520.438465
30-0.002883-0.03340.486715
31-0.113674-1.31590.095231
320.0012140.01410.494405
330.0053140.06150.475522
340.0900121.0420.149651
350.0135450.15680.437819
360.0253990.2940.384602
37-0.052975-0.61320.270381
380.0134680.15590.438174
39-0.008975-0.10390.458706
400.0127720.14780.441342
41-0.120038-1.38950.083486
420.0176780.20460.419083
43-0.054702-0.63320.263833
440.1917432.21960.014064
45-0.011309-0.13090.44802
460.0036470.04220.483192
470.0298990.34610.364902
48-0.025099-0.29050.385928
49-0.136733-1.58280.057913
500.0111870.12950.448578
510.1277691.4790.07074
52-0.01469-0.170.432615
530.0044320.05130.479579
540.0613610.71030.239374
550.0246420.28520.387948
56-0.030059-0.3480.364208
57-0.031733-0.36730.356974
580.0158390.18340.427399
590.0179360.20760.417919
600.0069230.08010.468122

\begin{tabular}{lllllllll}
\hline
Partial Autocorrelation Function \tabularnewline
Time lag k & PACF(k) & T-STAT & P-value \tabularnewline
1 & 0.003004 & 0.0348 & 0.486158 \tabularnewline
2 & -0.152339 & -1.7634 & 0.040052 \tabularnewline
3 & -0.049412 & -0.572 & 0.284146 \tabularnewline
4 & -0.007765 & -0.0899 & 0.464255 \tabularnewline
5 & -0.143729 & -1.6638 & 0.049246 \tabularnewline
6 & -0.009916 & -0.1148 & 0.454393 \tabularnewline
7 & -0.054282 & -0.6284 & 0.265418 \tabularnewline
8 & -0.0448 & -0.5186 & 0.302449 \tabularnewline
9 & -0.073598 & -0.852 & 0.197879 \tabularnewline
10 & -0.053155 & -0.6153 & 0.269697 \tabularnewline
11 & 0.107374 & 1.2429 & 0.10803 \tabularnewline
12 & 0.03694 & 0.4276 & 0.334811 \tabularnewline
13 & -0.032446 & -0.3756 & 0.353907 \tabularnewline
14 & -0.043191 & -0.5 & 0.308957 \tabularnewline
15 & -0.033166 & -0.3839 & 0.35082 \tabularnewline
16 & -0.017137 & -0.1984 & 0.421526 \tabularnewline
17 & -0.03891 & -0.4504 & 0.32657 \tabularnewline
18 & 0.031916 & 0.3695 & 0.356184 \tabularnewline
19 & -0.018355 & -0.2125 & 0.416029 \tabularnewline
20 & -0.047977 & -0.5554 & 0.289783 \tabularnewline
21 & -0.00165 & -0.0191 & 0.492397 \tabularnewline
22 & -0.084875 & -0.9825 & 0.163812 \tabularnewline
23 & 0.025562 & 0.2959 & 0.383881 \tabularnewline
24 & -0.054125 & -0.6265 & 0.266014 \tabularnewline
25 & -0.098378 & -1.1388 & 0.128409 \tabularnewline
26 & -0.013885 & -0.1607 & 0.436273 \tabularnewline
27 & -0.033962 & -0.3931 & 0.34742 \tabularnewline
28 & -0.041551 & -0.481 & 0.315655 \tabularnewline
29 & 0.013404 & 0.1552 & 0.438465 \tabularnewline
30 & -0.002883 & -0.0334 & 0.486715 \tabularnewline
31 & -0.113674 & -1.3159 & 0.095231 \tabularnewline
32 & 0.001214 & 0.0141 & 0.494405 \tabularnewline
33 & 0.005314 & 0.0615 & 0.475522 \tabularnewline
34 & 0.090012 & 1.042 & 0.149651 \tabularnewline
35 & 0.013545 & 0.1568 & 0.437819 \tabularnewline
36 & 0.025399 & 0.294 & 0.384602 \tabularnewline
37 & -0.052975 & -0.6132 & 0.270381 \tabularnewline
38 & 0.013468 & 0.1559 & 0.438174 \tabularnewline
39 & -0.008975 & -0.1039 & 0.458706 \tabularnewline
40 & 0.012772 & 0.1478 & 0.441342 \tabularnewline
41 & -0.120038 & -1.3895 & 0.083486 \tabularnewline
42 & 0.017678 & 0.2046 & 0.419083 \tabularnewline
43 & -0.054702 & -0.6332 & 0.263833 \tabularnewline
44 & 0.191743 & 2.2196 & 0.014064 \tabularnewline
45 & -0.011309 & -0.1309 & 0.44802 \tabularnewline
46 & 0.003647 & 0.0422 & 0.483192 \tabularnewline
47 & 0.029899 & 0.3461 & 0.364902 \tabularnewline
48 & -0.025099 & -0.2905 & 0.385928 \tabularnewline
49 & -0.136733 & -1.5828 & 0.057913 \tabularnewline
50 & 0.011187 & 0.1295 & 0.448578 \tabularnewline
51 & 0.127769 & 1.479 & 0.07074 \tabularnewline
52 & -0.01469 & -0.17 & 0.432615 \tabularnewline
53 & 0.004432 & 0.0513 & 0.479579 \tabularnewline
54 & 0.061361 & 0.7103 & 0.239374 \tabularnewline
55 & 0.024642 & 0.2852 & 0.387948 \tabularnewline
56 & -0.030059 & -0.348 & 0.364208 \tabularnewline
57 & -0.031733 & -0.3673 & 0.356974 \tabularnewline
58 & 0.015839 & 0.1834 & 0.427399 \tabularnewline
59 & 0.017936 & 0.2076 & 0.417919 \tabularnewline
60 & 0.006923 & 0.0801 & 0.468122 \tabularnewline
\hline
\end{tabular}
%Source: https://freestatistics.org/blog/index.php?pk=301036&T=2

[TABLE]
[ROW][C]Partial Autocorrelation Function[/C][/ROW]
[ROW][C]Time lag k[/C][C]PACF(k)[/C][C]T-STAT[/C][C]P-value[/C][/ROW]
[ROW][C]1[/C][C]0.003004[/C][C]0.0348[/C][C]0.486158[/C][/ROW]
[ROW][C]2[/C][C]-0.152339[/C][C]-1.7634[/C][C]0.040052[/C][/ROW]
[ROW][C]3[/C][C]-0.049412[/C][C]-0.572[/C][C]0.284146[/C][/ROW]
[ROW][C]4[/C][C]-0.007765[/C][C]-0.0899[/C][C]0.464255[/C][/ROW]
[ROW][C]5[/C][C]-0.143729[/C][C]-1.6638[/C][C]0.049246[/C][/ROW]
[ROW][C]6[/C][C]-0.009916[/C][C]-0.1148[/C][C]0.454393[/C][/ROW]
[ROW][C]7[/C][C]-0.054282[/C][C]-0.6284[/C][C]0.265418[/C][/ROW]
[ROW][C]8[/C][C]-0.0448[/C][C]-0.5186[/C][C]0.302449[/C][/ROW]
[ROW][C]9[/C][C]-0.073598[/C][C]-0.852[/C][C]0.197879[/C][/ROW]
[ROW][C]10[/C][C]-0.053155[/C][C]-0.6153[/C][C]0.269697[/C][/ROW]
[ROW][C]11[/C][C]0.107374[/C][C]1.2429[/C][C]0.10803[/C][/ROW]
[ROW][C]12[/C][C]0.03694[/C][C]0.4276[/C][C]0.334811[/C][/ROW]
[ROW][C]13[/C][C]-0.032446[/C][C]-0.3756[/C][C]0.353907[/C][/ROW]
[ROW][C]14[/C][C]-0.043191[/C][C]-0.5[/C][C]0.308957[/C][/ROW]
[ROW][C]15[/C][C]-0.033166[/C][C]-0.3839[/C][C]0.35082[/C][/ROW]
[ROW][C]16[/C][C]-0.017137[/C][C]-0.1984[/C][C]0.421526[/C][/ROW]
[ROW][C]17[/C][C]-0.03891[/C][C]-0.4504[/C][C]0.32657[/C][/ROW]
[ROW][C]18[/C][C]0.031916[/C][C]0.3695[/C][C]0.356184[/C][/ROW]
[ROW][C]19[/C][C]-0.018355[/C][C]-0.2125[/C][C]0.416029[/C][/ROW]
[ROW][C]20[/C][C]-0.047977[/C][C]-0.5554[/C][C]0.289783[/C][/ROW]
[ROW][C]21[/C][C]-0.00165[/C][C]-0.0191[/C][C]0.492397[/C][/ROW]
[ROW][C]22[/C][C]-0.084875[/C][C]-0.9825[/C][C]0.163812[/C][/ROW]
[ROW][C]23[/C][C]0.025562[/C][C]0.2959[/C][C]0.383881[/C][/ROW]
[ROW][C]24[/C][C]-0.054125[/C][C]-0.6265[/C][C]0.266014[/C][/ROW]
[ROW][C]25[/C][C]-0.098378[/C][C]-1.1388[/C][C]0.128409[/C][/ROW]
[ROW][C]26[/C][C]-0.013885[/C][C]-0.1607[/C][C]0.436273[/C][/ROW]
[ROW][C]27[/C][C]-0.033962[/C][C]-0.3931[/C][C]0.34742[/C][/ROW]
[ROW][C]28[/C][C]-0.041551[/C][C]-0.481[/C][C]0.315655[/C][/ROW]
[ROW][C]29[/C][C]0.013404[/C][C]0.1552[/C][C]0.438465[/C][/ROW]
[ROW][C]30[/C][C]-0.002883[/C][C]-0.0334[/C][C]0.486715[/C][/ROW]
[ROW][C]31[/C][C]-0.113674[/C][C]-1.3159[/C][C]0.095231[/C][/ROW]
[ROW][C]32[/C][C]0.001214[/C][C]0.0141[/C][C]0.494405[/C][/ROW]
[ROW][C]33[/C][C]0.005314[/C][C]0.0615[/C][C]0.475522[/C][/ROW]
[ROW][C]34[/C][C]0.090012[/C][C]1.042[/C][C]0.149651[/C][/ROW]
[ROW][C]35[/C][C]0.013545[/C][C]0.1568[/C][C]0.437819[/C][/ROW]
[ROW][C]36[/C][C]0.025399[/C][C]0.294[/C][C]0.384602[/C][/ROW]
[ROW][C]37[/C][C]-0.052975[/C][C]-0.6132[/C][C]0.270381[/C][/ROW]
[ROW][C]38[/C][C]0.013468[/C][C]0.1559[/C][C]0.438174[/C][/ROW]
[ROW][C]39[/C][C]-0.008975[/C][C]-0.1039[/C][C]0.458706[/C][/ROW]
[ROW][C]40[/C][C]0.012772[/C][C]0.1478[/C][C]0.441342[/C][/ROW]
[ROW][C]41[/C][C]-0.120038[/C][C]-1.3895[/C][C]0.083486[/C][/ROW]
[ROW][C]42[/C][C]0.017678[/C][C]0.2046[/C][C]0.419083[/C][/ROW]
[ROW][C]43[/C][C]-0.054702[/C][C]-0.6332[/C][C]0.263833[/C][/ROW]
[ROW][C]44[/C][C]0.191743[/C][C]2.2196[/C][C]0.014064[/C][/ROW]
[ROW][C]45[/C][C]-0.011309[/C][C]-0.1309[/C][C]0.44802[/C][/ROW]
[ROW][C]46[/C][C]0.003647[/C][C]0.0422[/C][C]0.483192[/C][/ROW]
[ROW][C]47[/C][C]0.029899[/C][C]0.3461[/C][C]0.364902[/C][/ROW]
[ROW][C]48[/C][C]-0.025099[/C][C]-0.2905[/C][C]0.385928[/C][/ROW]
[ROW][C]49[/C][C]-0.136733[/C][C]-1.5828[/C][C]0.057913[/C][/ROW]
[ROW][C]50[/C][C]0.011187[/C][C]0.1295[/C][C]0.448578[/C][/ROW]
[ROW][C]51[/C][C]0.127769[/C][C]1.479[/C][C]0.07074[/C][/ROW]
[ROW][C]52[/C][C]-0.01469[/C][C]-0.17[/C][C]0.432615[/C][/ROW]
[ROW][C]53[/C][C]0.004432[/C][C]0.0513[/C][C]0.479579[/C][/ROW]
[ROW][C]54[/C][C]0.061361[/C][C]0.7103[/C][C]0.239374[/C][/ROW]
[ROW][C]55[/C][C]0.024642[/C][C]0.2852[/C][C]0.387948[/C][/ROW]
[ROW][C]56[/C][C]-0.030059[/C][C]-0.348[/C][C]0.364208[/C][/ROW]
[ROW][C]57[/C][C]-0.031733[/C][C]-0.3673[/C][C]0.356974[/C][/ROW]
[ROW][C]58[/C][C]0.015839[/C][C]0.1834[/C][C]0.427399[/C][/ROW]
[ROW][C]59[/C][C]0.017936[/C][C]0.2076[/C][C]0.417919[/C][/ROW]
[ROW][C]60[/C][C]0.006923[/C][C]0.0801[/C][C]0.468122[/C][/ROW]
[/TABLE]
Source: https://freestatistics.org/blog/index.php?pk=301036&T=2

Globally Unique Identifier (entire table): ba.freestatistics.org/blog/index.php?pk=301036&T=2

As an alternative you can also use a QR Code:  

The GUIDs for individual cells are displayed in the table below:

Partial Autocorrelation Function
Time lag kPACF(k)T-STATP-value
10.0030040.03480.486158
2-0.152339-1.76340.040052
3-0.049412-0.5720.284146
4-0.007765-0.08990.464255
5-0.143729-1.66380.049246
6-0.009916-0.11480.454393
7-0.054282-0.62840.265418
8-0.0448-0.51860.302449
9-0.073598-0.8520.197879
10-0.053155-0.61530.269697
110.1073741.24290.10803
120.036940.42760.334811
13-0.032446-0.37560.353907
14-0.043191-0.50.308957
15-0.033166-0.38390.35082
16-0.017137-0.19840.421526
17-0.03891-0.45040.32657
180.0319160.36950.356184
19-0.018355-0.21250.416029
20-0.047977-0.55540.289783
21-0.00165-0.01910.492397
22-0.084875-0.98250.163812
230.0255620.29590.383881
24-0.054125-0.62650.266014
25-0.098378-1.13880.128409
26-0.013885-0.16070.436273
27-0.033962-0.39310.34742
28-0.041551-0.4810.315655
290.0134040.15520.438465
30-0.002883-0.03340.486715
31-0.113674-1.31590.095231
320.0012140.01410.494405
330.0053140.06150.475522
340.0900121.0420.149651
350.0135450.15680.437819
360.0253990.2940.384602
37-0.052975-0.61320.270381
380.0134680.15590.438174
39-0.008975-0.10390.458706
400.0127720.14780.441342
41-0.120038-1.38950.083486
420.0176780.20460.419083
43-0.054702-0.63320.263833
440.1917432.21960.014064
45-0.011309-0.13090.44802
460.0036470.04220.483192
470.0298990.34610.364902
48-0.025099-0.29050.385928
49-0.136733-1.58280.057913
500.0111870.12950.448578
510.1277691.4790.07074
52-0.01469-0.170.432615
530.0044320.05130.479579
540.0613610.71030.239374
550.0246420.28520.387948
56-0.030059-0.3480.364208
57-0.031733-0.36730.356974
580.0158390.18340.427399
590.0179360.20760.417919
600.0069230.08010.468122


Parameters (Session):
par1 = 12 ; par2 = Double ; par3 = additive ; par4 = 12 ;
Parameters (R input):
par1 = 60 ; par2 = 1 ; par3 = 0 ; par4 = 0 ; par5 = 12 ; par6 = White Noise ; par7 = 0.95 ; par8 = ;
R code (references can be found in the software module):
par8 <- ''
par7 <- '0.95'
par6 <- 'White Noise'
par5 <- '12'
par4 <- '0'
par3 <- '0'
par2 <- '1'
par1 <- 'Default'
if (par1 == 'Default') {
par1 = 10*log10(length(x))
} else {
par1 <- as.numeric(par1)
}
par2 <- as.numeric(par2)
par3 <- as.numeric(par3)
par4 <- as.numeric(par4)
par5 <- as.numeric(par5)
if (par6 == 'White Noise') par6 <- 'white' else par6 <- 'ma'
par7 <- as.numeric(par7)
if (par8 != '') par8 <- as.numeric(par8)
x <- na.omit(x)
ox <- x
if (par8 == '') {
if (par2 == 0) {
x <- log(x)
} else {
x <- (x ^ par2 - 1) / par2
}
} else {
x <- log(x,base=par8)
}
if (par3 > 0) x <- diff(x,lag=1,difference=par3)
if (par4 > 0) x <- diff(x,lag=par5,difference=par4)
bitmap(file='picts.png')
op <- par(mfrow=c(2,1))
plot(ox,type='l',main='Original Time Series',xlab='time',ylab='value')
if (par8=='') {
mytitle <- paste('Working Time Series (lambda=',par2,', d=',par3,', D=',par4,')',sep='')
mysub <- paste('(lambda=',par2,', d=',par3,', D=',par4,', CI=', par7, ', CI type=',par6,')',sep='')
} else {
mytitle <- paste('Working Time Series (base=',par8,', d=',par3,', D=',par4,')',sep='')
mysub <- paste('(base=',par8,', d=',par3,', D=',par4,', CI=', par7, ', CI type=',par6,')',sep='')
}
plot(x,type='l', main=mytitle,xlab='time',ylab='value')
par(op)
dev.off()
bitmap(file='pic1.png')
racf <- acf(x, par1, main='Autocorrelation', xlab='time lag', ylab='ACF', ci.type=par6, ci=par7, sub=mysub)
dev.off()
bitmap(file='pic2.png')
rpacf <- pacf(x,par1,main='Partial Autocorrelation',xlab='lags',ylab='PACF',sub=mysub)
dev.off()
(myacf <- c(racf$acf))
(mypacf <- c(rpacf$acf))
lengthx <- length(x)
sqrtn <- sqrt(lengthx)
load(file='createtable')
a<-table.start()
a<-table.row.start(a)
a<-table.element(a,'Autocorrelation Function',4,TRUE)
a<-table.row.end(a)
a<-table.row.start(a)
a<-table.element(a,'Time lag k',header=TRUE)
a<-table.element(a,'ACF(k)',header=TRUE)
a<-table.element(a,'T-STAT',header=TRUE)
a<-table.element(a,'P-value',header=TRUE)
a<-table.row.end(a)
for (i in 2:(par1+1)) {
a<-table.row.start(a)
a<-table.element(a,i-1,header=TRUE)
a<-table.element(a,round(myacf[i],6))
mytstat <- myacf[i]*sqrtn
a<-table.element(a,round(mytstat,4))
a<-table.element(a,round(1-pt(abs(mytstat),lengthx),6))
a<-table.row.end(a)
}
a<-table.end(a)
table.save(a,file='mytable.tab')
a<-table.start()
a<-table.row.start(a)
a<-table.element(a,'Partial Autocorrelation Function',4,TRUE)
a<-table.row.end(a)
a<-table.row.start(a)
a<-table.element(a,'Time lag k',header=TRUE)
a<-table.element(a,'PACF(k)',header=TRUE)
a<-table.element(a,'T-STAT',header=TRUE)
a<-table.element(a,'P-value',header=TRUE)
a<-table.row.end(a)
for (i in 1:par1) {
a<-table.row.start(a)
a<-table.element(a,i,header=TRUE)
a<-table.element(a,round(mypacf[i],6))
mytstat <- mypacf[i]*sqrtn
a<-table.element(a,round(mytstat,4))
a<-table.element(a,round(1-pt(abs(mytstat),lengthx),6))
a<-table.row.end(a)
}
a<-table.end(a)
table.save(a,file='mytable1.tab')