Free Statistics

of Irreproducible Research!

Author's title

Author*The author of this computation has been verified*
R Software Modulerwasp_autocorrelation.wasp
Title produced by software(Partial) Autocorrelation Function
Date of computationSun, 18 Dec 2016 14:05:35 +0100
Cite this page as followsStatistical Computations at FreeStatistics.org, Office for Research Development and Education, URL https://freestatistics.org/blog/index.php?v=date/2016/Dec/18/t1482066363yh3bc7jr2h26txz.htm/, Retrieved Thu, 09 May 2024 01:23:56 +0000
Statistical Computations at FreeStatistics.org, Office for Research Development and Education, URL https://freestatistics.org/blog/index.php?pk=301054, Retrieved Thu, 09 May 2024 01:23:56 +0000
QR Codes:

Original text written by user:
IsPrivate?No (this computation is public)
User-defined keywords
Estimated Impact93
Family? (F = Feedback message, R = changed R code, M = changed R Module, P = changed Parameters, D = changed Data)
-     [Exponential Smoothing] [] [2016-12-18 12:31:12] [683f400e1b95307fc738e729f07c4fce]
- RM D    [(Partial) Autocorrelation Function] [] [2016-12-18 13:05:35] [404ac5ee4f7301873f6a96ef36861981] [Current]
Feedback Forum

Post a new message
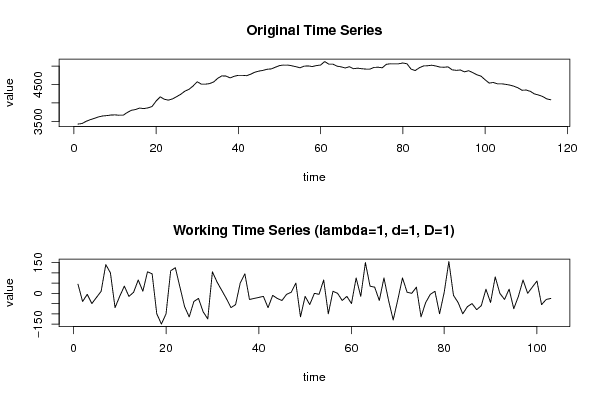
Dataseries X:
3425
3440
3500
3545
3580
3620
3645
3655
3670
3675
3665
3665
3740
3800
3820
3860
3845
3865
3900
4050
4165
4100
4075
4110
4170
4235
4320
4370
4460
4575
4510
4510
4525
4570
4670
4735
4730
4680
4725
4750
4750
4740
4780
4835
4865
4885
4915
4925
4970
5015
5030
5030
5010
4985
4955
5000
5005
4990
5015
5030
5125
5055
5055
5000
4980
4950
4985
4930
4945
4930
4920
4920
4965
4970
4955
5050
5065
5065
5065
5085
5065
4920
4880
4955
5005
5010
5025
5005
4975
4970
4980
4900
4885
4895
4845
4875
4825
4765
4730
4630
4540
4555
4520
4520
4505
4485
4455
4410
4345
4350
4315
4245
4215
4175
4110
4085


Summary of computational transaction
Raw Input view raw input (R code)
Raw Outputview raw output of R engine
Computing time1 seconds
R ServerBig Analytics Cloud Computing Center

\begin{tabular}{lllllllll}
\hline
Summary of computational transaction \tabularnewline
Raw Input view raw input (R code)  \tabularnewline
Raw Outputview raw output of R engine  \tabularnewline
Computing time1 seconds \tabularnewline
R ServerBig Analytics Cloud Computing Center \tabularnewline
\hline
\end{tabular}
%Source: https://freestatistics.org/blog/index.php?pk=301054&T=0

[TABLE]
[ROW]
Summary of computational transaction[/C][/ROW] [ROW]Raw Input[/C] view raw input (R code) [/C][/ROW] [ROW]Raw Output[/C]view raw output of R engine [/C][/ROW] [ROW]Computing time[/C]1 seconds[/C][/ROW] [ROW]R Server[/C]Big Analytics Cloud Computing Center[/C][/ROW] [/TABLE] Source: https://freestatistics.org/blog/index.php?pk=301054&T=0

Globally Unique Identifier (entire table): ba.freestatistics.org/blog/index.php?pk=301054&T=0

As an alternative you can also use a QR Code:  

The GUIDs for individual cells are displayed in the table below:

Summary of computational transaction
Raw Input view raw input (R code)
Raw Outputview raw output of R engine
Computing time1 seconds
R ServerBig Analytics Cloud Computing Center


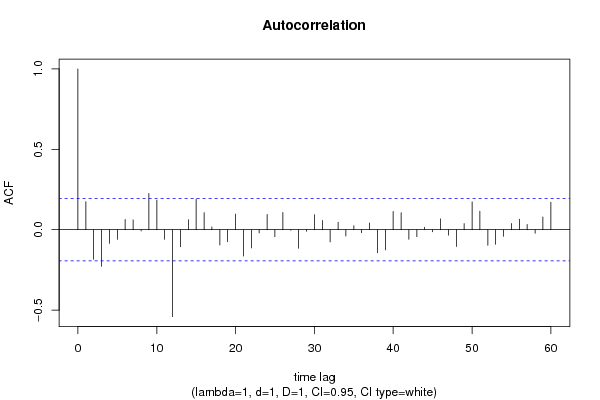
Autocorrelation Function
Time lag kACF(k)T-STATP-value
10.1742911.76890.039938
2-0.183388-1.86120.032785
3-0.227239-2.30620.011551
4-0.084806-0.86070.195705
5-0.060182-0.61080.271347
60.0634160.64360.260632
70.0611450.62050.268133
8-0.007229-0.07340.47083
90.2249442.28290.012244
100.1839631.8670.032371
11-0.059525-0.60410.273547
12-0.54063-5.48680
13-0.106241-1.07820.141725
140.0624610.63390.263773
150.190691.93530.027849
160.106211.07790.141795
170.0174450.1770.429911
18-0.094832-0.96240.169042
19-0.075324-0.76450.223172
200.0973020.98750.162855
21-0.163939-1.66380.049596
22-0.113026-1.14710.127001
23-0.019552-0.19840.421551
240.0948850.9630.168907
25-0.042899-0.43540.332098
260.1071171.08710.139761
27-0.003343-0.03390.486499
28-0.11494-1.16650.123051
29-0.009954-0.1010.459863
300.0929120.9430.173955
310.0572220.58070.281342
32-0.075675-0.7680.222118
330.046130.46820.320327
34-0.038687-0.39260.347701
350.0250.25370.400109
36-0.018491-0.18770.425756
370.0414880.42110.337296
38-0.143191-1.45320.0746
39-0.125501-1.27370.102819
400.1135971.15290.125814
410.1051481.06710.144203
42-0.059127-0.60010.274889
43-0.042985-0.43630.331783
440.0152010.15430.438849
45-0.012441-0.12630.449884
460.0674350.68440.247633
47-0.033619-0.34120.366825
48-0.104257-1.05810.146244
490.0380310.3860.350155
500.1732311.75810.04085
510.1147571.16470.123424
52-0.097001-0.98450.1636
53-0.090721-0.92070.179674
54-0.040222-0.40820.341985
550.0387750.39350.347372
560.065180.66150.254882
570.0320970.32570.372638
58-0.021746-0.22070.412883
590.0795340.80720.210709
600.1708871.73430.042927

\begin{tabular}{lllllllll}
\hline
Autocorrelation Function \tabularnewline
Time lag k & ACF(k) & T-STAT & P-value \tabularnewline
1 & 0.174291 & 1.7689 & 0.039938 \tabularnewline
2 & -0.183388 & -1.8612 & 0.032785 \tabularnewline
3 & -0.227239 & -2.3062 & 0.011551 \tabularnewline
4 & -0.084806 & -0.8607 & 0.195705 \tabularnewline
5 & -0.060182 & -0.6108 & 0.271347 \tabularnewline
6 & 0.063416 & 0.6436 & 0.260632 \tabularnewline
7 & 0.061145 & 0.6205 & 0.268133 \tabularnewline
8 & -0.007229 & -0.0734 & 0.47083 \tabularnewline
9 & 0.224944 & 2.2829 & 0.012244 \tabularnewline
10 & 0.183963 & 1.867 & 0.032371 \tabularnewline
11 & -0.059525 & -0.6041 & 0.273547 \tabularnewline
12 & -0.54063 & -5.4868 & 0 \tabularnewline
13 & -0.106241 & -1.0782 & 0.141725 \tabularnewline
14 & 0.062461 & 0.6339 & 0.263773 \tabularnewline
15 & 0.19069 & 1.9353 & 0.027849 \tabularnewline
16 & 0.10621 & 1.0779 & 0.141795 \tabularnewline
17 & 0.017445 & 0.177 & 0.429911 \tabularnewline
18 & -0.094832 & -0.9624 & 0.169042 \tabularnewline
19 & -0.075324 & -0.7645 & 0.223172 \tabularnewline
20 & 0.097302 & 0.9875 & 0.162855 \tabularnewline
21 & -0.163939 & -1.6638 & 0.049596 \tabularnewline
22 & -0.113026 & -1.1471 & 0.127001 \tabularnewline
23 & -0.019552 & -0.1984 & 0.421551 \tabularnewline
24 & 0.094885 & 0.963 & 0.168907 \tabularnewline
25 & -0.042899 & -0.4354 & 0.332098 \tabularnewline
26 & 0.107117 & 1.0871 & 0.139761 \tabularnewline
27 & -0.003343 & -0.0339 & 0.486499 \tabularnewline
28 & -0.11494 & -1.1665 & 0.123051 \tabularnewline
29 & -0.009954 & -0.101 & 0.459863 \tabularnewline
30 & 0.092912 & 0.943 & 0.173955 \tabularnewline
31 & 0.057222 & 0.5807 & 0.281342 \tabularnewline
32 & -0.075675 & -0.768 & 0.222118 \tabularnewline
33 & 0.04613 & 0.4682 & 0.320327 \tabularnewline
34 & -0.038687 & -0.3926 & 0.347701 \tabularnewline
35 & 0.025 & 0.2537 & 0.400109 \tabularnewline
36 & -0.018491 & -0.1877 & 0.425756 \tabularnewline
37 & 0.041488 & 0.4211 & 0.337296 \tabularnewline
38 & -0.143191 & -1.4532 & 0.0746 \tabularnewline
39 & -0.125501 & -1.2737 & 0.102819 \tabularnewline
40 & 0.113597 & 1.1529 & 0.125814 \tabularnewline
41 & 0.105148 & 1.0671 & 0.144203 \tabularnewline
42 & -0.059127 & -0.6001 & 0.274889 \tabularnewline
43 & -0.042985 & -0.4363 & 0.331783 \tabularnewline
44 & 0.015201 & 0.1543 & 0.438849 \tabularnewline
45 & -0.012441 & -0.1263 & 0.449884 \tabularnewline
46 & 0.067435 & 0.6844 & 0.247633 \tabularnewline
47 & -0.033619 & -0.3412 & 0.366825 \tabularnewline
48 & -0.104257 & -1.0581 & 0.146244 \tabularnewline
49 & 0.038031 & 0.386 & 0.350155 \tabularnewline
50 & 0.173231 & 1.7581 & 0.04085 \tabularnewline
51 & 0.114757 & 1.1647 & 0.123424 \tabularnewline
52 & -0.097001 & -0.9845 & 0.1636 \tabularnewline
53 & -0.090721 & -0.9207 & 0.179674 \tabularnewline
54 & -0.040222 & -0.4082 & 0.341985 \tabularnewline
55 & 0.038775 & 0.3935 & 0.347372 \tabularnewline
56 & 0.06518 & 0.6615 & 0.254882 \tabularnewline
57 & 0.032097 & 0.3257 & 0.372638 \tabularnewline
58 & -0.021746 & -0.2207 & 0.412883 \tabularnewline
59 & 0.079534 & 0.8072 & 0.210709 \tabularnewline
60 & 0.170887 & 1.7343 & 0.042927 \tabularnewline
\hline
\end{tabular}
%Source: https://freestatistics.org/blog/index.php?pk=301054&T=1

[TABLE]
[ROW][C]Autocorrelation Function[/C][/ROW]
[ROW][C]Time lag k[/C][C]ACF(k)[/C][C]T-STAT[/C][C]P-value[/C][/ROW]
[ROW][C]1[/C][C]0.174291[/C][C]1.7689[/C][C]0.039938[/C][/ROW]
[ROW][C]2[/C][C]-0.183388[/C][C]-1.8612[/C][C]0.032785[/C][/ROW]
[ROW][C]3[/C][C]-0.227239[/C][C]-2.3062[/C][C]0.011551[/C][/ROW]
[ROW][C]4[/C][C]-0.084806[/C][C]-0.8607[/C][C]0.195705[/C][/ROW]
[ROW][C]5[/C][C]-0.060182[/C][C]-0.6108[/C][C]0.271347[/C][/ROW]
[ROW][C]6[/C][C]0.063416[/C][C]0.6436[/C][C]0.260632[/C][/ROW]
[ROW][C]7[/C][C]0.061145[/C][C]0.6205[/C][C]0.268133[/C][/ROW]
[ROW][C]8[/C][C]-0.007229[/C][C]-0.0734[/C][C]0.47083[/C][/ROW]
[ROW][C]9[/C][C]0.224944[/C][C]2.2829[/C][C]0.012244[/C][/ROW]
[ROW][C]10[/C][C]0.183963[/C][C]1.867[/C][C]0.032371[/C][/ROW]
[ROW][C]11[/C][C]-0.059525[/C][C]-0.6041[/C][C]0.273547[/C][/ROW]
[ROW][C]12[/C][C]-0.54063[/C][C]-5.4868[/C][C]0[/C][/ROW]
[ROW][C]13[/C][C]-0.106241[/C][C]-1.0782[/C][C]0.141725[/C][/ROW]
[ROW][C]14[/C][C]0.062461[/C][C]0.6339[/C][C]0.263773[/C][/ROW]
[ROW][C]15[/C][C]0.19069[/C][C]1.9353[/C][C]0.027849[/C][/ROW]
[ROW][C]16[/C][C]0.10621[/C][C]1.0779[/C][C]0.141795[/C][/ROW]
[ROW][C]17[/C][C]0.017445[/C][C]0.177[/C][C]0.429911[/C][/ROW]
[ROW][C]18[/C][C]-0.094832[/C][C]-0.9624[/C][C]0.169042[/C][/ROW]
[ROW][C]19[/C][C]-0.075324[/C][C]-0.7645[/C][C]0.223172[/C][/ROW]
[ROW][C]20[/C][C]0.097302[/C][C]0.9875[/C][C]0.162855[/C][/ROW]
[ROW][C]21[/C][C]-0.163939[/C][C]-1.6638[/C][C]0.049596[/C][/ROW]
[ROW][C]22[/C][C]-0.113026[/C][C]-1.1471[/C][C]0.127001[/C][/ROW]
[ROW][C]23[/C][C]-0.019552[/C][C]-0.1984[/C][C]0.421551[/C][/ROW]
[ROW][C]24[/C][C]0.094885[/C][C]0.963[/C][C]0.168907[/C][/ROW]
[ROW][C]25[/C][C]-0.042899[/C][C]-0.4354[/C][C]0.332098[/C][/ROW]
[ROW][C]26[/C][C]0.107117[/C][C]1.0871[/C][C]0.139761[/C][/ROW]
[ROW][C]27[/C][C]-0.003343[/C][C]-0.0339[/C][C]0.486499[/C][/ROW]
[ROW][C]28[/C][C]-0.11494[/C][C]-1.1665[/C][C]0.123051[/C][/ROW]
[ROW][C]29[/C][C]-0.009954[/C][C]-0.101[/C][C]0.459863[/C][/ROW]
[ROW][C]30[/C][C]0.092912[/C][C]0.943[/C][C]0.173955[/C][/ROW]
[ROW][C]31[/C][C]0.057222[/C][C]0.5807[/C][C]0.281342[/C][/ROW]
[ROW][C]32[/C][C]-0.075675[/C][C]-0.768[/C][C]0.222118[/C][/ROW]
[ROW][C]33[/C][C]0.04613[/C][C]0.4682[/C][C]0.320327[/C][/ROW]
[ROW][C]34[/C][C]-0.038687[/C][C]-0.3926[/C][C]0.347701[/C][/ROW]
[ROW][C]35[/C][C]0.025[/C][C]0.2537[/C][C]0.400109[/C][/ROW]
[ROW][C]36[/C][C]-0.018491[/C][C]-0.1877[/C][C]0.425756[/C][/ROW]
[ROW][C]37[/C][C]0.041488[/C][C]0.4211[/C][C]0.337296[/C][/ROW]
[ROW][C]38[/C][C]-0.143191[/C][C]-1.4532[/C][C]0.0746[/C][/ROW]
[ROW][C]39[/C][C]-0.125501[/C][C]-1.2737[/C][C]0.102819[/C][/ROW]
[ROW][C]40[/C][C]0.113597[/C][C]1.1529[/C][C]0.125814[/C][/ROW]
[ROW][C]41[/C][C]0.105148[/C][C]1.0671[/C][C]0.144203[/C][/ROW]
[ROW][C]42[/C][C]-0.059127[/C][C]-0.6001[/C][C]0.274889[/C][/ROW]
[ROW][C]43[/C][C]-0.042985[/C][C]-0.4363[/C][C]0.331783[/C][/ROW]
[ROW][C]44[/C][C]0.015201[/C][C]0.1543[/C][C]0.438849[/C][/ROW]
[ROW][C]45[/C][C]-0.012441[/C][C]-0.1263[/C][C]0.449884[/C][/ROW]
[ROW][C]46[/C][C]0.067435[/C][C]0.6844[/C][C]0.247633[/C][/ROW]
[ROW][C]47[/C][C]-0.033619[/C][C]-0.3412[/C][C]0.366825[/C][/ROW]
[ROW][C]48[/C][C]-0.104257[/C][C]-1.0581[/C][C]0.146244[/C][/ROW]
[ROW][C]49[/C][C]0.038031[/C][C]0.386[/C][C]0.350155[/C][/ROW]
[ROW][C]50[/C][C]0.173231[/C][C]1.7581[/C][C]0.04085[/C][/ROW]
[ROW][C]51[/C][C]0.114757[/C][C]1.1647[/C][C]0.123424[/C][/ROW]
[ROW][C]52[/C][C]-0.097001[/C][C]-0.9845[/C][C]0.1636[/C][/ROW]
[ROW][C]53[/C][C]-0.090721[/C][C]-0.9207[/C][C]0.179674[/C][/ROW]
[ROW][C]54[/C][C]-0.040222[/C][C]-0.4082[/C][C]0.341985[/C][/ROW]
[ROW][C]55[/C][C]0.038775[/C][C]0.3935[/C][C]0.347372[/C][/ROW]
[ROW][C]56[/C][C]0.06518[/C][C]0.6615[/C][C]0.254882[/C][/ROW]
[ROW][C]57[/C][C]0.032097[/C][C]0.3257[/C][C]0.372638[/C][/ROW]
[ROW][C]58[/C][C]-0.021746[/C][C]-0.2207[/C][C]0.412883[/C][/ROW]
[ROW][C]59[/C][C]0.079534[/C][C]0.8072[/C][C]0.210709[/C][/ROW]
[ROW][C]60[/C][C]0.170887[/C][C]1.7343[/C][C]0.042927[/C][/ROW]
[/TABLE]
Source: https://freestatistics.org/blog/index.php?pk=301054&T=1

Globally Unique Identifier (entire table): ba.freestatistics.org/blog/index.php?pk=301054&T=1

As an alternative you can also use a QR Code:  

The GUIDs for individual cells are displayed in the table below:

Autocorrelation Function
Time lag kACF(k)T-STATP-value
10.1742911.76890.039938
2-0.183388-1.86120.032785
3-0.227239-2.30620.011551
4-0.084806-0.86070.195705
5-0.060182-0.61080.271347
60.0634160.64360.260632
70.0611450.62050.268133
8-0.007229-0.07340.47083
90.2249442.28290.012244
100.1839631.8670.032371
11-0.059525-0.60410.273547
12-0.54063-5.48680
13-0.106241-1.07820.141725
140.0624610.63390.263773
150.190691.93530.027849
160.106211.07790.141795
170.0174450.1770.429911
18-0.094832-0.96240.169042
19-0.075324-0.76450.223172
200.0973020.98750.162855
21-0.163939-1.66380.049596
22-0.113026-1.14710.127001
23-0.019552-0.19840.421551
240.0948850.9630.168907
25-0.042899-0.43540.332098
260.1071171.08710.139761
27-0.003343-0.03390.486499
28-0.11494-1.16650.123051
29-0.009954-0.1010.459863
300.0929120.9430.173955
310.0572220.58070.281342
32-0.075675-0.7680.222118
330.046130.46820.320327
34-0.038687-0.39260.347701
350.0250.25370.400109
36-0.018491-0.18770.425756
370.0414880.42110.337296
38-0.143191-1.45320.0746
39-0.125501-1.27370.102819
400.1135971.15290.125814
410.1051481.06710.144203
42-0.059127-0.60010.274889
43-0.042985-0.43630.331783
440.0152010.15430.438849
45-0.012441-0.12630.449884
460.0674350.68440.247633
47-0.033619-0.34120.366825
48-0.104257-1.05810.146244
490.0380310.3860.350155
500.1732311.75810.04085
510.1147571.16470.123424
52-0.097001-0.98450.1636
53-0.090721-0.92070.179674
54-0.040222-0.40820.341985
550.0387750.39350.347372
560.065180.66150.254882
570.0320970.32570.372638
58-0.021746-0.22070.412883
590.0795340.80720.210709
600.1708871.73430.042927


Partial Autocorrelation Function
Time lag kPACF(k)T-STATP-value
10.1742911.76890.039938
2-0.220463-2.23750.013705
3-0.16239-1.64810.051192
4-0.05611-0.56950.285144
5-0.121462-1.23270.110246
60.0333680.33860.367783
7-0.013845-0.14050.444264
8-0.042148-0.42780.334862
90.2831022.87320.002468
100.1221751.23990.108908
11-0.014016-0.14220.443581
12-0.461417-4.68294e-06
130.1266761.28560.10073
14-0.083847-0.8510.198385
150.0545160.55330.290637
16-0.034586-0.3510.36315
17-0.026033-0.26420.396073
18-0.014482-0.1470.441721
19-0.068246-0.69260.245053
200.1139291.15630.125126
21-0.089241-0.90570.183606
220.0620910.63020.264993
23-0.071007-0.72060.236382
24-0.301254-3.05740.001422
25-0.056097-0.56930.28519
260.1008891.02390.154138
270.0977990.99260.161627
28-0.097352-0.9880.162729
290.0158710.16110.436177
300.0953990.96820.167607
310.0261940.26580.395447
320.0654360.66410.254053
33-0.073508-0.7460.228676
340.0156660.1590.436991
35-0.027435-0.27840.390617
36-0.24453-2.48170.007346
37-0.035975-0.36510.357891
38-0.061566-0.62480.266732
39-0.063699-0.64650.259706
400.0321830.32660.37231
410.0475720.48280.315131
42-0.05445-0.55260.290865
430.0718980.72970.233618
440.0223960.22730.410324
450.0345750.35090.363191
46-0.065868-0.66850.25266
47-0.040457-0.41060.341112
48-0.191023-1.93870.027639
490.1403481.42440.07868
500.012190.12370.450891
510.0686510.69670.243772
52-0.004222-0.04280.482953
530.0752780.7640.223309
54-0.001389-0.01410.494388
550.0218220.22150.412584
560.0443140.44970.326921
57-0.015369-0.1560.438179
58-0.02642-0.26810.394567
590.0290390.29470.384404
60-0.067841-0.68850.24634

\begin{tabular}{lllllllll}
\hline
Partial Autocorrelation Function \tabularnewline
Time lag k & PACF(k) & T-STAT & P-value \tabularnewline
1 & 0.174291 & 1.7689 & 0.039938 \tabularnewline
2 & -0.220463 & -2.2375 & 0.013705 \tabularnewline
3 & -0.16239 & -1.6481 & 0.051192 \tabularnewline
4 & -0.05611 & -0.5695 & 0.285144 \tabularnewline
5 & -0.121462 & -1.2327 & 0.110246 \tabularnewline
6 & 0.033368 & 0.3386 & 0.367783 \tabularnewline
7 & -0.013845 & -0.1405 & 0.444264 \tabularnewline
8 & -0.042148 & -0.4278 & 0.334862 \tabularnewline
9 & 0.283102 & 2.8732 & 0.002468 \tabularnewline
10 & 0.122175 & 1.2399 & 0.108908 \tabularnewline
11 & -0.014016 & -0.1422 & 0.443581 \tabularnewline
12 & -0.461417 & -4.6829 & 4e-06 \tabularnewline
13 & 0.126676 & 1.2856 & 0.10073 \tabularnewline
14 & -0.083847 & -0.851 & 0.198385 \tabularnewline
15 & 0.054516 & 0.5533 & 0.290637 \tabularnewline
16 & -0.034586 & -0.351 & 0.36315 \tabularnewline
17 & -0.026033 & -0.2642 & 0.396073 \tabularnewline
18 & -0.014482 & -0.147 & 0.441721 \tabularnewline
19 & -0.068246 & -0.6926 & 0.245053 \tabularnewline
20 & 0.113929 & 1.1563 & 0.125126 \tabularnewline
21 & -0.089241 & -0.9057 & 0.183606 \tabularnewline
22 & 0.062091 & 0.6302 & 0.264993 \tabularnewline
23 & -0.071007 & -0.7206 & 0.236382 \tabularnewline
24 & -0.301254 & -3.0574 & 0.001422 \tabularnewline
25 & -0.056097 & -0.5693 & 0.28519 \tabularnewline
26 & 0.100889 & 1.0239 & 0.154138 \tabularnewline
27 & 0.097799 & 0.9926 & 0.161627 \tabularnewline
28 & -0.097352 & -0.988 & 0.162729 \tabularnewline
29 & 0.015871 & 0.1611 & 0.436177 \tabularnewline
30 & 0.095399 & 0.9682 & 0.167607 \tabularnewline
31 & 0.026194 & 0.2658 & 0.395447 \tabularnewline
32 & 0.065436 & 0.6641 & 0.254053 \tabularnewline
33 & -0.073508 & -0.746 & 0.228676 \tabularnewline
34 & 0.015666 & 0.159 & 0.436991 \tabularnewline
35 & -0.027435 & -0.2784 & 0.390617 \tabularnewline
36 & -0.24453 & -2.4817 & 0.007346 \tabularnewline
37 & -0.035975 & -0.3651 & 0.357891 \tabularnewline
38 & -0.061566 & -0.6248 & 0.266732 \tabularnewline
39 & -0.063699 & -0.6465 & 0.259706 \tabularnewline
40 & 0.032183 & 0.3266 & 0.37231 \tabularnewline
41 & 0.047572 & 0.4828 & 0.315131 \tabularnewline
42 & -0.05445 & -0.5526 & 0.290865 \tabularnewline
43 & 0.071898 & 0.7297 & 0.233618 \tabularnewline
44 & 0.022396 & 0.2273 & 0.410324 \tabularnewline
45 & 0.034575 & 0.3509 & 0.363191 \tabularnewline
46 & -0.065868 & -0.6685 & 0.25266 \tabularnewline
47 & -0.040457 & -0.4106 & 0.341112 \tabularnewline
48 & -0.191023 & -1.9387 & 0.027639 \tabularnewline
49 & 0.140348 & 1.4244 & 0.07868 \tabularnewline
50 & 0.01219 & 0.1237 & 0.450891 \tabularnewline
51 & 0.068651 & 0.6967 & 0.243772 \tabularnewline
52 & -0.004222 & -0.0428 & 0.482953 \tabularnewline
53 & 0.075278 & 0.764 & 0.223309 \tabularnewline
54 & -0.001389 & -0.0141 & 0.494388 \tabularnewline
55 & 0.021822 & 0.2215 & 0.412584 \tabularnewline
56 & 0.044314 & 0.4497 & 0.326921 \tabularnewline
57 & -0.015369 & -0.156 & 0.438179 \tabularnewline
58 & -0.02642 & -0.2681 & 0.394567 \tabularnewline
59 & 0.029039 & 0.2947 & 0.384404 \tabularnewline
60 & -0.067841 & -0.6885 & 0.24634 \tabularnewline
\hline
\end{tabular}
%Source: https://freestatistics.org/blog/index.php?pk=301054&T=2

[TABLE]
[ROW][C]Partial Autocorrelation Function[/C][/ROW]
[ROW][C]Time lag k[/C][C]PACF(k)[/C][C]T-STAT[/C][C]P-value[/C][/ROW]
[ROW][C]1[/C][C]0.174291[/C][C]1.7689[/C][C]0.039938[/C][/ROW]
[ROW][C]2[/C][C]-0.220463[/C][C]-2.2375[/C][C]0.013705[/C][/ROW]
[ROW][C]3[/C][C]-0.16239[/C][C]-1.6481[/C][C]0.051192[/C][/ROW]
[ROW][C]4[/C][C]-0.05611[/C][C]-0.5695[/C][C]0.285144[/C][/ROW]
[ROW][C]5[/C][C]-0.121462[/C][C]-1.2327[/C][C]0.110246[/C][/ROW]
[ROW][C]6[/C][C]0.033368[/C][C]0.3386[/C][C]0.367783[/C][/ROW]
[ROW][C]7[/C][C]-0.013845[/C][C]-0.1405[/C][C]0.444264[/C][/ROW]
[ROW][C]8[/C][C]-0.042148[/C][C]-0.4278[/C][C]0.334862[/C][/ROW]
[ROW][C]9[/C][C]0.283102[/C][C]2.8732[/C][C]0.002468[/C][/ROW]
[ROW][C]10[/C][C]0.122175[/C][C]1.2399[/C][C]0.108908[/C][/ROW]
[ROW][C]11[/C][C]-0.014016[/C][C]-0.1422[/C][C]0.443581[/C][/ROW]
[ROW][C]12[/C][C]-0.461417[/C][C]-4.6829[/C][C]4e-06[/C][/ROW]
[ROW][C]13[/C][C]0.126676[/C][C]1.2856[/C][C]0.10073[/C][/ROW]
[ROW][C]14[/C][C]-0.083847[/C][C]-0.851[/C][C]0.198385[/C][/ROW]
[ROW][C]15[/C][C]0.054516[/C][C]0.5533[/C][C]0.290637[/C][/ROW]
[ROW][C]16[/C][C]-0.034586[/C][C]-0.351[/C][C]0.36315[/C][/ROW]
[ROW][C]17[/C][C]-0.026033[/C][C]-0.2642[/C][C]0.396073[/C][/ROW]
[ROW][C]18[/C][C]-0.014482[/C][C]-0.147[/C][C]0.441721[/C][/ROW]
[ROW][C]19[/C][C]-0.068246[/C][C]-0.6926[/C][C]0.245053[/C][/ROW]
[ROW][C]20[/C][C]0.113929[/C][C]1.1563[/C][C]0.125126[/C][/ROW]
[ROW][C]21[/C][C]-0.089241[/C][C]-0.9057[/C][C]0.183606[/C][/ROW]
[ROW][C]22[/C][C]0.062091[/C][C]0.6302[/C][C]0.264993[/C][/ROW]
[ROW][C]23[/C][C]-0.071007[/C][C]-0.7206[/C][C]0.236382[/C][/ROW]
[ROW][C]24[/C][C]-0.301254[/C][C]-3.0574[/C][C]0.001422[/C][/ROW]
[ROW][C]25[/C][C]-0.056097[/C][C]-0.5693[/C][C]0.28519[/C][/ROW]
[ROW][C]26[/C][C]0.100889[/C][C]1.0239[/C][C]0.154138[/C][/ROW]
[ROW][C]27[/C][C]0.097799[/C][C]0.9926[/C][C]0.161627[/C][/ROW]
[ROW][C]28[/C][C]-0.097352[/C][C]-0.988[/C][C]0.162729[/C][/ROW]
[ROW][C]29[/C][C]0.015871[/C][C]0.1611[/C][C]0.436177[/C][/ROW]
[ROW][C]30[/C][C]0.095399[/C][C]0.9682[/C][C]0.167607[/C][/ROW]
[ROW][C]31[/C][C]0.026194[/C][C]0.2658[/C][C]0.395447[/C][/ROW]
[ROW][C]32[/C][C]0.065436[/C][C]0.6641[/C][C]0.254053[/C][/ROW]
[ROW][C]33[/C][C]-0.073508[/C][C]-0.746[/C][C]0.228676[/C][/ROW]
[ROW][C]34[/C][C]0.015666[/C][C]0.159[/C][C]0.436991[/C][/ROW]
[ROW][C]35[/C][C]-0.027435[/C][C]-0.2784[/C][C]0.390617[/C][/ROW]
[ROW][C]36[/C][C]-0.24453[/C][C]-2.4817[/C][C]0.007346[/C][/ROW]
[ROW][C]37[/C][C]-0.035975[/C][C]-0.3651[/C][C]0.357891[/C][/ROW]
[ROW][C]38[/C][C]-0.061566[/C][C]-0.6248[/C][C]0.266732[/C][/ROW]
[ROW][C]39[/C][C]-0.063699[/C][C]-0.6465[/C][C]0.259706[/C][/ROW]
[ROW][C]40[/C][C]0.032183[/C][C]0.3266[/C][C]0.37231[/C][/ROW]
[ROW][C]41[/C][C]0.047572[/C][C]0.4828[/C][C]0.315131[/C][/ROW]
[ROW][C]42[/C][C]-0.05445[/C][C]-0.5526[/C][C]0.290865[/C][/ROW]
[ROW][C]43[/C][C]0.071898[/C][C]0.7297[/C][C]0.233618[/C][/ROW]
[ROW][C]44[/C][C]0.022396[/C][C]0.2273[/C][C]0.410324[/C][/ROW]
[ROW][C]45[/C][C]0.034575[/C][C]0.3509[/C][C]0.363191[/C][/ROW]
[ROW][C]46[/C][C]-0.065868[/C][C]-0.6685[/C][C]0.25266[/C][/ROW]
[ROW][C]47[/C][C]-0.040457[/C][C]-0.4106[/C][C]0.341112[/C][/ROW]
[ROW][C]48[/C][C]-0.191023[/C][C]-1.9387[/C][C]0.027639[/C][/ROW]
[ROW][C]49[/C][C]0.140348[/C][C]1.4244[/C][C]0.07868[/C][/ROW]
[ROW][C]50[/C][C]0.01219[/C][C]0.1237[/C][C]0.450891[/C][/ROW]
[ROW][C]51[/C][C]0.068651[/C][C]0.6967[/C][C]0.243772[/C][/ROW]
[ROW][C]52[/C][C]-0.004222[/C][C]-0.0428[/C][C]0.482953[/C][/ROW]
[ROW][C]53[/C][C]0.075278[/C][C]0.764[/C][C]0.223309[/C][/ROW]
[ROW][C]54[/C][C]-0.001389[/C][C]-0.0141[/C][C]0.494388[/C][/ROW]
[ROW][C]55[/C][C]0.021822[/C][C]0.2215[/C][C]0.412584[/C][/ROW]
[ROW][C]56[/C][C]0.044314[/C][C]0.4497[/C][C]0.326921[/C][/ROW]
[ROW][C]57[/C][C]-0.015369[/C][C]-0.156[/C][C]0.438179[/C][/ROW]
[ROW][C]58[/C][C]-0.02642[/C][C]-0.2681[/C][C]0.394567[/C][/ROW]
[ROW][C]59[/C][C]0.029039[/C][C]0.2947[/C][C]0.384404[/C][/ROW]
[ROW][C]60[/C][C]-0.067841[/C][C]-0.6885[/C][C]0.24634[/C][/ROW]
[/TABLE]
Source: https://freestatistics.org/blog/index.php?pk=301054&T=2

Globally Unique Identifier (entire table): ba.freestatistics.org/blog/index.php?pk=301054&T=2

As an alternative you can also use a QR Code:  

The GUIDs for individual cells are displayed in the table below:

Partial Autocorrelation Function
Time lag kPACF(k)T-STATP-value
10.1742911.76890.039938
2-0.220463-2.23750.013705
3-0.16239-1.64810.051192
4-0.05611-0.56950.285144
5-0.121462-1.23270.110246
60.0333680.33860.367783
7-0.013845-0.14050.444264
8-0.042148-0.42780.334862
90.2831022.87320.002468
100.1221751.23990.108908
11-0.014016-0.14220.443581
12-0.461417-4.68294e-06
130.1266761.28560.10073
14-0.083847-0.8510.198385
150.0545160.55330.290637
16-0.034586-0.3510.36315
17-0.026033-0.26420.396073
18-0.014482-0.1470.441721
19-0.068246-0.69260.245053
200.1139291.15630.125126
21-0.089241-0.90570.183606
220.0620910.63020.264993
23-0.071007-0.72060.236382
24-0.301254-3.05740.001422
25-0.056097-0.56930.28519
260.1008891.02390.154138
270.0977990.99260.161627
28-0.097352-0.9880.162729
290.0158710.16110.436177
300.0953990.96820.167607
310.0261940.26580.395447
320.0654360.66410.254053
33-0.073508-0.7460.228676
340.0156660.1590.436991
35-0.027435-0.27840.390617
36-0.24453-2.48170.007346
37-0.035975-0.36510.357891
38-0.061566-0.62480.266732
39-0.063699-0.64650.259706
400.0321830.32660.37231
410.0475720.48280.315131
42-0.05445-0.55260.290865
430.0718980.72970.233618
440.0223960.22730.410324
450.0345750.35090.363191
46-0.065868-0.66850.25266
47-0.040457-0.41060.341112
48-0.191023-1.93870.027639
490.1403481.42440.07868
500.012190.12370.450891
510.0686510.69670.243772
52-0.004222-0.04280.482953
530.0752780.7640.223309
54-0.001389-0.01410.494388
550.0218220.22150.412584
560.0443140.44970.326921
57-0.015369-0.1560.438179
58-0.02642-0.26810.394567
590.0290390.29470.384404
60-0.067841-0.68850.24634


Parameters (Session):
par1 = 12 ; par2 = Double ; par3 = additive ; par4 = 12 ;
Parameters (R input):
par1 = 60 ; par2 = 1 ; par3 = 1 ; par4 = 1 ; par5 = 12 ; par6 = White Noise ; par7 = 0.95 ; par8 = ;
R code (references can be found in the software module):
par8 <- ''
par7 <- '0.95'
par6 <- 'White Noise'
par5 <- '12'
par4 <- '0'
par3 <- '2'
par2 <- '1'
par1 <- '60'
if (par1 == 'Default') {
par1 = 10*log10(length(x))
} else {
par1 <- as.numeric(par1)
}
par2 <- as.numeric(par2)
par3 <- as.numeric(par3)
par4 <- as.numeric(par4)
par5 <- as.numeric(par5)
if (par6 == 'White Noise') par6 <- 'white' else par6 <- 'ma'
par7 <- as.numeric(par7)
if (par8 != '') par8 <- as.numeric(par8)
x <- na.omit(x)
ox <- x
if (par8 == '') {
if (par2 == 0) {
x <- log(x)
} else {
x <- (x ^ par2 - 1) / par2
}
} else {
x <- log(x,base=par8)
}
if (par3 > 0) x <- diff(x,lag=1,difference=par3)
if (par4 > 0) x <- diff(x,lag=par5,difference=par4)
bitmap(file='picts.png')
op <- par(mfrow=c(2,1))
plot(ox,type='l',main='Original Time Series',xlab='time',ylab='value')
if (par8=='') {
mytitle <- paste('Working Time Series (lambda=',par2,', d=',par3,', D=',par4,')',sep='')
mysub <- paste('(lambda=',par2,', d=',par3,', D=',par4,', CI=', par7, ', CI type=',par6,')',sep='')
} else {
mytitle <- paste('Working Time Series (base=',par8,', d=',par3,', D=',par4,')',sep='')
mysub <- paste('(base=',par8,', d=',par3,', D=',par4,', CI=', par7, ', CI type=',par6,')',sep='')
}
plot(x,type='l', main=mytitle,xlab='time',ylab='value')
par(op)
dev.off()
bitmap(file='pic1.png')
racf <- acf(x, par1, main='Autocorrelation', xlab='time lag', ylab='ACF', ci.type=par6, ci=par7, sub=mysub)
dev.off()
bitmap(file='pic2.png')
rpacf <- pacf(x,par1,main='Partial Autocorrelation',xlab='lags',ylab='PACF',sub=mysub)
dev.off()
(myacf <- c(racf$acf))
(mypacf <- c(rpacf$acf))
lengthx <- length(x)
sqrtn <- sqrt(lengthx)
load(file='createtable')
a<-table.start()
a<-table.row.start(a)
a<-table.element(a,'Autocorrelation Function',4,TRUE)
a<-table.row.end(a)
a<-table.row.start(a)
a<-table.element(a,'Time lag k',header=TRUE)
a<-table.element(a,'ACF(k)',header=TRUE)
a<-table.element(a,'T-STAT',header=TRUE)
a<-table.element(a,'P-value',header=TRUE)
a<-table.row.end(a)
for (i in 2:(par1+1)) {
a<-table.row.start(a)
a<-table.element(a,i-1,header=TRUE)
a<-table.element(a,round(myacf[i],6))
mytstat <- myacf[i]*sqrtn
a<-table.element(a,round(mytstat,4))
a<-table.element(a,round(1-pt(abs(mytstat),lengthx),6))
a<-table.row.end(a)
}
a<-table.end(a)
table.save(a,file='mytable.tab')
a<-table.start()
a<-table.row.start(a)
a<-table.element(a,'Partial Autocorrelation Function',4,TRUE)
a<-table.row.end(a)
a<-table.row.start(a)
a<-table.element(a,'Time lag k',header=TRUE)
a<-table.element(a,'PACF(k)',header=TRUE)
a<-table.element(a,'T-STAT',header=TRUE)
a<-table.element(a,'P-value',header=TRUE)
a<-table.row.end(a)
for (i in 1:par1) {
a<-table.row.start(a)
a<-table.element(a,i,header=TRUE)
a<-table.element(a,round(mypacf[i],6))
mytstat <- mypacf[i]*sqrtn
a<-table.element(a,round(mytstat,4))
a<-table.element(a,round(1-pt(abs(mytstat),lengthx),6))
a<-table.row.end(a)
}
a<-table.end(a)
table.save(a,file='mytable1.tab')