Free Statistics

of Irreproducible Research!

Author's title

Author*The author of this computation has been verified*
R Software Modulerwasp_structuraltimeseries.wasp
Title produced by softwareStructural Time Series Models
Date of computationSun, 18 Dec 2016 14:34:34 +0100
Cite this page as followsStatistical Computations at FreeStatistics.org, Office for Research Development and Education, URL https://freestatistics.org/blog/index.php?v=date/2016/Dec/18/t1482068122qjvs76ez7xgoytg.htm/, Retrieved Wed, 08 May 2024 19:57:14 +0000
Statistical Computations at FreeStatistics.org, Office for Research Development and Education, URL https://freestatistics.org/blog/index.php?pk=301079, Retrieved Wed, 08 May 2024 19:57:14 +0000
QR Codes:

Original text written by user:
IsPrivate?No (this computation is public)
User-defined keywords
Estimated Impact63
Family? (F = Feedback message, R = changed R code, M = changed R Module, P = changed Parameters, D = changed Data)
-       [Structural Time Series Models] [] [2016-12-18 13:34:34] [94ac3c9a028ddd47e8862e80eac9f626] [Current]
Feedback Forum

Post a new message
Dataseries X:
295
520
550
610
775
885
965
475
875
1330
1635
920
1700
1465
1190
1390
1580
1775
1975
2440
2160
2670
3340
3230
2175
2035
3520
3945
2920
2495
2630
3610
5020
5755
7040
5345
4260
4785
3735
2980
2910


Summary of computational transaction
Raw Input view raw input (R code)
Raw Outputview raw output of R engine
Computing time3 seconds
R ServerBig Analytics Cloud Computing Center

\begin{tabular}{lllllllll}
\hline
Summary of computational transaction \tabularnewline
Raw Input view raw input (R code)  \tabularnewline
Raw Outputview raw output of R engine  \tabularnewline
Computing time3 seconds \tabularnewline
R ServerBig Analytics Cloud Computing Center \tabularnewline
\hline
\end{tabular}
%Source: https://freestatistics.org/blog/index.php?pk=301079&T=0

[TABLE]
[ROW]
Summary of computational transaction[/C][/ROW] [ROW]Raw Input[/C] view raw input (R code) [/C][/ROW] [ROW]Raw Output[/C]view raw output of R engine [/C][/ROW] [ROW]Computing time[/C]3 seconds[/C][/ROW] [ROW]R Server[/C]Big Analytics Cloud Computing Center[/C][/ROW] [/TABLE] Source: https://freestatistics.org/blog/index.php?pk=301079&T=0

Globally Unique Identifier (entire table): ba.freestatistics.org/blog/index.php?pk=301079&T=0

As an alternative you can also use a QR Code:  

The GUIDs for individual cells are displayed in the table below:

Summary of computational transaction
Raw Input view raw input (R code)
Raw Outputview raw output of R engine
Computing time3 seconds
R ServerBig Analytics Cloud Computing Center


Structural Time Series Model -- Interpolation
tObservedLevelSlopeSeasonalStand. Residuals
1295295000
2520508.30000086218111.699999164053511.69999913781880.187530996913203
3550538.2270924752211.772907524780411.77290752478040.0267425156997851
4610598.0357151392511.9642848607511.964284860750.0704767188799237
5775762.43083093729712.569169062703412.56916906270340.223640684963173
6885872.04724501879712.952754981203212.95275498120330.142382893797077
7965951.78431466670613.215685333293713.21568533329370.0979818673463759
8475463.75000078463911.249999215361511.2499992153615-0.735397728104008
9875862.23735498439212.762645015608112.76264501560810.568122292032289
1013301315.5232568415614.476743158443814.47674315844390.646294022401589
1116351619.4015455114215.598454488578815.59845448857880.424579363463054
12920907.21153935193412.788460648066212.7884606480661-1.06772635781263
1317001548.28084733924-13.7926501958505151.7191526607581.11364721748327
1414651480.1090908437-15.1090903422058-15.1090908436951-0.0678765284244404
1511901205.58076162635-15.5807616263519-15.5807616263518-0.380202214596081
1613901405.19021678562-15.1902167856216-15.19021678562160.315380087275315
1715801594.81916758541-14.8191675854067-14.81916758540670.300179914848317
1817751789.44043264257-14.4404326425713-14.44043264257130.306952270067887
1919751989.05405350167-14.0540535016683-14.05405350166830.313713401805026
2024402453.19244552964-13.1924455296399-13.192445529640.700828285372924
2121602173.67145368541-13.6714536854129-13.6714536854128-0.390324603229245
2226702682.73297441883-12.7329744188302-12.73297441883020.766103426886015
2333403351.51162746968-11.5116274696808-11.51162746968080.998803558214028
2432303241.68749955581-11.6874995558108-11.687499555811-0.144083701849206
2521752256.73274377027.43024942682625-81.7327437701998-1.5715552734689
2620352031.188235266183.811764607941293.81176473381968-0.310087626933107
2735203514.447708945085.552291054923185.552291054923282.16756906178438
2839453938.955399445796.044600554212516.044600554212490.613819690347993
2929202915.16412695154.835873048498364.83587304849819-1.50883149406531
3024952490.667447627324.332552372678544.3325523726785-0.629022593065748
3126302625.514620208844.485379791158044.4853797911580.191219109987643
3236103604.375000367475.624999632526855.624999632526851.42757181248664
3350205012.736289809017.26371019099317.263710190993022.05516912941041
3457555746.888112346288.111887653717638.111887653717681.06497351132668
3570407030.401630314399.598369685606849.598369685606761.86860674564023
3653455337.383721369137.616278630865747.61627863086537-2.49452253471913
3742604467.2731857665218.8430166601133-207.273185766524-1.37265896261394
3847854762.991302586222.008694985540522.00869741380460.378725778337481
3937353713.9226764209321.077323579074521.0773235790746-1.56901672175956
4029802959.5963546290120.403645370992120.4036453709922-1.13588515216096
4129102889.6747619508920.325238049112220.3252380491121-0.13231696642468

\begin{tabular}{lllllllll}
\hline
Structural Time Series Model -- Interpolation \tabularnewline
t & Observed & Level & Slope & Seasonal & Stand. Residuals \tabularnewline
1 & 295 & 295 & 0 & 0 & 0 \tabularnewline
2 & 520 & 508.300000862181 & 11.6999991640535 & 11.6999991378188 & 0.187530996913203 \tabularnewline
3 & 550 & 538.22709247522 & 11.7729075247804 & 11.7729075247804 & 0.0267425156997851 \tabularnewline
4 & 610 & 598.03571513925 & 11.96428486075 & 11.96428486075 & 0.0704767188799237 \tabularnewline
5 & 775 & 762.430830937297 & 12.5691690627034 & 12.5691690627034 & 0.223640684963173 \tabularnewline
6 & 885 & 872.047245018797 & 12.9527549812032 & 12.9527549812033 & 0.142382893797077 \tabularnewline
7 & 965 & 951.784314666706 & 13.2156853332937 & 13.2156853332937 & 0.0979818673463759 \tabularnewline
8 & 475 & 463.750000784639 & 11.2499992153615 & 11.2499992153615 & -0.735397728104008 \tabularnewline
9 & 875 & 862.237354984392 & 12.7626450156081 & 12.7626450156081 & 0.568122292032289 \tabularnewline
10 & 1330 & 1315.52325684156 & 14.4767431584438 & 14.4767431584439 & 0.646294022401589 \tabularnewline
11 & 1635 & 1619.40154551142 & 15.5984544885788 & 15.5984544885788 & 0.424579363463054 \tabularnewline
12 & 920 & 907.211539351934 & 12.7884606480662 & 12.7884606480661 & -1.06772635781263 \tabularnewline
13 & 1700 & 1548.28084733924 & -13.7926501958505 & 151.719152660758 & 1.11364721748327 \tabularnewline
14 & 1465 & 1480.1090908437 & -15.1090903422058 & -15.1090908436951 & -0.0678765284244404 \tabularnewline
15 & 1190 & 1205.58076162635 & -15.5807616263519 & -15.5807616263518 & -0.380202214596081 \tabularnewline
16 & 1390 & 1405.19021678562 & -15.1902167856216 & -15.1902167856216 & 0.315380087275315 \tabularnewline
17 & 1580 & 1594.81916758541 & -14.8191675854067 & -14.8191675854067 & 0.300179914848317 \tabularnewline
18 & 1775 & 1789.44043264257 & -14.4404326425713 & -14.4404326425713 & 0.306952270067887 \tabularnewline
19 & 1975 & 1989.05405350167 & -14.0540535016683 & -14.0540535016683 & 0.313713401805026 \tabularnewline
20 & 2440 & 2453.19244552964 & -13.1924455296399 & -13.19244552964 & 0.700828285372924 \tabularnewline
21 & 2160 & 2173.67145368541 & -13.6714536854129 & -13.6714536854128 & -0.390324603229245 \tabularnewline
22 & 2670 & 2682.73297441883 & -12.7329744188302 & -12.7329744188302 & 0.766103426886015 \tabularnewline
23 & 3340 & 3351.51162746968 & -11.5116274696808 & -11.5116274696808 & 0.998803558214028 \tabularnewline
24 & 3230 & 3241.68749955581 & -11.6874995558108 & -11.687499555811 & -0.144083701849206 \tabularnewline
25 & 2175 & 2256.7327437702 & 7.43024942682625 & -81.7327437701998 & -1.5715552734689 \tabularnewline
26 & 2035 & 2031.18823526618 & 3.81176460794129 & 3.81176473381968 & -0.310087626933107 \tabularnewline
27 & 3520 & 3514.44770894508 & 5.55229105492318 & 5.55229105492328 & 2.16756906178438 \tabularnewline
28 & 3945 & 3938.95539944579 & 6.04460055421251 & 6.04460055421249 & 0.613819690347993 \tabularnewline
29 & 2920 & 2915.1641269515 & 4.83587304849836 & 4.83587304849819 & -1.50883149406531 \tabularnewline
30 & 2495 & 2490.66744762732 & 4.33255237267854 & 4.3325523726785 & -0.629022593065748 \tabularnewline
31 & 2630 & 2625.51462020884 & 4.48537979115804 & 4.485379791158 & 0.191219109987643 \tabularnewline
32 & 3610 & 3604.37500036747 & 5.62499963252685 & 5.62499963252685 & 1.42757181248664 \tabularnewline
33 & 5020 & 5012.73628980901 & 7.2637101909931 & 7.26371019099302 & 2.05516912941041 \tabularnewline
34 & 5755 & 5746.88811234628 & 8.11188765371763 & 8.11188765371768 & 1.06497351132668 \tabularnewline
35 & 7040 & 7030.40163031439 & 9.59836968560684 & 9.59836968560676 & 1.86860674564023 \tabularnewline
36 & 5345 & 5337.38372136913 & 7.61627863086574 & 7.61627863086537 & -2.49452253471913 \tabularnewline
37 & 4260 & 4467.27318576652 & 18.8430166601133 & -207.273185766524 & -1.37265896261394 \tabularnewline
38 & 4785 & 4762.9913025862 & 22.0086949855405 & 22.0086974138046 & 0.378725778337481 \tabularnewline
39 & 3735 & 3713.92267642093 & 21.0773235790745 & 21.0773235790746 & -1.56901672175956 \tabularnewline
40 & 2980 & 2959.59635462901 & 20.4036453709921 & 20.4036453709922 & -1.13588515216096 \tabularnewline
41 & 2910 & 2889.67476195089 & 20.3252380491122 & 20.3252380491121 & -0.13231696642468 \tabularnewline
\hline
\end{tabular}
%Source: https://freestatistics.org/blog/index.php?pk=301079&T=1

[TABLE]
[ROW][C]Structural Time Series Model -- Interpolation[/C][/ROW]
[ROW][C]t[/C][C]Observed[/C][C]Level[/C][C]Slope[/C][C]Seasonal[/C][C]Stand. Residuals[/C][/ROW]
[ROW][C]1[/C][C]295[/C][C]295[/C][C]0[/C][C]0[/C][C]0[/C][/ROW]
[ROW][C]2[/C][C]520[/C][C]508.300000862181[/C][C]11.6999991640535[/C][C]11.6999991378188[/C][C]0.187530996913203[/C][/ROW]
[ROW][C]3[/C][C]550[/C][C]538.22709247522[/C][C]11.7729075247804[/C][C]11.7729075247804[/C][C]0.0267425156997851[/C][/ROW]
[ROW][C]4[/C][C]610[/C][C]598.03571513925[/C][C]11.96428486075[/C][C]11.96428486075[/C][C]0.0704767188799237[/C][/ROW]
[ROW][C]5[/C][C]775[/C][C]762.430830937297[/C][C]12.5691690627034[/C][C]12.5691690627034[/C][C]0.223640684963173[/C][/ROW]
[ROW][C]6[/C][C]885[/C][C]872.047245018797[/C][C]12.9527549812032[/C][C]12.9527549812033[/C][C]0.142382893797077[/C][/ROW]
[ROW][C]7[/C][C]965[/C][C]951.784314666706[/C][C]13.2156853332937[/C][C]13.2156853332937[/C][C]0.0979818673463759[/C][/ROW]
[ROW][C]8[/C][C]475[/C][C]463.750000784639[/C][C]11.2499992153615[/C][C]11.2499992153615[/C][C]-0.735397728104008[/C][/ROW]
[ROW][C]9[/C][C]875[/C][C]862.237354984392[/C][C]12.7626450156081[/C][C]12.7626450156081[/C][C]0.568122292032289[/C][/ROW]
[ROW][C]10[/C][C]1330[/C][C]1315.52325684156[/C][C]14.4767431584438[/C][C]14.4767431584439[/C][C]0.646294022401589[/C][/ROW]
[ROW][C]11[/C][C]1635[/C][C]1619.40154551142[/C][C]15.5984544885788[/C][C]15.5984544885788[/C][C]0.424579363463054[/C][/ROW]
[ROW][C]12[/C][C]920[/C][C]907.211539351934[/C][C]12.7884606480662[/C][C]12.7884606480661[/C][C]-1.06772635781263[/C][/ROW]
[ROW][C]13[/C][C]1700[/C][C]1548.28084733924[/C][C]-13.7926501958505[/C][C]151.719152660758[/C][C]1.11364721748327[/C][/ROW]
[ROW][C]14[/C][C]1465[/C][C]1480.1090908437[/C][C]-15.1090903422058[/C][C]-15.1090908436951[/C][C]-0.0678765284244404[/C][/ROW]
[ROW][C]15[/C][C]1190[/C][C]1205.58076162635[/C][C]-15.5807616263519[/C][C]-15.5807616263518[/C][C]-0.380202214596081[/C][/ROW]
[ROW][C]16[/C][C]1390[/C][C]1405.19021678562[/C][C]-15.1902167856216[/C][C]-15.1902167856216[/C][C]0.315380087275315[/C][/ROW]
[ROW][C]17[/C][C]1580[/C][C]1594.81916758541[/C][C]-14.8191675854067[/C][C]-14.8191675854067[/C][C]0.300179914848317[/C][/ROW]
[ROW][C]18[/C][C]1775[/C][C]1789.44043264257[/C][C]-14.4404326425713[/C][C]-14.4404326425713[/C][C]0.306952270067887[/C][/ROW]
[ROW][C]19[/C][C]1975[/C][C]1989.05405350167[/C][C]-14.0540535016683[/C][C]-14.0540535016683[/C][C]0.313713401805026[/C][/ROW]
[ROW][C]20[/C][C]2440[/C][C]2453.19244552964[/C][C]-13.1924455296399[/C][C]-13.19244552964[/C][C]0.700828285372924[/C][/ROW]
[ROW][C]21[/C][C]2160[/C][C]2173.67145368541[/C][C]-13.6714536854129[/C][C]-13.6714536854128[/C][C]-0.390324603229245[/C][/ROW]
[ROW][C]22[/C][C]2670[/C][C]2682.73297441883[/C][C]-12.7329744188302[/C][C]-12.7329744188302[/C][C]0.766103426886015[/C][/ROW]
[ROW][C]23[/C][C]3340[/C][C]3351.51162746968[/C][C]-11.5116274696808[/C][C]-11.5116274696808[/C][C]0.998803558214028[/C][/ROW]
[ROW][C]24[/C][C]3230[/C][C]3241.68749955581[/C][C]-11.6874995558108[/C][C]-11.687499555811[/C][C]-0.144083701849206[/C][/ROW]
[ROW][C]25[/C][C]2175[/C][C]2256.7327437702[/C][C]7.43024942682625[/C][C]-81.7327437701998[/C][C]-1.5715552734689[/C][/ROW]
[ROW][C]26[/C][C]2035[/C][C]2031.18823526618[/C][C]3.81176460794129[/C][C]3.81176473381968[/C][C]-0.310087626933107[/C][/ROW]
[ROW][C]27[/C][C]3520[/C][C]3514.44770894508[/C][C]5.55229105492318[/C][C]5.55229105492328[/C][C]2.16756906178438[/C][/ROW]
[ROW][C]28[/C][C]3945[/C][C]3938.95539944579[/C][C]6.04460055421251[/C][C]6.04460055421249[/C][C]0.613819690347993[/C][/ROW]
[ROW][C]29[/C][C]2920[/C][C]2915.1641269515[/C][C]4.83587304849836[/C][C]4.83587304849819[/C][C]-1.50883149406531[/C][/ROW]
[ROW][C]30[/C][C]2495[/C][C]2490.66744762732[/C][C]4.33255237267854[/C][C]4.3325523726785[/C][C]-0.629022593065748[/C][/ROW]
[ROW][C]31[/C][C]2630[/C][C]2625.51462020884[/C][C]4.48537979115804[/C][C]4.485379791158[/C][C]0.191219109987643[/C][/ROW]
[ROW][C]32[/C][C]3610[/C][C]3604.37500036747[/C][C]5.62499963252685[/C][C]5.62499963252685[/C][C]1.42757181248664[/C][/ROW]
[ROW][C]33[/C][C]5020[/C][C]5012.73628980901[/C][C]7.2637101909931[/C][C]7.26371019099302[/C][C]2.05516912941041[/C][/ROW]
[ROW][C]34[/C][C]5755[/C][C]5746.88811234628[/C][C]8.11188765371763[/C][C]8.11188765371768[/C][C]1.06497351132668[/C][/ROW]
[ROW][C]35[/C][C]7040[/C][C]7030.40163031439[/C][C]9.59836968560684[/C][C]9.59836968560676[/C][C]1.86860674564023[/C][/ROW]
[ROW][C]36[/C][C]5345[/C][C]5337.38372136913[/C][C]7.61627863086574[/C][C]7.61627863086537[/C][C]-2.49452253471913[/C][/ROW]
[ROW][C]37[/C][C]4260[/C][C]4467.27318576652[/C][C]18.8430166601133[/C][C]-207.273185766524[/C][C]-1.37265896261394[/C][/ROW]
[ROW][C]38[/C][C]4785[/C][C]4762.9913025862[/C][C]22.0086949855405[/C][C]22.0086974138046[/C][C]0.378725778337481[/C][/ROW]
[ROW][C]39[/C][C]3735[/C][C]3713.92267642093[/C][C]21.0773235790745[/C][C]21.0773235790746[/C][C]-1.56901672175956[/C][/ROW]
[ROW][C]40[/C][C]2980[/C][C]2959.59635462901[/C][C]20.4036453709921[/C][C]20.4036453709922[/C][C]-1.13588515216096[/C][/ROW]
[ROW][C]41[/C][C]2910[/C][C]2889.67476195089[/C][C]20.3252380491122[/C][C]20.3252380491121[/C][C]-0.13231696642468[/C][/ROW]
[/TABLE]
Source: https://freestatistics.org/blog/index.php?pk=301079&T=1

Globally Unique Identifier (entire table): ba.freestatistics.org/blog/index.php?pk=301079&T=1

As an alternative you can also use a QR Code:  

The GUIDs for individual cells are displayed in the table below:

Structural Time Series Model -- Interpolation
tObservedLevelSlopeSeasonalStand. Residuals
1295295000
2520508.30000086218111.699999164053511.69999913781880.187530996913203
3550538.2270924752211.772907524780411.77290752478040.0267425156997851
4610598.0357151392511.9642848607511.964284860750.0704767188799237
5775762.43083093729712.569169062703412.56916906270340.223640684963173
6885872.04724501879712.952754981203212.95275498120330.142382893797077
7965951.78431466670613.215685333293713.21568533329370.0979818673463759
8475463.75000078463911.249999215361511.2499992153615-0.735397728104008
9875862.23735498439212.762645015608112.76264501560810.568122292032289
1013301315.5232568415614.476743158443814.47674315844390.646294022401589
1116351619.4015455114215.598454488578815.59845448857880.424579363463054
12920907.21153935193412.788460648066212.7884606480661-1.06772635781263
1317001548.28084733924-13.7926501958505151.7191526607581.11364721748327
1414651480.1090908437-15.1090903422058-15.1090908436951-0.0678765284244404
1511901205.58076162635-15.5807616263519-15.5807616263518-0.380202214596081
1613901405.19021678562-15.1902167856216-15.19021678562160.315380087275315
1715801594.81916758541-14.8191675854067-14.81916758540670.300179914848317
1817751789.44043264257-14.4404326425713-14.44043264257130.306952270067887
1919751989.05405350167-14.0540535016683-14.05405350166830.313713401805026
2024402453.19244552964-13.1924455296399-13.192445529640.700828285372924
2121602173.67145368541-13.6714536854129-13.6714536854128-0.390324603229245
2226702682.73297441883-12.7329744188302-12.73297441883020.766103426886015
2333403351.51162746968-11.5116274696808-11.51162746968080.998803558214028
2432303241.68749955581-11.6874995558108-11.687499555811-0.144083701849206
2521752256.73274377027.43024942682625-81.7327437701998-1.5715552734689
2620352031.188235266183.811764607941293.81176473381968-0.310087626933107
2735203514.447708945085.552291054923185.552291054923282.16756906178438
2839453938.955399445796.044600554212516.044600554212490.613819690347993
2929202915.16412695154.835873048498364.83587304849819-1.50883149406531
3024952490.667447627324.332552372678544.3325523726785-0.629022593065748
3126302625.514620208844.485379791158044.4853797911580.191219109987643
3236103604.375000367475.624999632526855.624999632526851.42757181248664
3350205012.736289809017.26371019099317.263710190993022.05516912941041
3457555746.888112346288.111887653717638.111887653717681.06497351132668
3570407030.401630314399.598369685606849.598369685606761.86860674564023
3653455337.383721369137.616278630865747.61627863086537-2.49452253471913
3742604467.2731857665218.8430166601133-207.273185766524-1.37265896261394
3847854762.991302586222.008694985540522.00869741380460.378725778337481
3937353713.9226764209321.077323579074521.0773235790746-1.56901672175956
4029802959.5963546290120.403645370992120.4036453709922-1.13588515216096
4129102889.6747619508920.325238049112220.3252380491121-0.13231696642468


Structural Time Series Model -- Extrapolation
tObservedLevelSeasonal
12242.367387692412811.16973511134-568.802347418927
21932.532702996962481.47907993378-548.946376936815
31815.765362283272151.78842475622-336.023062472949
41903.734535484641822.0977695786681.6367659059824
52061.444232977721492.40711440109569.037118576627
62418.897843686961162.716459223531256.18138446343
71196.10240721091833.025804045968363.076603164943
8371.886615261878503.335148868406-131.448533606528
980.5005128474212173.644493690844-93.1439808434225
10-247.33138102304-156.046161486719-91.2852195363215
11-630.360071734785-485.736816664281-144.623255070504
12-1171.08656806735-815.427471841843-355.659096225509

\begin{tabular}{lllllllll}
\hline
Structural Time Series Model -- Extrapolation \tabularnewline
t & Observed & Level & Seasonal \tabularnewline
1 & 2242.36738769241 & 2811.16973511134 & -568.802347418927 \tabularnewline
2 & 1932.53270299696 & 2481.47907993378 & -548.946376936815 \tabularnewline
3 & 1815.76536228327 & 2151.78842475622 & -336.023062472949 \tabularnewline
4 & 1903.73453548464 & 1822.09776957866 & 81.6367659059824 \tabularnewline
5 & 2061.44423297772 & 1492.40711440109 & 569.037118576627 \tabularnewline
6 & 2418.89784368696 & 1162.71645922353 & 1256.18138446343 \tabularnewline
7 & 1196.10240721091 & 833.025804045968 & 363.076603164943 \tabularnewline
8 & 371.886615261878 & 503.335148868406 & -131.448533606528 \tabularnewline
9 & 80.5005128474212 & 173.644493690844 & -93.1439808434225 \tabularnewline
10 & -247.33138102304 & -156.046161486719 & -91.2852195363215 \tabularnewline
11 & -630.360071734785 & -485.736816664281 & -144.623255070504 \tabularnewline
12 & -1171.08656806735 & -815.427471841843 & -355.659096225509 \tabularnewline
\hline
\end{tabular}
%Source: https://freestatistics.org/blog/index.php?pk=301079&T=2

[TABLE]
[ROW][C]Structural Time Series Model -- Extrapolation[/C][/ROW]
[ROW][C]t[/C][C]Observed[/C][C]Level[/C][C]Seasonal[/C][/ROW]
[ROW][C]1[/C][C]2242.36738769241[/C][C]2811.16973511134[/C][C]-568.802347418927[/C][/ROW]
[ROW][C]2[/C][C]1932.53270299696[/C][C]2481.47907993378[/C][C]-548.946376936815[/C][/ROW]
[ROW][C]3[/C][C]1815.76536228327[/C][C]2151.78842475622[/C][C]-336.023062472949[/C][/ROW]
[ROW][C]4[/C][C]1903.73453548464[/C][C]1822.09776957866[/C][C]81.6367659059824[/C][/ROW]
[ROW][C]5[/C][C]2061.44423297772[/C][C]1492.40711440109[/C][C]569.037118576627[/C][/ROW]
[ROW][C]6[/C][C]2418.89784368696[/C][C]1162.71645922353[/C][C]1256.18138446343[/C][/ROW]
[ROW][C]7[/C][C]1196.10240721091[/C][C]833.025804045968[/C][C]363.076603164943[/C][/ROW]
[ROW][C]8[/C][C]371.886615261878[/C][C]503.335148868406[/C][C]-131.448533606528[/C][/ROW]
[ROW][C]9[/C][C]80.5005128474212[/C][C]173.644493690844[/C][C]-93.1439808434225[/C][/ROW]
[ROW][C]10[/C][C]-247.33138102304[/C][C]-156.046161486719[/C][C]-91.2852195363215[/C][/ROW]
[ROW][C]11[/C][C]-630.360071734785[/C][C]-485.736816664281[/C][C]-144.623255070504[/C][/ROW]
[ROW][C]12[/C][C]-1171.08656806735[/C][C]-815.427471841843[/C][C]-355.659096225509[/C][/ROW]
[/TABLE]
Source: https://freestatistics.org/blog/index.php?pk=301079&T=2

Globally Unique Identifier (entire table): ba.freestatistics.org/blog/index.php?pk=301079&T=2

As an alternative you can also use a QR Code:  

The GUIDs for individual cells are displayed in the table below:

Structural Time Series Model -- Extrapolation
tObservedLevelSeasonal
12242.367387692412811.16973511134-568.802347418927
21932.532702996962481.47907993378-548.946376936815
31815.765362283272151.78842475622-336.023062472949
41903.734535484641822.0977695786681.6367659059824
52061.444232977721492.40711440109569.037118576627
62418.897843686961162.716459223531256.18138446343
71196.10240721091833.025804045968363.076603164943
8371.886615261878503.335148868406-131.448533606528
980.5005128474212173.644493690844-93.1439808434225
10-247.33138102304-156.046161486719-91.2852195363215
11-630.360071734785-485.736816664281-144.623255070504
12-1171.08656806735-815.427471841843-355.659096225509


Parameters (Session):
par1 = 1 ; par2 = 1 ; par3 = 0 ; par4 = 12 ;
Parameters (R input):
par1 = 12 ; par2 = 12 ; par3 = BFGS ;
R code (references can be found in the software module):
require('stsm')
require('stsm.class')
require('KFKSDS')
par1 <- as.numeric(par1)
par2 <- as.numeric(par2)
nx <- length(x)
x <- ts(x,frequency=par1)
m <- StructTS(x,type='BSM')
print(m$coef)
print(m$fitted)
print(m$resid)
mylevel <- as.numeric(m$fitted[,'level'])
myslope <- as.numeric(m$fitted[,'slope'])
myseas <- as.numeric(m$fitted[,'sea'])
myresid <- as.numeric(m$resid)
myfit <- mylevel+myseas
mm <- stsm.model(model = 'BSM', y = x, transPars = 'StructTS')
fit2 <- stsmFit(mm, stsm.method = 'maxlik.td.optim', method = par3, KF.args = list(P0cov = TRUE))
(fit2.comps <- tsSmooth(fit2, P0cov = FALSE)$states)
m2 <- set.pars(mm, pmax(fit2$par, .Machine$double.eps))
(ss <- char2numeric(m2))
(pred <- predict(ss, x, n.ahead = par2))
mylagmax <- nx/2
bitmap(file='test2.png')
op <- par(mfrow = c(2,2))
acf(as.numeric(x),lag.max = mylagmax,main='Observed')
acf(mylevel,na.action=na.pass,lag.max = mylagmax,main='Level')
acf(myseas,na.action=na.pass,lag.max = mylagmax,main='Seasonal')
acf(myresid,na.action=na.pass,lag.max = mylagmax,main='Standardized Residals')
par(op)
dev.off()
bitmap(file='test3.png')
op <- par(mfrow = c(2,2))
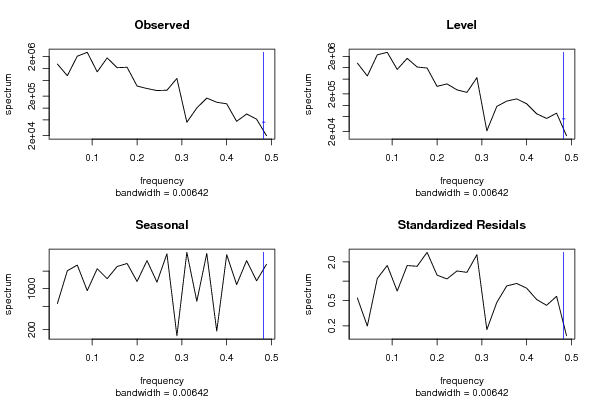
spectrum(as.numeric(x),main='Observed')
spectrum(mylevel,main='Level')
spectrum(myseas,main='Seasonal')
spectrum(myresid,main='Standardized Residals')
par(op)
dev.off()
bitmap(file='test4.png')
op <- par(mfrow = c(2,2))
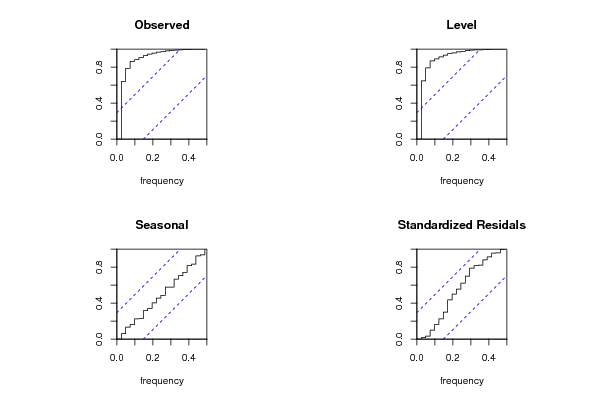
cpgram(as.numeric(x),main='Observed')
cpgram(mylevel,main='Level')
cpgram(myseas,main='Seasonal')
cpgram(myresid,main='Standardized Residals')
par(op)
dev.off()
bitmap(file='test1.png')
plot(as.numeric(m$resid),main='Standardized Residuals',ylab='Residuals',xlab='time',type='b')
grid()
dev.off()
bitmap(file='test5.png')
op <- par(mfrow = c(2,2))
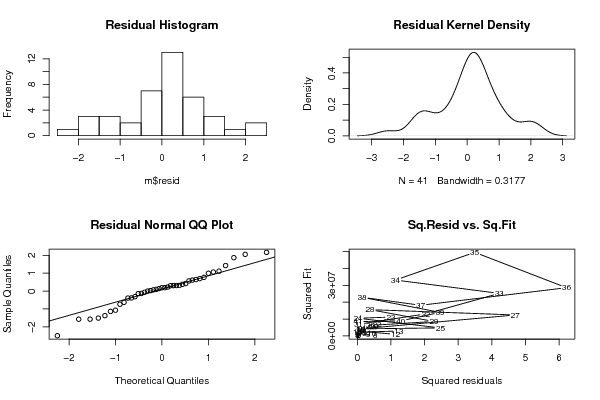
hist(m$resid,main='Residual Histogram')
plot(density(m$resid),main='Residual Kernel Density')
qqnorm(m$resid,main='Residual Normal QQ Plot')
qqline(m$resid)
plot(m$resid^2, myfit^2,main='Sq.Resid vs. Sq.Fit',xlab='Squared residuals',ylab='Squared Fit')
par(op)
dev.off()
bitmap(file='test6.png')
par(mfrow = c(3,1), mar = c(3,3,3,3))
plot(cbind(x, pred$pred), type = 'n', plot.type = 'single', ylab = '')
lines(x)
polygon(c(time(pred$pred), rev(time(pred$pred))), c(pred$pred + 2 * pred$se, rev(pred$pred)), col = 'gray85', border = NA)
polygon(c(time(pred$pred), rev(time(pred$pred))), c(pred$pred - 2 * pred$se, rev(pred$pred)), col = ' gray85', border = NA)
lines(pred$pred, col = 'blue', lwd = 1.5)
mtext(text = 'forecasts of the observed series', side = 3, adj = 0)
plot(cbind(x, pred$a[,1]), type = 'n', plot.type = 'single', ylab = '')
lines(x)
polygon(c(time(pred$a[,1]), rev(time(pred$a[,1]))), c(pred$a[,1] + 2 * sqrt(pred$P[,1]), rev(pred$a[,1])), col = 'gray85', border = NA)
polygon(c(time(pred$a[,1]), rev(time(pred$a[,1]))), c(pred$a[,1] - 2 * sqrt(pred$P[,1]), rev(pred$a[,1])), col = ' gray85', border = NA)
lines(pred$a[,1], col = 'blue', lwd = 1.5)
mtext(text = 'forecasts of the level component', side = 3, adj = 0)
plot(cbind(fit2.comps[,3], pred$a[,3]), type = 'n', plot.type = 'single', ylab = '')
lines(fit2.comps[,3])
polygon(c(time(pred$a[,3]), rev(time(pred$a[,3]))), c(pred$a[,3] + 2 * sqrt(pred$P[,3]), rev(pred$a[,3])), col = 'gray85', border = NA)
polygon(c(time(pred$a[,3]), rev(time(pred$a[,3]))), c(pred$a[,3] - 2 * sqrt(pred$P[,3]), rev(pred$a[,3])), col = ' gray85', border = NA)
lines(pred$a[,3], col = 'blue', lwd = 1.5)
mtext(text = 'forecasts of the seasonal component', side = 3, adj = 0)
dev.off()
load(file='createtable')
a<-table.start()
a<-table.row.start(a)
a<-table.element(a,'Structural Time Series Model -- Interpolation',6,TRUE)
a<-table.row.end(a)
a<-table.row.start(a)
a<-table.element(a,'t',header=TRUE)
a<-table.element(a,'Observed',header=TRUE)
a<-table.element(a,'Level',header=TRUE)
a<-table.element(a,'Slope',header=TRUE)
a<-table.element(a,'Seasonal',header=TRUE)
a<-table.element(a,'Stand. Residuals',header=TRUE)
a<-table.row.end(a)
for (i in 1:nx) {
a<-table.row.start(a)
a<-table.element(a,i,header=TRUE)
a<-table.element(a,x[i])
a<-table.element(a,mylevel[i])
a<-table.element(a,myslope[i])
a<-table.element(a,myseas[i])
a<-table.element(a,myresid[i])
a<-table.row.end(a)
}
a<-table.end(a)
table.save(a,file='mytable.tab')
a<-table.start()
a<-table.row.start(a)
a<-table.element(a,'Structural Time Series Model -- Extrapolation',4,TRUE)
a<-table.row.end(a)
a<-table.row.start(a)
a<-table.element(a,'t',header=TRUE)
a<-table.element(a,'Observed',header=TRUE)
a<-table.element(a,'Level',header=TRUE)
a<-table.element(a,'Seasonal',header=TRUE)
a<-table.row.end(a)
for (i in 1:par2) {
a<-table.row.start(a)
a<-table.element(a,i,header=TRUE)
a<-table.element(a,pred$pred[i])
a<-table.element(a,pred$a[i,1])
a<-table.element(a,pred$a[i,3])
a<-table.row.end(a)
}
a<-table.end(a)
table.save(a,file='mytable1.tab')