Free Statistics

of Irreproducible Research!

Author's title

Author*The author of this computation has been verified*
R Software Modulerwasp_exponentialsmoothing.wasp
Title produced by softwareExponential Smoothing
Date of computationSun, 18 Dec 2016 14:40:39 +0100
Cite this page as followsStatistical Computations at FreeStatistics.org, Office for Research Development and Education, URL https://freestatistics.org/blog/index.php?v=date/2016/Dec/18/t1482068448h01ded8jjiakfz7.htm/, Retrieved Thu, 09 May 2024 01:40:37 +0000
Statistical Computations at FreeStatistics.org, Office for Research Development and Education, URL https://freestatistics.org/blog/index.php?pk=301086, Retrieved Thu, 09 May 2024 01:40:37 +0000
QR Codes:

Original text written by user:
IsPrivate?No (this computation is public)
User-defined keywords
Estimated Impact91
Family? (F = Feedback message, R = changed R code, M = changed R Module, P = changed Parameters, D = changed Data)
-     [Exponential Smoothing] [] [2016-12-18 12:31:12] [683f400e1b95307fc738e729f07c4fce]
- R  D    [Exponential Smoothing] [] [2016-12-18 13:40:39] [404ac5ee4f7301873f6a96ef36861981] [Current]
Feedback Forum

Post a new message
Dataseries X:
2738
2955.5
3122
3275
3336
3340.5
3640
3820
3994
4387.5
4573
4513
4499.5
4504
4750
5000
5166


Summary of computational transaction
Raw Input view raw input (R code)
Raw Outputview raw output of R engine
Computing time1 seconds
R ServerBig Analytics Cloud Computing Center

\begin{tabular}{lllllllll}
\hline
Summary of computational transaction \tabularnewline
Raw Input view raw input (R code)  \tabularnewline
Raw Outputview raw output of R engine  \tabularnewline
Computing time1 seconds \tabularnewline
R ServerBig Analytics Cloud Computing Center \tabularnewline
\hline
\end{tabular}
%Source: https://freestatistics.org/blog/index.php?pk=301086&T=0

[TABLE]
[ROW]
Summary of computational transaction[/C][/ROW] [ROW]Raw Input[/C] view raw input (R code) [/C][/ROW] [ROW]Raw Output[/C]view raw output of R engine [/C][/ROW] [ROW]Computing time[/C]1 seconds[/C][/ROW] [ROW]R Server[/C]Big Analytics Cloud Computing Center[/C][/ROW] [/TABLE] Source: https://freestatistics.org/blog/index.php?pk=301086&T=0

Globally Unique Identifier (entire table): ba.freestatistics.org/blog/index.php?pk=301086&T=0

As an alternative you can also use a QR Code:  

The GUIDs for individual cells are displayed in the table below:

Summary of computational transaction
Raw Input view raw input (R code)
Raw Outputview raw output of R engine
Computing time1 seconds
R ServerBig Analytics Cloud Computing Center


Estimated Parameters of Exponential Smoothing
ParameterValue
alpha1
beta0.0956383284004276
gammaFALSE

\begin{tabular}{lllllllll}
\hline
Estimated Parameters of Exponential Smoothing \tabularnewline
Parameter & Value \tabularnewline
alpha & 1 \tabularnewline
beta & 0.0956383284004276 \tabularnewline
gamma & FALSE \tabularnewline
\hline
\end{tabular}
%Source: https://freestatistics.org/blog/index.php?pk=301086&T=1

[TABLE]
[ROW][C]Estimated Parameters of Exponential Smoothing[/C][/ROW]
[ROW][C]Parameter[/C][C]Value[/C][/ROW]
[ROW][C]alpha[/C][C]1[/C][/ROW]
[ROW][C]beta[/C][C]0.0956383284004276[/C][/ROW]
[ROW][C]gamma[/C][C]FALSE[/C][/ROW]
[/TABLE]
Source: https://freestatistics.org/blog/index.php?pk=301086&T=1

Globally Unique Identifier (entire table): ba.freestatistics.org/blog/index.php?pk=301086&T=1

As an alternative you can also use a QR Code:  

The GUIDs for individual cells are displayed in the table below:

Estimated Parameters of Exponential Smoothing
ParameterValue
alpha1
beta0.0956383284004276
gammaFALSE


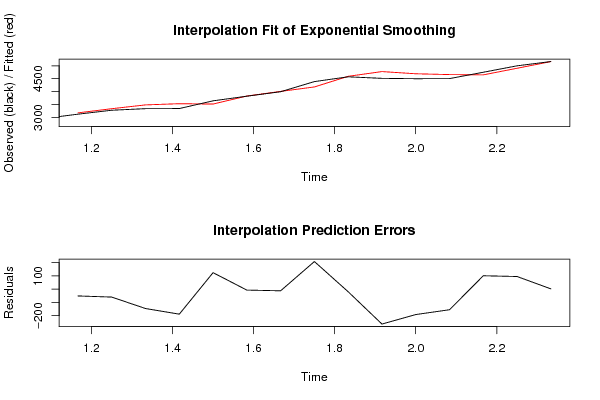
Interpolation Forecasts of Exponential Smoothing
tObservedFittedResiduals
331223173-51
432753334.62244525158-59.622445251578
533363481.92025425257-145.920254252571
63340.53528.96468505609-188.46468505609
736403515.44023761481124.559762385188
838203826.85292507529-6.85292507528629
939944006.19752277643-12.1975227764324
104387.54179.03097208747208.469027912532
1145734592.46860144029-19.4686014402851
1245134776.10665694224-263.106656942242
134499.54690.94357608126-191.443576081261
1445044659.13423248185-155.134232481849
1547504648.7974538096101.202546190398
1650004904.4762961571295.5237038428813
1751665163.612023515272.38797648473064

\begin{tabular}{lllllllll}
\hline
Interpolation Forecasts of Exponential Smoothing \tabularnewline
t & Observed & Fitted & Residuals \tabularnewline
3 & 3122 & 3173 & -51 \tabularnewline
4 & 3275 & 3334.62244525158 & -59.622445251578 \tabularnewline
5 & 3336 & 3481.92025425257 & -145.920254252571 \tabularnewline
6 & 3340.5 & 3528.96468505609 & -188.46468505609 \tabularnewline
7 & 3640 & 3515.44023761481 & 124.559762385188 \tabularnewline
8 & 3820 & 3826.85292507529 & -6.85292507528629 \tabularnewline
9 & 3994 & 4006.19752277643 & -12.1975227764324 \tabularnewline
10 & 4387.5 & 4179.03097208747 & 208.469027912532 \tabularnewline
11 & 4573 & 4592.46860144029 & -19.4686014402851 \tabularnewline
12 & 4513 & 4776.10665694224 & -263.106656942242 \tabularnewline
13 & 4499.5 & 4690.94357608126 & -191.443576081261 \tabularnewline
14 & 4504 & 4659.13423248185 & -155.134232481849 \tabularnewline
15 & 4750 & 4648.7974538096 & 101.202546190398 \tabularnewline
16 & 5000 & 4904.47629615712 & 95.5237038428813 \tabularnewline
17 & 5166 & 5163.61202351527 & 2.38797648473064 \tabularnewline
\hline
\end{tabular}
%Source: https://freestatistics.org/blog/index.php?pk=301086&T=2

[TABLE]
[ROW][C]Interpolation Forecasts of Exponential Smoothing[/C][/ROW]
[ROW][C]t[/C][C]Observed[/C][C]Fitted[/C][C]Residuals[/C][/ROW]
[ROW][C]3[/C][C]3122[/C][C]3173[/C][C]-51[/C][/ROW]
[ROW][C]4[/C][C]3275[/C][C]3334.62244525158[/C][C]-59.622445251578[/C][/ROW]
[ROW][C]5[/C][C]3336[/C][C]3481.92025425257[/C][C]-145.920254252571[/C][/ROW]
[ROW][C]6[/C][C]3340.5[/C][C]3528.96468505609[/C][C]-188.46468505609[/C][/ROW]
[ROW][C]7[/C][C]3640[/C][C]3515.44023761481[/C][C]124.559762385188[/C][/ROW]
[ROW][C]8[/C][C]3820[/C][C]3826.85292507529[/C][C]-6.85292507528629[/C][/ROW]
[ROW][C]9[/C][C]3994[/C][C]4006.19752277643[/C][C]-12.1975227764324[/C][/ROW]
[ROW][C]10[/C][C]4387.5[/C][C]4179.03097208747[/C][C]208.469027912532[/C][/ROW]
[ROW][C]11[/C][C]4573[/C][C]4592.46860144029[/C][C]-19.4686014402851[/C][/ROW]
[ROW][C]12[/C][C]4513[/C][C]4776.10665694224[/C][C]-263.106656942242[/C][/ROW]
[ROW][C]13[/C][C]4499.5[/C][C]4690.94357608126[/C][C]-191.443576081261[/C][/ROW]
[ROW][C]14[/C][C]4504[/C][C]4659.13423248185[/C][C]-155.134232481849[/C][/ROW]
[ROW][C]15[/C][C]4750[/C][C]4648.7974538096[/C][C]101.202546190398[/C][/ROW]
[ROW][C]16[/C][C]5000[/C][C]4904.47629615712[/C][C]95.5237038428813[/C][/ROW]
[ROW][C]17[/C][C]5166[/C][C]5163.61202351527[/C][C]2.38797648473064[/C][/ROW]
[/TABLE]
Source: https://freestatistics.org/blog/index.php?pk=301086&T=2

Globally Unique Identifier (entire table): ba.freestatistics.org/blog/index.php?pk=301086&T=2

As an alternative you can also use a QR Code:  

The GUIDs for individual cells are displayed in the table below:

Interpolation Forecasts of Exponential Smoothing
tObservedFittedResiduals
331223173-51
432753334.62244525158-59.622445251578
533363481.92025425257-145.920254252571
63340.53528.96468505609-188.46468505609
736403515.44023761481124.559762385188
838203826.85292507529-6.85292507528629
939944006.19752277643-12.1975227764324
104387.54179.03097208747208.469027912532
1145734592.46860144029-19.4686014402851
1245134776.10665694224-263.106656942242
134499.54690.94357608126-191.443576081261
1445044659.13423248185-155.134232481849
1547504648.7974538096101.202546190398
1650004904.4762961571295.5237038428813
1751665163.612023515272.38797648473064


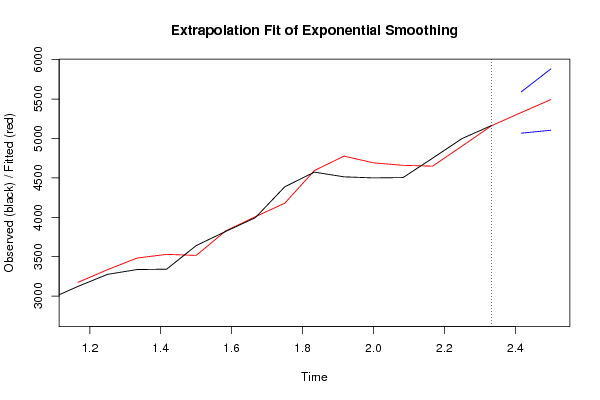
Extrapolation Forecasts of Exponential Smoothing
tForecast95% Lower Bound95% Upper Bound
185329.840405594535067.486904801765592.1939063873
195493.680811189065104.510245355145882.85137702298

\begin{tabular}{lllllllll}
\hline
Extrapolation Forecasts of Exponential Smoothing \tabularnewline
t & Forecast & 95% Lower Bound & 95% Upper Bound \tabularnewline
18 & 5329.84040559453 & 5067.48690480176 & 5592.1939063873 \tabularnewline
19 & 5493.68081118906 & 5104.51024535514 & 5882.85137702298 \tabularnewline
\hline
\end{tabular}
%Source: https://freestatistics.org/blog/index.php?pk=301086&T=3

[TABLE]
[ROW][C]Extrapolation Forecasts of Exponential Smoothing[/C][/ROW]
[ROW][C]t[/C][C]Forecast[/C][C]95% Lower Bound[/C][C]95% Upper Bound[/C][/ROW]
[ROW][C]18[/C][C]5329.84040559453[/C][C]5067.48690480176[/C][C]5592.1939063873[/C][/ROW]
[ROW][C]19[/C][C]5493.68081118906[/C][C]5104.51024535514[/C][C]5882.85137702298[/C][/ROW]
[/TABLE]
Source: https://freestatistics.org/blog/index.php?pk=301086&T=3

Globally Unique Identifier (entire table): ba.freestatistics.org/blog/index.php?pk=301086&T=3

As an alternative you can also use a QR Code:  

The GUIDs for individual cells are displayed in the table below:

Extrapolation Forecasts of Exponential Smoothing
tForecast95% Lower Bound95% Upper Bound
185329.840405594535067.486904801765592.1939063873
195493.680811189065104.510245355145882.85137702298


Parameters (Session):
par1 = 12 ; par2 = Double ; par3 = additive ; par4 = 12 ;
Parameters (R input):
par1 = 12 ; par2 = Double ; par3 = additive ; par4 = 2 ;
R code (references can be found in the software module):
par4 <- '2'
par3 <- 'additive'
par2 <- 'Triple'
par1 <- '12'
par1 <- as.numeric(par1)
par4 <- as.numeric(par4)
if (par2 == 'Single') K <- 1
if (par2 == 'Double') K <- 2
if (par2 == 'Triple') K <- par1
nx <- length(x)
nxmK <- nx - K
x <- ts(x, frequency = par1)
if (par2 == 'Single') fit <- HoltWinters(x, gamma=F, beta=F)
if (par2 == 'Double') fit <- HoltWinters(x, gamma=F)
if (par2 == 'Triple') fit <- HoltWinters(x, seasonal=par3)
fit
myresid <- x - fit$fitted[,'xhat']
bitmap(file='test1.png')
op <- par(mfrow=c(2,1))
plot(fit,ylab='Observed (black) / Fitted (red)',main='Interpolation Fit of Exponential Smoothing')
plot(myresid,ylab='Residuals',main='Interpolation Prediction Errors')
par(op)
dev.off()
bitmap(file='test2.png')
p <- predict(fit, par4, prediction.interval=TRUE)
np <- length(p[,1])
plot(fit,p,ylab='Observed (black) / Fitted (red)',main='Extrapolation Fit of Exponential Smoothing')
dev.off()
bitmap(file='test3.png')
op <- par(mfrow = c(2,2))
acf(as.numeric(myresid),lag.max = nx/2,main='Residual ACF')
spectrum(myresid,main='Residals Periodogram')
cpgram(myresid,main='Residal Cumulative Periodogram')
qqnorm(myresid,main='Residual Normal QQ Plot')
qqline(myresid)
par(op)
dev.off()
load(file='createtable')
a<-table.start()
a<-table.row.start(a)
a<-table.element(a,'Estimated Parameters of Exponential Smoothing',2,TRUE)
a<-table.row.end(a)
a<-table.row.start(a)
a<-table.element(a,'Parameter',header=TRUE)
a<-table.element(a,'Value',header=TRUE)
a<-table.row.end(a)
a<-table.row.start(a)
a<-table.element(a,'alpha',header=TRUE)
a<-table.element(a,fit$alpha)
a<-table.row.end(a)
a<-table.row.start(a)
a<-table.element(a,'beta',header=TRUE)
a<-table.element(a,fit$beta)
a<-table.row.end(a)
a<-table.row.start(a)
a<-table.element(a,'gamma',header=TRUE)
a<-table.element(a,fit$gamma)
a<-table.row.end(a)
a<-table.end(a)
table.save(a,file='mytable.tab')
a<-table.start()
a<-table.row.start(a)
a<-table.element(a,'Interpolation Forecasts of Exponential Smoothing',4,TRUE)
a<-table.row.end(a)
a<-table.row.start(a)
a<-table.element(a,'t',header=TRUE)
a<-table.element(a,'Observed',header=TRUE)
a<-table.element(a,'Fitted',header=TRUE)
a<-table.element(a,'Residuals',header=TRUE)
a<-table.row.end(a)
for (i in 1:nxmK) {
a<-table.row.start(a)
a<-table.element(a,i+K,header=TRUE)
a<-table.element(a,x[i+K])
a<-table.element(a,fit$fitted[i,'xhat'])
a<-table.element(a,myresid[i])
a<-table.row.end(a)
}
a<-table.end(a)
table.save(a,file='mytable1.tab')
a<-table.start()
a<-table.row.start(a)
a<-table.element(a,'Extrapolation Forecasts of Exponential Smoothing',4,TRUE)
a<-table.row.end(a)
a<-table.row.start(a)
a<-table.element(a,'t',header=TRUE)
a<-table.element(a,'Forecast',header=TRUE)
a<-table.element(a,'95% Lower Bound',header=TRUE)
a<-table.element(a,'95% Upper Bound',header=TRUE)
a<-table.row.end(a)
for (i in 1:np) {
a<-table.row.start(a)
a<-table.element(a,nx+i,header=TRUE)
a<-table.element(a,p[i,'fit'])
a<-table.element(a,p[i,'lwr'])
a<-table.element(a,p[i,'upr'])
a<-table.row.end(a)
}
a<-table.end(a)
table.save(a,file='mytable2.tab')