Free Statistics

of Irreproducible Research!

Author's title

Author*The author of this computation has been verified*
R Software Modulerwasp_exponentialsmoothing.wasp
Title produced by softwareExponential Smoothing
Date of computationSun, 18 Dec 2016 15:15:59 +0100
Cite this page as followsStatistical Computations at FreeStatistics.org, Office for Research Development and Education, URL https://freestatistics.org/blog/index.php?v=date/2016/Dec/18/t1482070623k62f7emnwsxd0l0.htm/, Retrieved Wed, 08 May 2024 16:31:52 +0000
Statistical Computations at FreeStatistics.org, Office for Research Development and Education, URL https://freestatistics.org/blog/index.php?pk=301103, Retrieved Wed, 08 May 2024 16:31:52 +0000
QR Codes:

Original text written by user:
IsPrivate?No (this computation is public)
User-defined keywords
Estimated Impact69
Family? (F = Feedback message, R = changed R code, M = changed R Module, P = changed Parameters, D = changed Data)
-       [Exponential Smoothing] [exponantial smoot...] [2016-12-18 14:15:59] [cedc5386ad7644fa02c81dc221bdf6b7] [Current]
Feedback Forum

Post a new message
Dataseries X:
691.72
839.86
1083.36
1326.82
1555.92
1385.54
1704.08
1737.16
1913.56
2487.28
2696.24
2982.52
3165.84
3580.66


Summary of computational transaction
Raw Input view raw input (R code)
Raw Outputview raw output of R engine
Computing time2 seconds
R ServerBig Analytics Cloud Computing Center

\begin{tabular}{lllllllll}
\hline
Summary of computational transaction \tabularnewline
Raw Input view raw input (R code)  \tabularnewline
Raw Outputview raw output of R engine  \tabularnewline
Computing time2 seconds \tabularnewline
R ServerBig Analytics Cloud Computing Center \tabularnewline
\hline
\end{tabular}
%Source: https://freestatistics.org/blog/index.php?pk=301103&T=0

[TABLE]
[ROW]
Summary of computational transaction[/C][/ROW] [ROW]Raw Input[/C] view raw input (R code) [/C][/ROW] [ROW]Raw Output[/C]view raw output of R engine [/C][/ROW] [ROW]Computing time[/C]2 seconds[/C][/ROW] [ROW]R Server[/C]Big Analytics Cloud Computing Center[/C][/ROW] [/TABLE] Source: https://freestatistics.org/blog/index.php?pk=301103&T=0

Globally Unique Identifier (entire table): ba.freestatistics.org/blog/index.php?pk=301103&T=0

As an alternative you can also use a QR Code:  

The GUIDs for individual cells are displayed in the table below:

Summary of computational transaction
Raw Input view raw input (R code)
Raw Outputview raw output of R engine
Computing time2 seconds
R ServerBig Analytics Cloud Computing Center


Estimated Parameters of Exponential Smoothing
ParameterValue
alpha0.770557578742099
beta0.205585642458666
gammaFALSE

\begin{tabular}{lllllllll}
\hline
Estimated Parameters of Exponential Smoothing \tabularnewline
Parameter & Value \tabularnewline
alpha & 0.770557578742099 \tabularnewline
beta & 0.205585642458666 \tabularnewline
gamma & FALSE \tabularnewline
\hline
\end{tabular}
%Source: https://freestatistics.org/blog/index.php?pk=301103&T=1

[TABLE]
[ROW][C]Estimated Parameters of Exponential Smoothing[/C][/ROW]
[ROW][C]Parameter[/C][C]Value[/C][/ROW]
[ROW][C]alpha[/C][C]0.770557578742099[/C][/ROW]
[ROW][C]beta[/C][C]0.205585642458666[/C][/ROW]
[ROW][C]gamma[/C][C]FALSE[/C][/ROW]
[/TABLE]
Source: https://freestatistics.org/blog/index.php?pk=301103&T=1

Globally Unique Identifier (entire table): ba.freestatistics.org/blog/index.php?pk=301103&T=1

As an alternative you can also use a QR Code:  

The GUIDs for individual cells are displayed in the table below:

Estimated Parameters of Exponential Smoothing
ParameterValue
alpha0.770557578742099
beta0.205585642458666
gammaFALSE


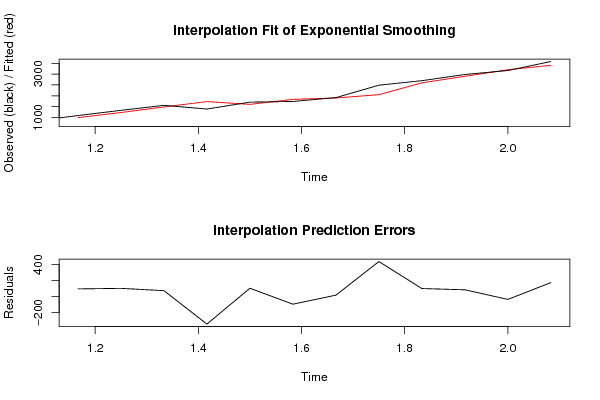
Interpolation Forecasts of Exponential Smoothing
tObservedFittedResiduals
31083.3698895.3599999999999
41326.821224.72687992913102.093120070874
51555.921482.8151568644773.104843135533
61385.541730.14724306422-344.607243064221
71704.081601.01696099375103.063039006245
81737.161833.16919812305-96.0091981230532
91913.561896.7154619010816.8445380989249
102487.282049.89046460078437.389535399216
112696.242596.408916867899.8310831322028
122982.522898.63394389783.8860561029996
133165.843201.86126730733-36.0212673073315
143580.663406.98676414886173.673235851139

\begin{tabular}{lllllllll}
\hline
Interpolation Forecasts of Exponential Smoothing \tabularnewline
t & Observed & Fitted & Residuals \tabularnewline
3 & 1083.36 & 988 & 95.3599999999999 \tabularnewline
4 & 1326.82 & 1224.72687992913 & 102.093120070874 \tabularnewline
5 & 1555.92 & 1482.81515686447 & 73.104843135533 \tabularnewline
6 & 1385.54 & 1730.14724306422 & -344.607243064221 \tabularnewline
7 & 1704.08 & 1601.01696099375 & 103.063039006245 \tabularnewline
8 & 1737.16 & 1833.16919812305 & -96.0091981230532 \tabularnewline
9 & 1913.56 & 1896.71546190108 & 16.8445380989249 \tabularnewline
10 & 2487.28 & 2049.89046460078 & 437.389535399216 \tabularnewline
11 & 2696.24 & 2596.4089168678 & 99.8310831322028 \tabularnewline
12 & 2982.52 & 2898.633943897 & 83.8860561029996 \tabularnewline
13 & 3165.84 & 3201.86126730733 & -36.0212673073315 \tabularnewline
14 & 3580.66 & 3406.98676414886 & 173.673235851139 \tabularnewline
\hline
\end{tabular}
%Source: https://freestatistics.org/blog/index.php?pk=301103&T=2

[TABLE]
[ROW][C]Interpolation Forecasts of Exponential Smoothing[/C][/ROW]
[ROW][C]t[/C][C]Observed[/C][C]Fitted[/C][C]Residuals[/C][/ROW]
[ROW][C]3[/C][C]1083.36[/C][C]988[/C][C]95.3599999999999[/C][/ROW]
[ROW][C]4[/C][C]1326.82[/C][C]1224.72687992913[/C][C]102.093120070874[/C][/ROW]
[ROW][C]5[/C][C]1555.92[/C][C]1482.81515686447[/C][C]73.104843135533[/C][/ROW]
[ROW][C]6[/C][C]1385.54[/C][C]1730.14724306422[/C][C]-344.607243064221[/C][/ROW]
[ROW][C]7[/C][C]1704.08[/C][C]1601.01696099375[/C][C]103.063039006245[/C][/ROW]
[ROW][C]8[/C][C]1737.16[/C][C]1833.16919812305[/C][C]-96.0091981230532[/C][/ROW]
[ROW][C]9[/C][C]1913.56[/C][C]1896.71546190108[/C][C]16.8445380989249[/C][/ROW]
[ROW][C]10[/C][C]2487.28[/C][C]2049.89046460078[/C][C]437.389535399216[/C][/ROW]
[ROW][C]11[/C][C]2696.24[/C][C]2596.4089168678[/C][C]99.8310831322028[/C][/ROW]
[ROW][C]12[/C][C]2982.52[/C][C]2898.633943897[/C][C]83.8860561029996[/C][/ROW]
[ROW][C]13[/C][C]3165.84[/C][C]3201.86126730733[/C][C]-36.0212673073315[/C][/ROW]
[ROW][C]14[/C][C]3580.66[/C][C]3406.98676414886[/C][C]173.673235851139[/C][/ROW]
[/TABLE]
Source: https://freestatistics.org/blog/index.php?pk=301103&T=2

Globally Unique Identifier (entire table): ba.freestatistics.org/blog/index.php?pk=301103&T=2

As an alternative you can also use a QR Code:  

The GUIDs for individual cells are displayed in the table below:

Interpolation Forecasts of Exponential Smoothing
tObservedFittedResiduals
31083.3698895.3599999999999
41326.821224.72687992913102.093120070874
51555.921482.8151568644773.104843135533
61385.541730.14724306422-344.607243064221
71704.081601.01696099375103.063039006245
81737.161833.16919812305-96.0091981230532
91913.561896.7154619010816.8445380989249
102487.282049.89046460078437.389535399216
112696.242596.408916867899.8310831322028
122982.522898.63394389783.8860561029996
133165.843201.86126730733-36.0212673073315
143580.663406.98676414886173.673235851139


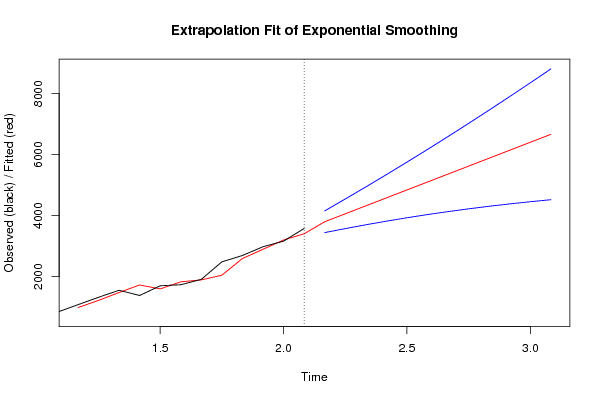
Extrapolation Forecasts of Exponential Smoothing
tForecast95% Lower Bound95% Upper Bound
153801.206495117833445.81549058314156.59749965256
164061.600997977043576.522724188254546.67927176583
174321.995500836253701.799465891294942.19153578121
184582.390003695463820.373864107485344.40614328344
194842.784506554673931.896687937565753.67232517179
205103.179009413884036.348917127096170.00910170067
215363.573512273094133.842915429586593.3041091166
225623.96801513234224.543646390577023.39238387403
235884.362517991514308.634313140297460.09072284274
246144.757020850724386.300585015797903.21345668566
256405.151523709934457.723268796588352.57977862328
266665.546026569154523.075034889198808.0170182491

\begin{tabular}{lllllllll}
\hline
Extrapolation Forecasts of Exponential Smoothing \tabularnewline
t & Forecast & 95% Lower Bound & 95% Upper Bound \tabularnewline
15 & 3801.20649511783 & 3445.8154905831 & 4156.59749965256 \tabularnewline
16 & 4061.60099797704 & 3576.52272418825 & 4546.67927176583 \tabularnewline
17 & 4321.99550083625 & 3701.79946589129 & 4942.19153578121 \tabularnewline
18 & 4582.39000369546 & 3820.37386410748 & 5344.40614328344 \tabularnewline
19 & 4842.78450655467 & 3931.89668793756 & 5753.67232517179 \tabularnewline
20 & 5103.17900941388 & 4036.34891712709 & 6170.00910170067 \tabularnewline
21 & 5363.57351227309 & 4133.84291542958 & 6593.3041091166 \tabularnewline
22 & 5623.9680151323 & 4224.54364639057 & 7023.39238387403 \tabularnewline
23 & 5884.36251799151 & 4308.63431314029 & 7460.09072284274 \tabularnewline
24 & 6144.75702085072 & 4386.30058501579 & 7903.21345668566 \tabularnewline
25 & 6405.15152370993 & 4457.72326879658 & 8352.57977862328 \tabularnewline
26 & 6665.54602656915 & 4523.07503488919 & 8808.0170182491 \tabularnewline
\hline
\end{tabular}
%Source: https://freestatistics.org/blog/index.php?pk=301103&T=3

[TABLE]
[ROW][C]Extrapolation Forecasts of Exponential Smoothing[/C][/ROW]
[ROW][C]t[/C][C]Forecast[/C][C]95% Lower Bound[/C][C]95% Upper Bound[/C][/ROW]
[ROW][C]15[/C][C]3801.20649511783[/C][C]3445.8154905831[/C][C]4156.59749965256[/C][/ROW]
[ROW][C]16[/C][C]4061.60099797704[/C][C]3576.52272418825[/C][C]4546.67927176583[/C][/ROW]
[ROW][C]17[/C][C]4321.99550083625[/C][C]3701.79946589129[/C][C]4942.19153578121[/C][/ROW]
[ROW][C]18[/C][C]4582.39000369546[/C][C]3820.37386410748[/C][C]5344.40614328344[/C][/ROW]
[ROW][C]19[/C][C]4842.78450655467[/C][C]3931.89668793756[/C][C]5753.67232517179[/C][/ROW]
[ROW][C]20[/C][C]5103.17900941388[/C][C]4036.34891712709[/C][C]6170.00910170067[/C][/ROW]
[ROW][C]21[/C][C]5363.57351227309[/C][C]4133.84291542958[/C][C]6593.3041091166[/C][/ROW]
[ROW][C]22[/C][C]5623.9680151323[/C][C]4224.54364639057[/C][C]7023.39238387403[/C][/ROW]
[ROW][C]23[/C][C]5884.36251799151[/C][C]4308.63431314029[/C][C]7460.09072284274[/C][/ROW]
[ROW][C]24[/C][C]6144.75702085072[/C][C]4386.30058501579[/C][C]7903.21345668566[/C][/ROW]
[ROW][C]25[/C][C]6405.15152370993[/C][C]4457.72326879658[/C][C]8352.57977862328[/C][/ROW]
[ROW][C]26[/C][C]6665.54602656915[/C][C]4523.07503488919[/C][C]8808.0170182491[/C][/ROW]
[/TABLE]
Source: https://freestatistics.org/blog/index.php?pk=301103&T=3

Globally Unique Identifier (entire table): ba.freestatistics.org/blog/index.php?pk=301103&T=3

As an alternative you can also use a QR Code:  

The GUIDs for individual cells are displayed in the table below:

Extrapolation Forecasts of Exponential Smoothing
tForecast95% Lower Bound95% Upper Bound
153801.206495117833445.81549058314156.59749965256
164061.600997977043576.522724188254546.67927176583
174321.995500836253701.799465891294942.19153578121
184582.390003695463820.373864107485344.40614328344
194842.784506554673931.896687937565753.67232517179
205103.179009413884036.348917127096170.00910170067
215363.573512273094133.842915429586593.3041091166
225623.96801513234224.543646390577023.39238387403
235884.362517991514308.634313140297460.09072284274
246144.757020850724386.300585015797903.21345668566
256405.151523709934457.723268796588352.57977862328
266665.546026569154523.075034889198808.0170182491


Parameters (Session):
par1 = 12 ; par2 = Double ; par3 = additive ; par4 = 12 ;
Parameters (R input):
par1 = 12 ; par2 = Double ; par3 = additive ; par4 = 12 ;
R code (references can be found in the software module):
par1 <- as.numeric(par1)
par4 <- as.numeric(par4)
if (par2 == 'Single') K <- 1
if (par2 == 'Double') K <- 2
if (par2 == 'Triple') K <- par1
nx <- length(x)
nxmK <- nx - K
x <- ts(x, frequency = par1)
if (par2 == 'Single') fit <- HoltWinters(x, gamma=F, beta=F)
if (par2 == 'Double') fit <- HoltWinters(x, gamma=F)
if (par2 == 'Triple') fit <- HoltWinters(x, seasonal=par3)
fit
myresid <- x - fit$fitted[,'xhat']
bitmap(file='test1.png')
op <- par(mfrow=c(2,1))
plot(fit,ylab='Observed (black) / Fitted (red)',main='Interpolation Fit of Exponential Smoothing')
plot(myresid,ylab='Residuals',main='Interpolation Prediction Errors')
par(op)
dev.off()
bitmap(file='test2.png')
p <- predict(fit, par4, prediction.interval=TRUE)
np <- length(p[,1])
plot(fit,p,ylab='Observed (black) / Fitted (red)',main='Extrapolation Fit of Exponential Smoothing')
dev.off()
bitmap(file='test3.png')
op <- par(mfrow = c(2,2))
acf(as.numeric(myresid),lag.max = nx/2,main='Residual ACF')
spectrum(myresid,main='Residals Periodogram')
cpgram(myresid,main='Residal Cumulative Periodogram')
qqnorm(myresid,main='Residual Normal QQ Plot')
qqline(myresid)
par(op)
dev.off()
load(file='createtable')
a<-table.start()
a<-table.row.start(a)
a<-table.element(a,'Estimated Parameters of Exponential Smoothing',2,TRUE)
a<-table.row.end(a)
a<-table.row.start(a)
a<-table.element(a,'Parameter',header=TRUE)
a<-table.element(a,'Value',header=TRUE)
a<-table.row.end(a)
a<-table.row.start(a)
a<-table.element(a,'alpha',header=TRUE)
a<-table.element(a,fit$alpha)
a<-table.row.end(a)
a<-table.row.start(a)
a<-table.element(a,'beta',header=TRUE)
a<-table.element(a,fit$beta)
a<-table.row.end(a)
a<-table.row.start(a)
a<-table.element(a,'gamma',header=TRUE)
a<-table.element(a,fit$gamma)
a<-table.row.end(a)
a<-table.end(a)
table.save(a,file='mytable.tab')
a<-table.start()
a<-table.row.start(a)
a<-table.element(a,'Interpolation Forecasts of Exponential Smoothing',4,TRUE)
a<-table.row.end(a)
a<-table.row.start(a)
a<-table.element(a,'t',header=TRUE)
a<-table.element(a,'Observed',header=TRUE)
a<-table.element(a,'Fitted',header=TRUE)
a<-table.element(a,'Residuals',header=TRUE)
a<-table.row.end(a)
for (i in 1:nxmK) {
a<-table.row.start(a)
a<-table.element(a,i+K,header=TRUE)
a<-table.element(a,x[i+K])
a<-table.element(a,fit$fitted[i,'xhat'])
a<-table.element(a,myresid[i])
a<-table.row.end(a)
}
a<-table.end(a)
table.save(a,file='mytable1.tab')
a<-table.start()
a<-table.row.start(a)
a<-table.element(a,'Extrapolation Forecasts of Exponential Smoothing',4,TRUE)
a<-table.row.end(a)
a<-table.row.start(a)
a<-table.element(a,'t',header=TRUE)
a<-table.element(a,'Forecast',header=TRUE)
a<-table.element(a,'95% Lower Bound',header=TRUE)
a<-table.element(a,'95% Upper Bound',header=TRUE)
a<-table.row.end(a)
for (i in 1:np) {
a<-table.row.start(a)
a<-table.element(a,nx+i,header=TRUE)
a<-table.element(a,p[i,'fit'])
a<-table.element(a,p[i,'lwr'])
a<-table.element(a,p[i,'upr'])
a<-table.row.end(a)
}
a<-table.end(a)
table.save(a,file='mytable2.tab')