Free Statistics

of Irreproducible Research!

Author's title

Author*The author of this computation has been verified*
R Software Modulerwasp_autocorrelation.wasp
Title produced by software(Partial) Autocorrelation Function
Date of computationSun, 18 Dec 2016 15:25:59 +0100
Cite this page as followsStatistical Computations at FreeStatistics.org, Office for Research Development and Education, URL https://freestatistics.org/blog/index.php?v=date/2016/Dec/18/t148207118452mepiueng9kxlc.htm/, Retrieved Wed, 08 May 2024 17:47:24 +0000
Statistical Computations at FreeStatistics.org, Office for Research Development and Education, URL https://freestatistics.org/blog/index.php?pk=301106, Retrieved Wed, 08 May 2024 17:47:24 +0000
QR Codes:

Original text written by user:
IsPrivate?No (this computation is public)
User-defined keywords
Estimated Impact69
Family? (F = Feedback message, R = changed R code, M = changed R Module, P = changed Parameters, D = changed Data)
-       [(Partial) Autocorrelation Function] [(partial) autocor...] [2016-12-18 14:25:59] [cedc5386ad7644fa02c81dc221bdf6b7] [Current]
Feedback Forum

Post a new message
Dataseries X:
101
101
100
101
103
101
100
99
100
100
99
100
100
100
100
101
99
99
100
100
100
99
102
100
100
99
101
97
102
101
101
100
106
100
99
99
100
100
100
100
102
101
100
99
99
101
101
100
100
99
98
100
100
100
99
101
100
99
99
100
103
99
98
99
100
100
101
100
100
100
99
100
98
99
104
100
100
99
100
98
101
101
99
99
100
99
99
99
100
99
102
100
99
100
101
102
99
99
101
100
100
100
97
99
99
100
99
98
100
100
102
100
99
103
100
100
100
99
100
99
100
99
99
100
99
101
99
101
100
99
101
101
99
100
99


Summary of computational transaction
Raw Input view raw input (R code)
Raw Outputview raw output of R engine
Computing time1 seconds
R ServerBig Analytics Cloud Computing Center

\begin{tabular}{lllllllll}
\hline
Summary of computational transaction \tabularnewline
Raw Input view raw input (R code)  \tabularnewline
Raw Outputview raw output of R engine  \tabularnewline
Computing time1 seconds \tabularnewline
R ServerBig Analytics Cloud Computing Center \tabularnewline
\hline
\end{tabular}
%Source: https://freestatistics.org/blog/index.php?pk=301106&T=0

[TABLE]
[ROW]
Summary of computational transaction[/C][/ROW] [ROW]Raw Input[/C] view raw input (R code) [/C][/ROW] [ROW]Raw Output[/C]view raw output of R engine [/C][/ROW] [ROW]Computing time[/C]1 seconds[/C][/ROW] [ROW]R Server[/C]Big Analytics Cloud Computing Center[/C][/ROW] [/TABLE] Source: https://freestatistics.org/blog/index.php?pk=301106&T=0

Globally Unique Identifier (entire table): ba.freestatistics.org/blog/index.php?pk=301106&T=0

As an alternative you can also use a QR Code:  

The GUIDs for individual cells are displayed in the table below:

Summary of computational transaction
Raw Input view raw input (R code)
Raw Outputview raw output of R engine
Computing time1 seconds
R ServerBig Analytics Cloud Computing Center


Autocorrelation Function
Time lag kACF(k)T-STATP-value
1-0.457572-5.29680
2-0.055043-0.63720.262553
3-0.047505-0.54990.291647
40.1324331.5330.063814
5-0.110086-1.27430.102375
60.050.57880.281849
7-0.024931-0.28860.386667
80.0399610.46260.322206
9-0.112476-1.3020.097574
100.2275112.63360.004721
11-0.125015-1.44720.075094
12-0.067549-0.78190.217816
13-0.07505-0.86880.193264
140.1500031.73640.042394
150.0724220.83840.201664
16-0.132481-1.53360.063745
170.0449940.52080.301668
18-0.030012-0.34740.364412
19-0.027513-0.31850.375308
200.1349991.56270.060238
21-0.029865-0.34570.365052
22-0.130134-1.50640.067158
230.0924941.07070.143115
24-0.01994-0.23080.408901
250.0325260.37650.353565
26-0.082558-0.95570.170478
270.0225240.26070.397349
280.0523760.60630.272671
29-0.002554-0.02960.488231
300.0249110.28840.386758
31-0.107563-1.24510.107629
320.0771520.89310.186702
33-0.075024-0.86850.193346
340.0325210.37650.353587
350.0675230.78160.217904
36-0.024985-0.28920.386431
370.0049420.05720.47723
38-0.032561-0.37690.353415
390.0375560.43470.332226
40-0.020061-0.23220.408359
41-0.085066-0.98470.163269
420.144951.67790.047847
43-0.084993-0.98390.163478
440.0125880.14570.44218
450.0299030.34610.364888
460.042440.49130.312016
47-0.137574-1.59250.056811
480.052440.6070.272427

\begin{tabular}{lllllllll}
\hline
Autocorrelation Function \tabularnewline
Time lag k & ACF(k) & T-STAT & P-value \tabularnewline
1 & -0.457572 & -5.2968 & 0 \tabularnewline
2 & -0.055043 & -0.6372 & 0.262553 \tabularnewline
3 & -0.047505 & -0.5499 & 0.291647 \tabularnewline
4 & 0.132433 & 1.533 & 0.063814 \tabularnewline
5 & -0.110086 & -1.2743 & 0.102375 \tabularnewline
6 & 0.05 & 0.5788 & 0.281849 \tabularnewline
7 & -0.024931 & -0.2886 & 0.386667 \tabularnewline
8 & 0.039961 & 0.4626 & 0.322206 \tabularnewline
9 & -0.112476 & -1.302 & 0.097574 \tabularnewline
10 & 0.227511 & 2.6336 & 0.004721 \tabularnewline
11 & -0.125015 & -1.4472 & 0.075094 \tabularnewline
12 & -0.067549 & -0.7819 & 0.217816 \tabularnewline
13 & -0.07505 & -0.8688 & 0.193264 \tabularnewline
14 & 0.150003 & 1.7364 & 0.042394 \tabularnewline
15 & 0.072422 & 0.8384 & 0.201664 \tabularnewline
16 & -0.132481 & -1.5336 & 0.063745 \tabularnewline
17 & 0.044994 & 0.5208 & 0.301668 \tabularnewline
18 & -0.030012 & -0.3474 & 0.364412 \tabularnewline
19 & -0.027513 & -0.3185 & 0.375308 \tabularnewline
20 & 0.134999 & 1.5627 & 0.060238 \tabularnewline
21 & -0.029865 & -0.3457 & 0.365052 \tabularnewline
22 & -0.130134 & -1.5064 & 0.067158 \tabularnewline
23 & 0.092494 & 1.0707 & 0.143115 \tabularnewline
24 & -0.01994 & -0.2308 & 0.408901 \tabularnewline
25 & 0.032526 & 0.3765 & 0.353565 \tabularnewline
26 & -0.082558 & -0.9557 & 0.170478 \tabularnewline
27 & 0.022524 & 0.2607 & 0.397349 \tabularnewline
28 & 0.052376 & 0.6063 & 0.272671 \tabularnewline
29 & -0.002554 & -0.0296 & 0.488231 \tabularnewline
30 & 0.024911 & 0.2884 & 0.386758 \tabularnewline
31 & -0.107563 & -1.2451 & 0.107629 \tabularnewline
32 & 0.077152 & 0.8931 & 0.186702 \tabularnewline
33 & -0.075024 & -0.8685 & 0.193346 \tabularnewline
34 & 0.032521 & 0.3765 & 0.353587 \tabularnewline
35 & 0.067523 & 0.7816 & 0.217904 \tabularnewline
36 & -0.024985 & -0.2892 & 0.386431 \tabularnewline
37 & 0.004942 & 0.0572 & 0.47723 \tabularnewline
38 & -0.032561 & -0.3769 & 0.353415 \tabularnewline
39 & 0.037556 & 0.4347 & 0.332226 \tabularnewline
40 & -0.020061 & -0.2322 & 0.408359 \tabularnewline
41 & -0.085066 & -0.9847 & 0.163269 \tabularnewline
42 & 0.14495 & 1.6779 & 0.047847 \tabularnewline
43 & -0.084993 & -0.9839 & 0.163478 \tabularnewline
44 & 0.012588 & 0.1457 & 0.44218 \tabularnewline
45 & 0.029903 & 0.3461 & 0.364888 \tabularnewline
46 & 0.04244 & 0.4913 & 0.312016 \tabularnewline
47 & -0.137574 & -1.5925 & 0.056811 \tabularnewline
48 & 0.05244 & 0.607 & 0.272427 \tabularnewline
\hline
\end{tabular}
%Source: https://freestatistics.org/blog/index.php?pk=301106&T=1

[TABLE]
[ROW][C]Autocorrelation Function[/C][/ROW]
[ROW][C]Time lag k[/C][C]ACF(k)[/C][C]T-STAT[/C][C]P-value[/C][/ROW]
[ROW][C]1[/C][C]-0.457572[/C][C]-5.2968[/C][C]0[/C][/ROW]
[ROW][C]2[/C][C]-0.055043[/C][C]-0.6372[/C][C]0.262553[/C][/ROW]
[ROW][C]3[/C][C]-0.047505[/C][C]-0.5499[/C][C]0.291647[/C][/ROW]
[ROW][C]4[/C][C]0.132433[/C][C]1.533[/C][C]0.063814[/C][/ROW]
[ROW][C]5[/C][C]-0.110086[/C][C]-1.2743[/C][C]0.102375[/C][/ROW]
[ROW][C]6[/C][C]0.05[/C][C]0.5788[/C][C]0.281849[/C][/ROW]
[ROW][C]7[/C][C]-0.024931[/C][C]-0.2886[/C][C]0.386667[/C][/ROW]
[ROW][C]8[/C][C]0.039961[/C][C]0.4626[/C][C]0.322206[/C][/ROW]
[ROW][C]9[/C][C]-0.112476[/C][C]-1.302[/C][C]0.097574[/C][/ROW]
[ROW][C]10[/C][C]0.227511[/C][C]2.6336[/C][C]0.004721[/C][/ROW]
[ROW][C]11[/C][C]-0.125015[/C][C]-1.4472[/C][C]0.075094[/C][/ROW]
[ROW][C]12[/C][C]-0.067549[/C][C]-0.7819[/C][C]0.217816[/C][/ROW]
[ROW][C]13[/C][C]-0.07505[/C][C]-0.8688[/C][C]0.193264[/C][/ROW]
[ROW][C]14[/C][C]0.150003[/C][C]1.7364[/C][C]0.042394[/C][/ROW]
[ROW][C]15[/C][C]0.072422[/C][C]0.8384[/C][C]0.201664[/C][/ROW]
[ROW][C]16[/C][C]-0.132481[/C][C]-1.5336[/C][C]0.063745[/C][/ROW]
[ROW][C]17[/C][C]0.044994[/C][C]0.5208[/C][C]0.301668[/C][/ROW]
[ROW][C]18[/C][C]-0.030012[/C][C]-0.3474[/C][C]0.364412[/C][/ROW]
[ROW][C]19[/C][C]-0.027513[/C][C]-0.3185[/C][C]0.375308[/C][/ROW]
[ROW][C]20[/C][C]0.134999[/C][C]1.5627[/C][C]0.060238[/C][/ROW]
[ROW][C]21[/C][C]-0.029865[/C][C]-0.3457[/C][C]0.365052[/C][/ROW]
[ROW][C]22[/C][C]-0.130134[/C][C]-1.5064[/C][C]0.067158[/C][/ROW]
[ROW][C]23[/C][C]0.092494[/C][C]1.0707[/C][C]0.143115[/C][/ROW]
[ROW][C]24[/C][C]-0.01994[/C][C]-0.2308[/C][C]0.408901[/C][/ROW]
[ROW][C]25[/C][C]0.032526[/C][C]0.3765[/C][C]0.353565[/C][/ROW]
[ROW][C]26[/C][C]-0.082558[/C][C]-0.9557[/C][C]0.170478[/C][/ROW]
[ROW][C]27[/C][C]0.022524[/C][C]0.2607[/C][C]0.397349[/C][/ROW]
[ROW][C]28[/C][C]0.052376[/C][C]0.6063[/C][C]0.272671[/C][/ROW]
[ROW][C]29[/C][C]-0.002554[/C][C]-0.0296[/C][C]0.488231[/C][/ROW]
[ROW][C]30[/C][C]0.024911[/C][C]0.2884[/C][C]0.386758[/C][/ROW]
[ROW][C]31[/C][C]-0.107563[/C][C]-1.2451[/C][C]0.107629[/C][/ROW]
[ROW][C]32[/C][C]0.077152[/C][C]0.8931[/C][C]0.186702[/C][/ROW]
[ROW][C]33[/C][C]-0.075024[/C][C]-0.8685[/C][C]0.193346[/C][/ROW]
[ROW][C]34[/C][C]0.032521[/C][C]0.3765[/C][C]0.353587[/C][/ROW]
[ROW][C]35[/C][C]0.067523[/C][C]0.7816[/C][C]0.217904[/C][/ROW]
[ROW][C]36[/C][C]-0.024985[/C][C]-0.2892[/C][C]0.386431[/C][/ROW]
[ROW][C]37[/C][C]0.004942[/C][C]0.0572[/C][C]0.47723[/C][/ROW]
[ROW][C]38[/C][C]-0.032561[/C][C]-0.3769[/C][C]0.353415[/C][/ROW]
[ROW][C]39[/C][C]0.037556[/C][C]0.4347[/C][C]0.332226[/C][/ROW]
[ROW][C]40[/C][C]-0.020061[/C][C]-0.2322[/C][C]0.408359[/C][/ROW]
[ROW][C]41[/C][C]-0.085066[/C][C]-0.9847[/C][C]0.163269[/C][/ROW]
[ROW][C]42[/C][C]0.14495[/C][C]1.6779[/C][C]0.047847[/C][/ROW]
[ROW][C]43[/C][C]-0.084993[/C][C]-0.9839[/C][C]0.163478[/C][/ROW]
[ROW][C]44[/C][C]0.012588[/C][C]0.1457[/C][C]0.44218[/C][/ROW]
[ROW][C]45[/C][C]0.029903[/C][C]0.3461[/C][C]0.364888[/C][/ROW]
[ROW][C]46[/C][C]0.04244[/C][C]0.4913[/C][C]0.312016[/C][/ROW]
[ROW][C]47[/C][C]-0.137574[/C][C]-1.5925[/C][C]0.056811[/C][/ROW]
[ROW][C]48[/C][C]0.05244[/C][C]0.607[/C][C]0.272427[/C][/ROW]
[/TABLE]
Source: https://freestatistics.org/blog/index.php?pk=301106&T=1

Globally Unique Identifier (entire table): ba.freestatistics.org/blog/index.php?pk=301106&T=1

As an alternative you can also use a QR Code:  

The GUIDs for individual cells are displayed in the table below:

Autocorrelation Function
Time lag kACF(k)T-STATP-value
1-0.457572-5.29680
2-0.055043-0.63720.262553
3-0.047505-0.54990.291647
40.1324331.5330.063814
5-0.110086-1.27430.102375
60.050.57880.281849
7-0.024931-0.28860.386667
80.0399610.46260.322206
9-0.112476-1.3020.097574
100.2275112.63360.004721
11-0.125015-1.44720.075094
12-0.067549-0.78190.217816
13-0.07505-0.86880.193264
140.1500031.73640.042394
150.0724220.83840.201664
16-0.132481-1.53360.063745
170.0449940.52080.301668
18-0.030012-0.34740.364412
19-0.027513-0.31850.375308
200.1349991.56270.060238
21-0.029865-0.34570.365052
22-0.130134-1.50640.067158
230.0924941.07070.143115
24-0.01994-0.23080.408901
250.0325260.37650.353565
26-0.082558-0.95570.170478
270.0225240.26070.397349
280.0523760.60630.272671
29-0.002554-0.02960.488231
300.0249110.28840.386758
31-0.107563-1.24510.107629
320.0771520.89310.186702
33-0.075024-0.86850.193346
340.0325210.37650.353587
350.0675230.78160.217904
36-0.024985-0.28920.386431
370.0049420.05720.47723
38-0.032561-0.37690.353415
390.0375560.43470.332226
40-0.020061-0.23220.408359
41-0.085066-0.98470.163269
420.144951.67790.047847
43-0.084993-0.98390.163478
440.0125880.14570.44218
450.0299030.34610.364888
460.042440.49130.312016
47-0.137574-1.59250.056811
480.052440.6070.272427


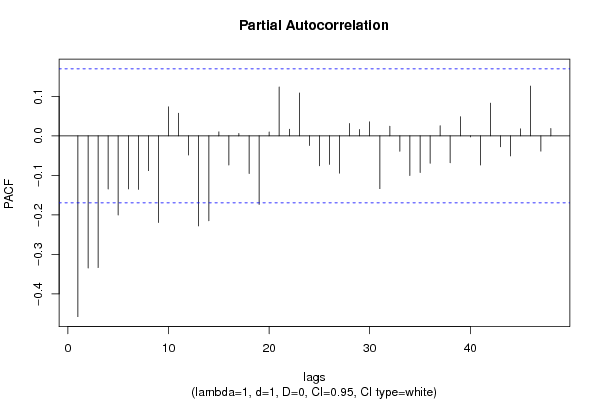
Partial Autocorrelation Function
Time lag kPACF(k)T-STATP-value
1-0.457572-5.29680
2-0.334436-3.87148.4e-05
3-0.333443-3.85998.8e-05
4-0.134685-1.55910.060667
5-0.200461-2.32050.010912
6-0.134316-1.55480.061173
7-0.135549-1.56910.059493
8-0.08797-1.01830.155179
9-0.219493-2.54080.0061
100.0732920.84840.198859
110.0572680.66290.254259
12-0.048552-0.5620.287517
13-0.227852-2.63760.004669
14-0.214908-2.48770.007041
150.0101060.1170.453523
16-0.07385-0.85490.197072
170.0059320.06870.472679
18-0.095258-1.10270.136069
19-0.173432-2.00760.023347
200.0099160.11480.454392
210.1236321.43110.077359
220.0166660.19290.423657
230.108331.2540.106011
24-0.024529-0.28390.388447
25-0.075848-0.8780.190757
26-0.072268-0.83660.202164
27-0.094315-1.09180.138446
280.0313990.36350.358411
290.0160730.18610.426338
300.0353670.40940.341451
31-0.133579-1.54630.062197
320.0244510.2830.388793
33-0.038816-0.44930.326961
34-0.100442-1.16270.12351
35-0.092779-1.0740.142377
36-0.069547-0.80510.211104
370.0255580.29590.3839
38-0.068199-0.78950.21562
390.0483620.55980.288265
40-0.002618-0.03030.487934
41-0.073733-0.85350.197447
420.0827480.95790.169924
43-0.027432-0.31750.37566
44-0.050704-0.58690.279116
450.0176140.20390.419371
460.1259571.45810.073583
47-0.038736-0.44840.327294
480.0187680.21730.414171

\begin{tabular}{lllllllll}
\hline
Partial Autocorrelation Function \tabularnewline
Time lag k & PACF(k) & T-STAT & P-value \tabularnewline
1 & -0.457572 & -5.2968 & 0 \tabularnewline
2 & -0.334436 & -3.8714 & 8.4e-05 \tabularnewline
3 & -0.333443 & -3.8599 & 8.8e-05 \tabularnewline
4 & -0.134685 & -1.5591 & 0.060667 \tabularnewline
5 & -0.200461 & -2.3205 & 0.010912 \tabularnewline
6 & -0.134316 & -1.5548 & 0.061173 \tabularnewline
7 & -0.135549 & -1.5691 & 0.059493 \tabularnewline
8 & -0.08797 & -1.0183 & 0.155179 \tabularnewline
9 & -0.219493 & -2.5408 & 0.0061 \tabularnewline
10 & 0.073292 & 0.8484 & 0.198859 \tabularnewline
11 & 0.057268 & 0.6629 & 0.254259 \tabularnewline
12 & -0.048552 & -0.562 & 0.287517 \tabularnewline
13 & -0.227852 & -2.6376 & 0.004669 \tabularnewline
14 & -0.214908 & -2.4877 & 0.007041 \tabularnewline
15 & 0.010106 & 0.117 & 0.453523 \tabularnewline
16 & -0.07385 & -0.8549 & 0.197072 \tabularnewline
17 & 0.005932 & 0.0687 & 0.472679 \tabularnewline
18 & -0.095258 & -1.1027 & 0.136069 \tabularnewline
19 & -0.173432 & -2.0076 & 0.023347 \tabularnewline
20 & 0.009916 & 0.1148 & 0.454392 \tabularnewline
21 & 0.123632 & 1.4311 & 0.077359 \tabularnewline
22 & 0.016666 & 0.1929 & 0.423657 \tabularnewline
23 & 0.10833 & 1.254 & 0.106011 \tabularnewline
24 & -0.024529 & -0.2839 & 0.388447 \tabularnewline
25 & -0.075848 & -0.878 & 0.190757 \tabularnewline
26 & -0.072268 & -0.8366 & 0.202164 \tabularnewline
27 & -0.094315 & -1.0918 & 0.138446 \tabularnewline
28 & 0.031399 & 0.3635 & 0.358411 \tabularnewline
29 & 0.016073 & 0.1861 & 0.426338 \tabularnewline
30 & 0.035367 & 0.4094 & 0.341451 \tabularnewline
31 & -0.133579 & -1.5463 & 0.062197 \tabularnewline
32 & 0.024451 & 0.283 & 0.388793 \tabularnewline
33 & -0.038816 & -0.4493 & 0.326961 \tabularnewline
34 & -0.100442 & -1.1627 & 0.12351 \tabularnewline
35 & -0.092779 & -1.074 & 0.142377 \tabularnewline
36 & -0.069547 & -0.8051 & 0.211104 \tabularnewline
37 & 0.025558 & 0.2959 & 0.3839 \tabularnewline
38 & -0.068199 & -0.7895 & 0.21562 \tabularnewline
39 & 0.048362 & 0.5598 & 0.288265 \tabularnewline
40 & -0.002618 & -0.0303 & 0.487934 \tabularnewline
41 & -0.073733 & -0.8535 & 0.197447 \tabularnewline
42 & 0.082748 & 0.9579 & 0.169924 \tabularnewline
43 & -0.027432 & -0.3175 & 0.37566 \tabularnewline
44 & -0.050704 & -0.5869 & 0.279116 \tabularnewline
45 & 0.017614 & 0.2039 & 0.419371 \tabularnewline
46 & 0.125957 & 1.4581 & 0.073583 \tabularnewline
47 & -0.038736 & -0.4484 & 0.327294 \tabularnewline
48 & 0.018768 & 0.2173 & 0.414171 \tabularnewline
\hline
\end{tabular}
%Source: https://freestatistics.org/blog/index.php?pk=301106&T=2

[TABLE]
[ROW][C]Partial Autocorrelation Function[/C][/ROW]
[ROW][C]Time lag k[/C][C]PACF(k)[/C][C]T-STAT[/C][C]P-value[/C][/ROW]
[ROW][C]1[/C][C]-0.457572[/C][C]-5.2968[/C][C]0[/C][/ROW]
[ROW][C]2[/C][C]-0.334436[/C][C]-3.8714[/C][C]8.4e-05[/C][/ROW]
[ROW][C]3[/C][C]-0.333443[/C][C]-3.8599[/C][C]8.8e-05[/C][/ROW]
[ROW][C]4[/C][C]-0.134685[/C][C]-1.5591[/C][C]0.060667[/C][/ROW]
[ROW][C]5[/C][C]-0.200461[/C][C]-2.3205[/C][C]0.010912[/C][/ROW]
[ROW][C]6[/C][C]-0.134316[/C][C]-1.5548[/C][C]0.061173[/C][/ROW]
[ROW][C]7[/C][C]-0.135549[/C][C]-1.5691[/C][C]0.059493[/C][/ROW]
[ROW][C]8[/C][C]-0.08797[/C][C]-1.0183[/C][C]0.155179[/C][/ROW]
[ROW][C]9[/C][C]-0.219493[/C][C]-2.5408[/C][C]0.0061[/C][/ROW]
[ROW][C]10[/C][C]0.073292[/C][C]0.8484[/C][C]0.198859[/C][/ROW]
[ROW][C]11[/C][C]0.057268[/C][C]0.6629[/C][C]0.254259[/C][/ROW]
[ROW][C]12[/C][C]-0.048552[/C][C]-0.562[/C][C]0.287517[/C][/ROW]
[ROW][C]13[/C][C]-0.227852[/C][C]-2.6376[/C][C]0.004669[/C][/ROW]
[ROW][C]14[/C][C]-0.214908[/C][C]-2.4877[/C][C]0.007041[/C][/ROW]
[ROW][C]15[/C][C]0.010106[/C][C]0.117[/C][C]0.453523[/C][/ROW]
[ROW][C]16[/C][C]-0.07385[/C][C]-0.8549[/C][C]0.197072[/C][/ROW]
[ROW][C]17[/C][C]0.005932[/C][C]0.0687[/C][C]0.472679[/C][/ROW]
[ROW][C]18[/C][C]-0.095258[/C][C]-1.1027[/C][C]0.136069[/C][/ROW]
[ROW][C]19[/C][C]-0.173432[/C][C]-2.0076[/C][C]0.023347[/C][/ROW]
[ROW][C]20[/C][C]0.009916[/C][C]0.1148[/C][C]0.454392[/C][/ROW]
[ROW][C]21[/C][C]0.123632[/C][C]1.4311[/C][C]0.077359[/C][/ROW]
[ROW][C]22[/C][C]0.016666[/C][C]0.1929[/C][C]0.423657[/C][/ROW]
[ROW][C]23[/C][C]0.10833[/C][C]1.254[/C][C]0.106011[/C][/ROW]
[ROW][C]24[/C][C]-0.024529[/C][C]-0.2839[/C][C]0.388447[/C][/ROW]
[ROW][C]25[/C][C]-0.075848[/C][C]-0.878[/C][C]0.190757[/C][/ROW]
[ROW][C]26[/C][C]-0.072268[/C][C]-0.8366[/C][C]0.202164[/C][/ROW]
[ROW][C]27[/C][C]-0.094315[/C][C]-1.0918[/C][C]0.138446[/C][/ROW]
[ROW][C]28[/C][C]0.031399[/C][C]0.3635[/C][C]0.358411[/C][/ROW]
[ROW][C]29[/C][C]0.016073[/C][C]0.1861[/C][C]0.426338[/C][/ROW]
[ROW][C]30[/C][C]0.035367[/C][C]0.4094[/C][C]0.341451[/C][/ROW]
[ROW][C]31[/C][C]-0.133579[/C][C]-1.5463[/C][C]0.062197[/C][/ROW]
[ROW][C]32[/C][C]0.024451[/C][C]0.283[/C][C]0.388793[/C][/ROW]
[ROW][C]33[/C][C]-0.038816[/C][C]-0.4493[/C][C]0.326961[/C][/ROW]
[ROW][C]34[/C][C]-0.100442[/C][C]-1.1627[/C][C]0.12351[/C][/ROW]
[ROW][C]35[/C][C]-0.092779[/C][C]-1.074[/C][C]0.142377[/C][/ROW]
[ROW][C]36[/C][C]-0.069547[/C][C]-0.8051[/C][C]0.211104[/C][/ROW]
[ROW][C]37[/C][C]0.025558[/C][C]0.2959[/C][C]0.3839[/C][/ROW]
[ROW][C]38[/C][C]-0.068199[/C][C]-0.7895[/C][C]0.21562[/C][/ROW]
[ROW][C]39[/C][C]0.048362[/C][C]0.5598[/C][C]0.288265[/C][/ROW]
[ROW][C]40[/C][C]-0.002618[/C][C]-0.0303[/C][C]0.487934[/C][/ROW]
[ROW][C]41[/C][C]-0.073733[/C][C]-0.8535[/C][C]0.197447[/C][/ROW]
[ROW][C]42[/C][C]0.082748[/C][C]0.9579[/C][C]0.169924[/C][/ROW]
[ROW][C]43[/C][C]-0.027432[/C][C]-0.3175[/C][C]0.37566[/C][/ROW]
[ROW][C]44[/C][C]-0.050704[/C][C]-0.5869[/C][C]0.279116[/C][/ROW]
[ROW][C]45[/C][C]0.017614[/C][C]0.2039[/C][C]0.419371[/C][/ROW]
[ROW][C]46[/C][C]0.125957[/C][C]1.4581[/C][C]0.073583[/C][/ROW]
[ROW][C]47[/C][C]-0.038736[/C][C]-0.4484[/C][C]0.327294[/C][/ROW]
[ROW][C]48[/C][C]0.018768[/C][C]0.2173[/C][C]0.414171[/C][/ROW]
[/TABLE]
Source: https://freestatistics.org/blog/index.php?pk=301106&T=2

Globally Unique Identifier (entire table): ba.freestatistics.org/blog/index.php?pk=301106&T=2

As an alternative you can also use a QR Code:  

The GUIDs for individual cells are displayed in the table below:

Partial Autocorrelation Function
Time lag kPACF(k)T-STATP-value
1-0.457572-5.29680
2-0.334436-3.87148.4e-05
3-0.333443-3.85998.8e-05
4-0.134685-1.55910.060667
5-0.200461-2.32050.010912
6-0.134316-1.55480.061173
7-0.135549-1.56910.059493
8-0.08797-1.01830.155179
9-0.219493-2.54080.0061
100.0732920.84840.198859
110.0572680.66290.254259
12-0.048552-0.5620.287517
13-0.227852-2.63760.004669
14-0.214908-2.48770.007041
150.0101060.1170.453523
16-0.07385-0.85490.197072
170.0059320.06870.472679
18-0.095258-1.10270.136069
19-0.173432-2.00760.023347
200.0099160.11480.454392
210.1236321.43110.077359
220.0166660.19290.423657
230.108331.2540.106011
24-0.024529-0.28390.388447
25-0.075848-0.8780.190757
26-0.072268-0.83660.202164
27-0.094315-1.09180.138446
280.0313990.36350.358411
290.0160730.18610.426338
300.0353670.40940.341451
31-0.133579-1.54630.062197
320.0244510.2830.388793
33-0.038816-0.44930.326961
34-0.100442-1.16270.12351
35-0.092779-1.0740.142377
36-0.069547-0.80510.211104
370.0255580.29590.3839
38-0.068199-0.78950.21562
390.0483620.55980.288265
40-0.002618-0.03030.487934
41-0.073733-0.85350.197447
420.0827480.95790.169924
43-0.027432-0.31750.37566
44-0.050704-0.58690.279116
450.0176140.20390.419371
460.1259571.45810.073583
47-0.038736-0.44840.327294
480.0187680.21730.414171


Parameters (Session):
par1 = 48 ; par2 = 1 ; par3 = 1 ; par4 = 0 ; par5 = 12 ; par6 = White Noise ; par7 = 0.95 ;
Parameters (R input):
par1 = 48 ; par2 = 1 ; par3 = 1 ; par4 = 0 ; par5 = 12 ; par6 = White Noise ; par7 = 0.95 ; par8 = ;
R code (references can be found in the software module):
if (par1 == 'Default') {
par1 = 10*log10(length(x))
} else {
par1 <- as.numeric(par1)
}
par2 <- as.numeric(par2)
par3 <- as.numeric(par3)
par4 <- as.numeric(par4)
par5 <- as.numeric(par5)
if (par6 == 'White Noise') par6 <- 'white' else par6 <- 'ma'
par7 <- as.numeric(par7)
if (par8 != '') par8 <- as.numeric(par8)
x <- na.omit(x)
ox <- x
if (par8 == '') {
if (par2 == 0) {
x <- log(x)
} else {
x <- (x ^ par2 - 1) / par2
}
} else {
x <- log(x,base=par8)
}
if (par3 > 0) x <- diff(x,lag=1,difference=par3)
if (par4 > 0) x <- diff(x,lag=par5,difference=par4)
bitmap(file='picts.png')
op <- par(mfrow=c(2,1))
plot(ox,type='l',main='Original Time Series',xlab='time',ylab='value')
if (par8=='') {
mytitle <- paste('Working Time Series (lambda=',par2,', d=',par3,', D=',par4,')',sep='')
mysub <- paste('(lambda=',par2,', d=',par3,', D=',par4,', CI=', par7, ', CI type=',par6,')',sep='')
} else {
mytitle <- paste('Working Time Series (base=',par8,', d=',par3,', D=',par4,')',sep='')
mysub <- paste('(base=',par8,', d=',par3,', D=',par4,', CI=', par7, ', CI type=',par6,')',sep='')
}
plot(x,type='l', main=mytitle,xlab='time',ylab='value')
par(op)
dev.off()
bitmap(file='pic1.png')
racf <- acf(x, par1, main='Autocorrelation', xlab='time lag', ylab='ACF', ci.type=par6, ci=par7, sub=mysub)
dev.off()
bitmap(file='pic2.png')
rpacf <- pacf(x,par1,main='Partial Autocorrelation',xlab='lags',ylab='PACF',sub=mysub)
dev.off()
(myacf <- c(racf$acf))
(mypacf <- c(rpacf$acf))
lengthx <- length(x)
sqrtn <- sqrt(lengthx)
load(file='createtable')
a<-table.start()
a<-table.row.start(a)
a<-table.element(a,'Autocorrelation Function',4,TRUE)
a<-table.row.end(a)
a<-table.row.start(a)
a<-table.element(a,'Time lag k',header=TRUE)
a<-table.element(a,'ACF(k)',header=TRUE)
a<-table.element(a,'T-STAT',header=TRUE)
a<-table.element(a,'P-value',header=TRUE)
a<-table.row.end(a)
for (i in 2:(par1+1)) {
a<-table.row.start(a)
a<-table.element(a,i-1,header=TRUE)
a<-table.element(a,round(myacf[i],6))
mytstat <- myacf[i]*sqrtn
a<-table.element(a,round(mytstat,4))
a<-table.element(a,round(1-pt(abs(mytstat),lengthx),6))
a<-table.row.end(a)
}
a<-table.end(a)
table.save(a,file='mytable.tab')
a<-table.start()
a<-table.row.start(a)
a<-table.element(a,'Partial Autocorrelation Function',4,TRUE)
a<-table.row.end(a)
a<-table.row.start(a)
a<-table.element(a,'Time lag k',header=TRUE)
a<-table.element(a,'PACF(k)',header=TRUE)
a<-table.element(a,'T-STAT',header=TRUE)
a<-table.element(a,'P-value',header=TRUE)
a<-table.row.end(a)
for (i in 1:par1) {
a<-table.row.start(a)
a<-table.element(a,i,header=TRUE)
a<-table.element(a,round(mypacf[i],6))
mytstat <- mypacf[i]*sqrtn
a<-table.element(a,round(mytstat,4))
a<-table.element(a,round(1-pt(abs(mytstat),lengthx),6))
a<-table.row.end(a)
}
a<-table.end(a)
table.save(a,file='mytable1.tab')