Free Statistics

of Irreproducible Research!

Author's title

Author*The author of this computation has been verified*
R Software Modulerwasp_decompose.wasp
Title produced by softwareClassical Decomposition
Date of computationSun, 18 Dec 2016 16:28:35 +0100
Cite this page as followsStatistical Computations at FreeStatistics.org, Office for Research Development and Education, URL https://freestatistics.org/blog/index.php?v=date/2016/Dec/18/t14820749542c2rabelqf4930d.htm/, Retrieved Wed, 08 May 2024 23:51:45 +0000
Statistical Computations at FreeStatistics.org, Office for Research Development and Education, URL https://freestatistics.org/blog/index.php?pk=301138, Retrieved Wed, 08 May 2024 23:51:45 +0000
QR Codes:

Original text written by user:
IsPrivate?No (this computation is public)
User-defined keywords
Estimated Impact63
Family? (F = Feedback message, R = changed R code, M = changed R Module, P = changed Parameters, D = changed Data)
-       [Classical Decomposition] [] [2016-12-18 15:28:35] [1a4fa2544711480e714211476e711237] [Current]
Feedback Forum

Post a new message
Dataseries X:
142.2
162.3
143.4
257.1
235.8
188.1
190.2
298.2
363.6
325.2
321
391.8
481.5
416.7
603
499.2
551.4
613.5
776.1
956.4
1351.2
1593.6
1488.6
1361.7
1774.8
1893
1716.9
1453.8
1869.6
2110.8
2106.9
2845.2
3255
4645.8
4773
6724.2
9043.8
9135.3
11113.8
14501.4
19131.3


Summary of computational transaction
Raw Input view raw input (R code)
Raw Outputview raw output of R engine
Computing time2 seconds
R ServerBig Analytics Cloud Computing Center

\begin{tabular}{lllllllll}
\hline
Summary of computational transaction \tabularnewline
Raw Input view raw input (R code)  \tabularnewline
Raw Outputview raw output of R engine  \tabularnewline
Computing time2 seconds \tabularnewline
R ServerBig Analytics Cloud Computing Center \tabularnewline
\hline
\end{tabular}
%Source: https://freestatistics.org/blog/index.php?pk=301138&T=0

[TABLE]
[ROW]
Summary of computational transaction[/C][/ROW] [ROW]Raw Input[/C] view raw input (R code) [/C][/ROW] [ROW]Raw Output[/C]view raw output of R engine [/C][/ROW] [ROW]Computing time[/C]2 seconds[/C][/ROW] [ROW]R Server[/C]Big Analytics Cloud Computing Center[/C][/ROW] [/TABLE] Source: https://freestatistics.org/blog/index.php?pk=301138&T=0

Globally Unique Identifier (entire table): ba.freestatistics.org/blog/index.php?pk=301138&T=0

As an alternative you can also use a QR Code:  

The GUIDs for individual cells are displayed in the table below:

Summary of computational transaction
Raw Input view raw input (R code)
Raw Outputview raw output of R engine
Computing time2 seconds
R ServerBig Analytics Cloud Computing Center


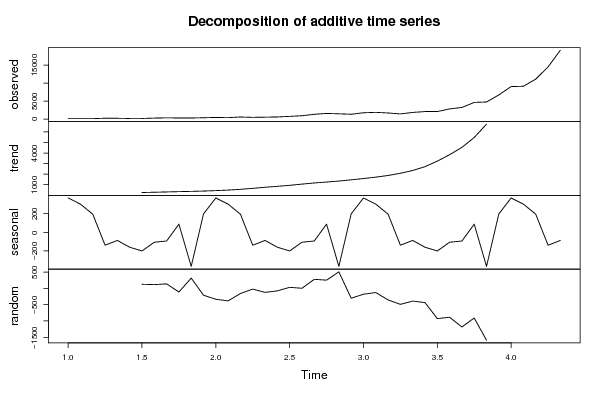
Classical Decomposition by Moving Averages
tObservationsFitTrendSeasonalRandom
1142.2NANA369.576NA
2162.3NANA303.282NA
3143.4NANA195.082NA
4257.1NANA-138.618NA
5235.8NANA-87.3806NA
6188.1NANA-160.406NA
7190.265.1111265.713-200.601125.089
8298.2183.79290.45-106.66114.41
9363.6226.549320.2-93.6514137.051
10325.2437.182349.43887.7444-111.982
113216.14444372.675-366.531314.856
12391.8601.713403.55198.163-209.913
13481.5815.263445.688369.576-333.763
14416.7800.807497.525303.282-384.107
15603761.182566.1195.082-158.182
16499.2521.482660.1-138.618-22.2819
17551.4674.219761.6-87.3806-122.819
18613.5690.257850.663-160.406-76.7569
19776.1744.361944.963-200.60131.7389
20956.4953.7031060.36-106.662.69722
211351.21074.641168.29-93.6514276.564
221593.61342.221254.4787.7444251.381
231488.6982.6441349.17-366.531505.956
241361.71664.651466.49198.163-302.951
251774.81953.91584.32369.576-179.101
2618932021.761718.47303.282-128.757
271716.92071.581876.5195.082-354.682
281453.81944.382083-138.618-490.582
291869.62259.642347.02-87.3806-390.044
302110.82546.912707.31-160.406-436.107
312106.93033.023233.62-200.601-926.124
322845.23731.63838.26-106.66-886.403
3332554437.914531.56-93.6514-1182.91
344645.85554.495466.7587.7444-908.694
3547736363.116729.64-366.531-1590.11
366724.2NANA198.163NA
379043.8NANA369.576NA
389135.3NANA303.282NA
3911113.8NANA195.082NA
4014501.4NANA-138.618NA
4119131.3NANA-87.3806NA

\begin{tabular}{lllllllll}
\hline
Classical Decomposition by Moving Averages \tabularnewline
t & Observations & Fit & Trend & Seasonal & Random \tabularnewline
1 & 142.2 & NA & NA & 369.576 & NA \tabularnewline
2 & 162.3 & NA & NA & 303.282 & NA \tabularnewline
3 & 143.4 & NA & NA & 195.082 & NA \tabularnewline
4 & 257.1 & NA & NA & -138.618 & NA \tabularnewline
5 & 235.8 & NA & NA & -87.3806 & NA \tabularnewline
6 & 188.1 & NA & NA & -160.406 & NA \tabularnewline
7 & 190.2 & 65.1111 & 265.713 & -200.601 & 125.089 \tabularnewline
8 & 298.2 & 183.79 & 290.45 & -106.66 & 114.41 \tabularnewline
9 & 363.6 & 226.549 & 320.2 & -93.6514 & 137.051 \tabularnewline
10 & 325.2 & 437.182 & 349.438 & 87.7444 & -111.982 \tabularnewline
11 & 321 & 6.14444 & 372.675 & -366.531 & 314.856 \tabularnewline
12 & 391.8 & 601.713 & 403.55 & 198.163 & -209.913 \tabularnewline
13 & 481.5 & 815.263 & 445.688 & 369.576 & -333.763 \tabularnewline
14 & 416.7 & 800.807 & 497.525 & 303.282 & -384.107 \tabularnewline
15 & 603 & 761.182 & 566.1 & 195.082 & -158.182 \tabularnewline
16 & 499.2 & 521.482 & 660.1 & -138.618 & -22.2819 \tabularnewline
17 & 551.4 & 674.219 & 761.6 & -87.3806 & -122.819 \tabularnewline
18 & 613.5 & 690.257 & 850.663 & -160.406 & -76.7569 \tabularnewline
19 & 776.1 & 744.361 & 944.963 & -200.601 & 31.7389 \tabularnewline
20 & 956.4 & 953.703 & 1060.36 & -106.66 & 2.69722 \tabularnewline
21 & 1351.2 & 1074.64 & 1168.29 & -93.6514 & 276.564 \tabularnewline
22 & 1593.6 & 1342.22 & 1254.47 & 87.7444 & 251.381 \tabularnewline
23 & 1488.6 & 982.644 & 1349.17 & -366.531 & 505.956 \tabularnewline
24 & 1361.7 & 1664.65 & 1466.49 & 198.163 & -302.951 \tabularnewline
25 & 1774.8 & 1953.9 & 1584.32 & 369.576 & -179.101 \tabularnewline
26 & 1893 & 2021.76 & 1718.47 & 303.282 & -128.757 \tabularnewline
27 & 1716.9 & 2071.58 & 1876.5 & 195.082 & -354.682 \tabularnewline
28 & 1453.8 & 1944.38 & 2083 & -138.618 & -490.582 \tabularnewline
29 & 1869.6 & 2259.64 & 2347.02 & -87.3806 & -390.044 \tabularnewline
30 & 2110.8 & 2546.91 & 2707.31 & -160.406 & -436.107 \tabularnewline
31 & 2106.9 & 3033.02 & 3233.62 & -200.601 & -926.124 \tabularnewline
32 & 2845.2 & 3731.6 & 3838.26 & -106.66 & -886.403 \tabularnewline
33 & 3255 & 4437.91 & 4531.56 & -93.6514 & -1182.91 \tabularnewline
34 & 4645.8 & 5554.49 & 5466.75 & 87.7444 & -908.694 \tabularnewline
35 & 4773 & 6363.11 & 6729.64 & -366.531 & -1590.11 \tabularnewline
36 & 6724.2 & NA & NA & 198.163 & NA \tabularnewline
37 & 9043.8 & NA & NA & 369.576 & NA \tabularnewline
38 & 9135.3 & NA & NA & 303.282 & NA \tabularnewline
39 & 11113.8 & NA & NA & 195.082 & NA \tabularnewline
40 & 14501.4 & NA & NA & -138.618 & NA \tabularnewline
41 & 19131.3 & NA & NA & -87.3806 & NA \tabularnewline
\hline
\end{tabular}
%Source: https://freestatistics.org/blog/index.php?pk=301138&T=1

[TABLE]
[ROW][C]Classical Decomposition by Moving Averages[/C][/ROW]
[ROW][C]t[/C][C]Observations[/C][C]Fit[/C][C]Trend[/C][C]Seasonal[/C][C]Random[/C][/ROW]
[ROW][C]1[/C][C]142.2[/C][C]NA[/C][C]NA[/C][C]369.576[/C][C]NA[/C][/ROW]
[ROW][C]2[/C][C]162.3[/C][C]NA[/C][C]NA[/C][C]303.282[/C][C]NA[/C][/ROW]
[ROW][C]3[/C][C]143.4[/C][C]NA[/C][C]NA[/C][C]195.082[/C][C]NA[/C][/ROW]
[ROW][C]4[/C][C]257.1[/C][C]NA[/C][C]NA[/C][C]-138.618[/C][C]NA[/C][/ROW]
[ROW][C]5[/C][C]235.8[/C][C]NA[/C][C]NA[/C][C]-87.3806[/C][C]NA[/C][/ROW]
[ROW][C]6[/C][C]188.1[/C][C]NA[/C][C]NA[/C][C]-160.406[/C][C]NA[/C][/ROW]
[ROW][C]7[/C][C]190.2[/C][C]65.1111[/C][C]265.713[/C][C]-200.601[/C][C]125.089[/C][/ROW]
[ROW][C]8[/C][C]298.2[/C][C]183.79[/C][C]290.45[/C][C]-106.66[/C][C]114.41[/C][/ROW]
[ROW][C]9[/C][C]363.6[/C][C]226.549[/C][C]320.2[/C][C]-93.6514[/C][C]137.051[/C][/ROW]
[ROW][C]10[/C][C]325.2[/C][C]437.182[/C][C]349.438[/C][C]87.7444[/C][C]-111.982[/C][/ROW]
[ROW][C]11[/C][C]321[/C][C]6.14444[/C][C]372.675[/C][C]-366.531[/C][C]314.856[/C][/ROW]
[ROW][C]12[/C][C]391.8[/C][C]601.713[/C][C]403.55[/C][C]198.163[/C][C]-209.913[/C][/ROW]
[ROW][C]13[/C][C]481.5[/C][C]815.263[/C][C]445.688[/C][C]369.576[/C][C]-333.763[/C][/ROW]
[ROW][C]14[/C][C]416.7[/C][C]800.807[/C][C]497.525[/C][C]303.282[/C][C]-384.107[/C][/ROW]
[ROW][C]15[/C][C]603[/C][C]761.182[/C][C]566.1[/C][C]195.082[/C][C]-158.182[/C][/ROW]
[ROW][C]16[/C][C]499.2[/C][C]521.482[/C][C]660.1[/C][C]-138.618[/C][C]-22.2819[/C][/ROW]
[ROW][C]17[/C][C]551.4[/C][C]674.219[/C][C]761.6[/C][C]-87.3806[/C][C]-122.819[/C][/ROW]
[ROW][C]18[/C][C]613.5[/C][C]690.257[/C][C]850.663[/C][C]-160.406[/C][C]-76.7569[/C][/ROW]
[ROW][C]19[/C][C]776.1[/C][C]744.361[/C][C]944.963[/C][C]-200.601[/C][C]31.7389[/C][/ROW]
[ROW][C]20[/C][C]956.4[/C][C]953.703[/C][C]1060.36[/C][C]-106.66[/C][C]2.69722[/C][/ROW]
[ROW][C]21[/C][C]1351.2[/C][C]1074.64[/C][C]1168.29[/C][C]-93.6514[/C][C]276.564[/C][/ROW]
[ROW][C]22[/C][C]1593.6[/C][C]1342.22[/C][C]1254.47[/C][C]87.7444[/C][C]251.381[/C][/ROW]
[ROW][C]23[/C][C]1488.6[/C][C]982.644[/C][C]1349.17[/C][C]-366.531[/C][C]505.956[/C][/ROW]
[ROW][C]24[/C][C]1361.7[/C][C]1664.65[/C][C]1466.49[/C][C]198.163[/C][C]-302.951[/C][/ROW]
[ROW][C]25[/C][C]1774.8[/C][C]1953.9[/C][C]1584.32[/C][C]369.576[/C][C]-179.101[/C][/ROW]
[ROW][C]26[/C][C]1893[/C][C]2021.76[/C][C]1718.47[/C][C]303.282[/C][C]-128.757[/C][/ROW]
[ROW][C]27[/C][C]1716.9[/C][C]2071.58[/C][C]1876.5[/C][C]195.082[/C][C]-354.682[/C][/ROW]
[ROW][C]28[/C][C]1453.8[/C][C]1944.38[/C][C]2083[/C][C]-138.618[/C][C]-490.582[/C][/ROW]
[ROW][C]29[/C][C]1869.6[/C][C]2259.64[/C][C]2347.02[/C][C]-87.3806[/C][C]-390.044[/C][/ROW]
[ROW][C]30[/C][C]2110.8[/C][C]2546.91[/C][C]2707.31[/C][C]-160.406[/C][C]-436.107[/C][/ROW]
[ROW][C]31[/C][C]2106.9[/C][C]3033.02[/C][C]3233.62[/C][C]-200.601[/C][C]-926.124[/C][/ROW]
[ROW][C]32[/C][C]2845.2[/C][C]3731.6[/C][C]3838.26[/C][C]-106.66[/C][C]-886.403[/C][/ROW]
[ROW][C]33[/C][C]3255[/C][C]4437.91[/C][C]4531.56[/C][C]-93.6514[/C][C]-1182.91[/C][/ROW]
[ROW][C]34[/C][C]4645.8[/C][C]5554.49[/C][C]5466.75[/C][C]87.7444[/C][C]-908.694[/C][/ROW]
[ROW][C]35[/C][C]4773[/C][C]6363.11[/C][C]6729.64[/C][C]-366.531[/C][C]-1590.11[/C][/ROW]
[ROW][C]36[/C][C]6724.2[/C][C]NA[/C][C]NA[/C][C]198.163[/C][C]NA[/C][/ROW]
[ROW][C]37[/C][C]9043.8[/C][C]NA[/C][C]NA[/C][C]369.576[/C][C]NA[/C][/ROW]
[ROW][C]38[/C][C]9135.3[/C][C]NA[/C][C]NA[/C][C]303.282[/C][C]NA[/C][/ROW]
[ROW][C]39[/C][C]11113.8[/C][C]NA[/C][C]NA[/C][C]195.082[/C][C]NA[/C][/ROW]
[ROW][C]40[/C][C]14501.4[/C][C]NA[/C][C]NA[/C][C]-138.618[/C][C]NA[/C][/ROW]
[ROW][C]41[/C][C]19131.3[/C][C]NA[/C][C]NA[/C][C]-87.3806[/C][C]NA[/C][/ROW]
[/TABLE]
Source: https://freestatistics.org/blog/index.php?pk=301138&T=1

Globally Unique Identifier (entire table): ba.freestatistics.org/blog/index.php?pk=301138&T=1

As an alternative you can also use a QR Code:  

The GUIDs for individual cells are displayed in the table below:

Classical Decomposition by Moving Averages
tObservationsFitTrendSeasonalRandom
1142.2NANA369.576NA
2162.3NANA303.282NA
3143.4NANA195.082NA
4257.1NANA-138.618NA
5235.8NANA-87.3806NA
6188.1NANA-160.406NA
7190.265.1111265.713-200.601125.089
8298.2183.79290.45-106.66114.41
9363.6226.549320.2-93.6514137.051
10325.2437.182349.43887.7444-111.982
113216.14444372.675-366.531314.856
12391.8601.713403.55198.163-209.913
13481.5815.263445.688369.576-333.763
14416.7800.807497.525303.282-384.107
15603761.182566.1195.082-158.182
16499.2521.482660.1-138.618-22.2819
17551.4674.219761.6-87.3806-122.819
18613.5690.257850.663-160.406-76.7569
19776.1744.361944.963-200.60131.7389
20956.4953.7031060.36-106.662.69722
211351.21074.641168.29-93.6514276.564
221593.61342.221254.4787.7444251.381
231488.6982.6441349.17-366.531505.956
241361.71664.651466.49198.163-302.951
251774.81953.91584.32369.576-179.101
2618932021.761718.47303.282-128.757
271716.92071.581876.5195.082-354.682
281453.81944.382083-138.618-490.582
291869.62259.642347.02-87.3806-390.044
302110.82546.912707.31-160.406-436.107
312106.93033.023233.62-200.601-926.124
322845.23731.63838.26-106.66-886.403
3332554437.914531.56-93.6514-1182.91
344645.85554.495466.7587.7444-908.694
3547736363.116729.64-366.531-1590.11
366724.2NANA198.163NA
379043.8NANA369.576NA
389135.3NANA303.282NA
3911113.8NANA195.082NA
4014501.4NANA-138.618NA
4119131.3NANA-87.3806NA


Parameters (Session):
Parameters (R input):
par1 = additive ; par2 = 12 ;
R code (references can be found in the software module):
par2 <- '12'
par1 <- 'additive'
par2 <- as.numeric(par2)
x <- ts(x,freq=par2)
m <- decompose(x,type=par1)
m$figure
bitmap(file='test1.png')
plot(m)
dev.off()
mylagmax <- length(x)/2
bitmap(file='test2.png')
op <- par(mfrow = c(2,2))
acf(as.numeric(x),lag.max = mylagmax,main='Observed')
acf(as.numeric(m$trend),na.action=na.pass,lag.max = mylagmax,main='Trend')
acf(as.numeric(m$seasonal),na.action=na.pass,lag.max = mylagmax,main='Seasonal')
acf(as.numeric(m$random),na.action=na.pass,lag.max = mylagmax,main='Random')
par(op)
dev.off()
bitmap(file='test3.png')
op <- par(mfrow = c(2,2))
spectrum(as.numeric(x),main='Observed')
spectrum(as.numeric(m$trend[!is.na(m$trend)]),main='Trend')
spectrum(as.numeric(m$seasonal[!is.na(m$seasonal)]),main='Seasonal')
spectrum(as.numeric(m$random[!is.na(m$random)]),main='Random')
par(op)
dev.off()
bitmap(file='test4.png')
op <- par(mfrow = c(2,2))
cpgram(as.numeric(x),main='Observed')
cpgram(as.numeric(m$trend[!is.na(m$trend)]),main='Trend')
cpgram(as.numeric(m$seasonal[!is.na(m$seasonal)]),main='Seasonal')
cpgram(as.numeric(m$random[!is.na(m$random)]),main='Random')
par(op)
dev.off()
load(file='createtable')
a<-table.start()
a<-table.row.start(a)
a<-table.element(a,'Classical Decomposition by Moving Averages',6,TRUE)
a<-table.row.end(a)
a<-table.row.start(a)
a<-table.element(a,'t',header=TRUE)
a<-table.element(a,'Observations',header=TRUE)
a<-table.element(a,'Fit',header=TRUE)
a<-table.element(a,'Trend',header=TRUE)
a<-table.element(a,'Seasonal',header=TRUE)
a<-table.element(a,'Random',header=TRUE)
a<-table.row.end(a)
for (i in 1:length(m$trend)) {
a<-table.row.start(a)
a<-table.element(a,i,header=TRUE)
a<-table.element(a,x[i])
if (par1 == 'additive') a<-table.element(a,signif(m$trend[i]+m$seasonal[i],6)) else a<-table.element(a,signif(m$trend[i]*m$seasonal[i],6))
a<-table.element(a,signif(m$trend[i],6))
a<-table.element(a,signif(m$seasonal[i],6))
a<-table.element(a,signif(m$random[i],6))
a<-table.row.end(a)
}
a<-table.end(a)
table.save(a,file='mytable.tab')