Free Statistics

of Irreproducible Research!

Author's title

Author*The author of this computation has been verified*
R Software Modulerwasp_exponentialsmoothing.wasp
Title produced by softwareExponential Smoothing
Date of computationSun, 18 Dec 2016 17:44:24 +0100
Cite this page as followsStatistical Computations at FreeStatistics.org, Office for Research Development and Education, URL https://freestatistics.org/blog/index.php?v=date/2016/Dec/18/t1482079499wtitmh6cs19kj19.htm/, Retrieved Wed, 08 May 2024 13:28:08 +0000
Statistical Computations at FreeStatistics.org, Office for Research Development and Education, URL https://freestatistics.org/blog/index.php?pk=301174, Retrieved Wed, 08 May 2024 13:28:08 +0000
QR Codes:

Original text written by user:
IsPrivate?No (this computation is public)
User-defined keywords
Estimated Impact52
Family? (F = Feedback message, R = changed R code, M = changed R Module, P = changed Parameters, D = changed Data)
-       [Exponential Smoothing] [N1030 Exponential...] [2016-12-18 16:44:24] [2e11ca31a00cf8de75c33c1af2d59434] [Current]
Feedback Forum

Post a new message
Dataseries X:
3203.4
3248.4
3446.2
3448.6
3535
3586.8
3722.4
3796.6
3755
3654.4
3485.2
3348.6
3177
3207.2
3236.2
3358.8
3436
3563.2
3588.8
3645.4
3801.2
3856.2
4056.4
3894.4
3844.4
3712.2
3765.4
3874.8
3777
3879.2
3879
4043.2
4118.8
4103.2
4188.8
4496.6
4646
4710
4713
4440
4498.2
4266.6
4253.4
4133.2


Summary of computational transaction
Raw Input view raw input (R code)
Raw Outputview raw output of R engine
Computing time2 seconds
R ServerBig Analytics Cloud Computing Center

\begin{tabular}{lllllllll}
\hline
Summary of computational transaction \tabularnewline
Raw Input view raw input (R code)  \tabularnewline
Raw Outputview raw output of R engine  \tabularnewline
Computing time2 seconds \tabularnewline
R ServerBig Analytics Cloud Computing Center \tabularnewline
\hline
\end{tabular}
%Source: https://freestatistics.org/blog/index.php?pk=301174&T=0

[TABLE]
[ROW]
Summary of computational transaction[/C][/ROW] [ROW]Raw Input[/C] view raw input (R code) [/C][/ROW] [ROW]Raw Output[/C]view raw output of R engine [/C][/ROW] [ROW]Computing time[/C]2 seconds[/C][/ROW] [ROW]R Server[/C]Big Analytics Cloud Computing Center[/C][/ROW] [/TABLE] Source: https://freestatistics.org/blog/index.php?pk=301174&T=0

Globally Unique Identifier (entire table): ba.freestatistics.org/blog/index.php?pk=301174&T=0

As an alternative you can also use a QR Code:  

The GUIDs for individual cells are displayed in the table below:

Summary of computational transaction
Raw Input view raw input (R code)
Raw Outputview raw output of R engine
Computing time2 seconds
R ServerBig Analytics Cloud Computing Center


Estimated Parameters of Exponential Smoothing
ParameterValue
alpha1
beta0.000966614832034376
gamma0

\begin{tabular}{lllllllll}
\hline
Estimated Parameters of Exponential Smoothing \tabularnewline
Parameter & Value \tabularnewline
alpha & 1 \tabularnewline
beta & 0.000966614832034376 \tabularnewline
gamma & 0 \tabularnewline
\hline
\end{tabular}
%Source: https://freestatistics.org/blog/index.php?pk=301174&T=1

[TABLE]
[ROW][C]Estimated Parameters of Exponential Smoothing[/C][/ROW]
[ROW][C]Parameter[/C][C]Value[/C][/ROW]
[ROW][C]alpha[/C][C]1[/C][/ROW]
[ROW][C]beta[/C][C]0.000966614832034376[/C][/ROW]
[ROW][C]gamma[/C][C]0[/C][/ROW]
[/TABLE]
Source: https://freestatistics.org/blog/index.php?pk=301174&T=1

Globally Unique Identifier (entire table): ba.freestatistics.org/blog/index.php?pk=301174&T=1

As an alternative you can also use a QR Code:  

The GUIDs for individual cells are displayed in the table below:

Estimated Parameters of Exponential Smoothing
ParameterValue
alpha1
beta0.000966614832034376
gamma0


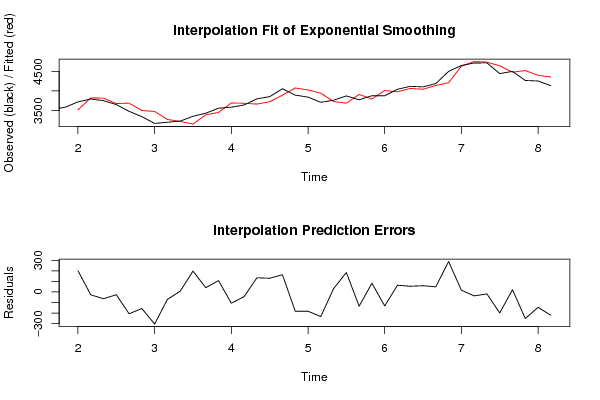
Interpolation Forecasts of Exponential Smoothing
tObservedFittedResiduals
73722.43521.08134920635201.318650793651
83796.63823.39316902239-26.7931690223936
937553818.76727034782-63.7672703478192
103654.43680.53896529184-26.138965291836
113485.23691.54703231363-206.347032313625
123348.63505.06424087831-156.46424087831
1331773480.64633355573-303.646333555728
143207.23277.23615783935-70.0361578393536
153236.23228.568459850417.63154014959309
163358.83161.00916994364197.79083005636
1734363395.4336908269540.5663091730526
183563.23455.58956948974107.610430510259
193588.83695.22692066129-106.426920661287
203645.43689.20738015458-43.8073801545811
213801.23666.96503529117134.234964708829
223856.23726.32812213237129.87187786763
234056.43893.08699154911163.313008450886
243894.44076.36151899201-181.961518992013
253844.44026.51896562223-182.11896562223
263712.23944.8262600622-232.626260062198
273765.43733.601400068931.7985999310995
283874.83690.26547040057184.534529599435
2937773911.47717754723-134.477177547233
303879.23796.4638565795182.7361434204881
3138794011.07716389622-132.077163896221
324043.23979.2328294839663.9671705160413
334118.84064.6946610997454.1053389002577
344103.24043.7802934561559.4197065438502
354188.84139.8710627591448.9289372408566
364496.64208.43502486226288.164975137738
3746464628.8469027346417.1530972653627
3847104746.7468165062-36.7468165062019
3947134731.91129648834-18.911296488337
4044404638.32634988199-198.326349881992
414498.24476.7679780239521.432021976053
424266.64517.90536120093-251.305361200934
434253.44398.39577904476-144.995779044763
444133.24353.53895730749-220.338957307488

\begin{tabular}{lllllllll}
\hline
Interpolation Forecasts of Exponential Smoothing \tabularnewline
t & Observed & Fitted & Residuals \tabularnewline
7 & 3722.4 & 3521.08134920635 & 201.318650793651 \tabularnewline
8 & 3796.6 & 3823.39316902239 & -26.7931690223936 \tabularnewline
9 & 3755 & 3818.76727034782 & -63.7672703478192 \tabularnewline
10 & 3654.4 & 3680.53896529184 & -26.138965291836 \tabularnewline
11 & 3485.2 & 3691.54703231363 & -206.347032313625 \tabularnewline
12 & 3348.6 & 3505.06424087831 & -156.46424087831 \tabularnewline
13 & 3177 & 3480.64633355573 & -303.646333555728 \tabularnewline
14 & 3207.2 & 3277.23615783935 & -70.0361578393536 \tabularnewline
15 & 3236.2 & 3228.56845985041 & 7.63154014959309 \tabularnewline
16 & 3358.8 & 3161.00916994364 & 197.79083005636 \tabularnewline
17 & 3436 & 3395.43369082695 & 40.5663091730526 \tabularnewline
18 & 3563.2 & 3455.58956948974 & 107.610430510259 \tabularnewline
19 & 3588.8 & 3695.22692066129 & -106.426920661287 \tabularnewline
20 & 3645.4 & 3689.20738015458 & -43.8073801545811 \tabularnewline
21 & 3801.2 & 3666.96503529117 & 134.234964708829 \tabularnewline
22 & 3856.2 & 3726.32812213237 & 129.87187786763 \tabularnewline
23 & 4056.4 & 3893.08699154911 & 163.313008450886 \tabularnewline
24 & 3894.4 & 4076.36151899201 & -181.961518992013 \tabularnewline
25 & 3844.4 & 4026.51896562223 & -182.11896562223 \tabularnewline
26 & 3712.2 & 3944.8262600622 & -232.626260062198 \tabularnewline
27 & 3765.4 & 3733.6014000689 & 31.7985999310995 \tabularnewline
28 & 3874.8 & 3690.26547040057 & 184.534529599435 \tabularnewline
29 & 3777 & 3911.47717754723 & -134.477177547233 \tabularnewline
30 & 3879.2 & 3796.46385657951 & 82.7361434204881 \tabularnewline
31 & 3879 & 4011.07716389622 & -132.077163896221 \tabularnewline
32 & 4043.2 & 3979.23282948396 & 63.9671705160413 \tabularnewline
33 & 4118.8 & 4064.69466109974 & 54.1053389002577 \tabularnewline
34 & 4103.2 & 4043.78029345615 & 59.4197065438502 \tabularnewline
35 & 4188.8 & 4139.87106275914 & 48.9289372408566 \tabularnewline
36 & 4496.6 & 4208.43502486226 & 288.164975137738 \tabularnewline
37 & 4646 & 4628.84690273464 & 17.1530972653627 \tabularnewline
38 & 4710 & 4746.7468165062 & -36.7468165062019 \tabularnewline
39 & 4713 & 4731.91129648834 & -18.911296488337 \tabularnewline
40 & 4440 & 4638.32634988199 & -198.326349881992 \tabularnewline
41 & 4498.2 & 4476.76797802395 & 21.432021976053 \tabularnewline
42 & 4266.6 & 4517.90536120093 & -251.305361200934 \tabularnewline
43 & 4253.4 & 4398.39577904476 & -144.995779044763 \tabularnewline
44 & 4133.2 & 4353.53895730749 & -220.338957307488 \tabularnewline
\hline
\end{tabular}
%Source: https://freestatistics.org/blog/index.php?pk=301174&T=2

[TABLE]
[ROW][C]Interpolation Forecasts of Exponential Smoothing[/C][/ROW]
[ROW][C]t[/C][C]Observed[/C][C]Fitted[/C][C]Residuals[/C][/ROW]
[ROW][C]7[/C][C]3722.4[/C][C]3521.08134920635[/C][C]201.318650793651[/C][/ROW]
[ROW][C]8[/C][C]3796.6[/C][C]3823.39316902239[/C][C]-26.7931690223936[/C][/ROW]
[ROW][C]9[/C][C]3755[/C][C]3818.76727034782[/C][C]-63.7672703478192[/C][/ROW]
[ROW][C]10[/C][C]3654.4[/C][C]3680.53896529184[/C][C]-26.138965291836[/C][/ROW]
[ROW][C]11[/C][C]3485.2[/C][C]3691.54703231363[/C][C]-206.347032313625[/C][/ROW]
[ROW][C]12[/C][C]3348.6[/C][C]3505.06424087831[/C][C]-156.46424087831[/C][/ROW]
[ROW][C]13[/C][C]3177[/C][C]3480.64633355573[/C][C]-303.646333555728[/C][/ROW]
[ROW][C]14[/C][C]3207.2[/C][C]3277.23615783935[/C][C]-70.0361578393536[/C][/ROW]
[ROW][C]15[/C][C]3236.2[/C][C]3228.56845985041[/C][C]7.63154014959309[/C][/ROW]
[ROW][C]16[/C][C]3358.8[/C][C]3161.00916994364[/C][C]197.79083005636[/C][/ROW]
[ROW][C]17[/C][C]3436[/C][C]3395.43369082695[/C][C]40.5663091730526[/C][/ROW]
[ROW][C]18[/C][C]3563.2[/C][C]3455.58956948974[/C][C]107.610430510259[/C][/ROW]
[ROW][C]19[/C][C]3588.8[/C][C]3695.22692066129[/C][C]-106.426920661287[/C][/ROW]
[ROW][C]20[/C][C]3645.4[/C][C]3689.20738015458[/C][C]-43.8073801545811[/C][/ROW]
[ROW][C]21[/C][C]3801.2[/C][C]3666.96503529117[/C][C]134.234964708829[/C][/ROW]
[ROW][C]22[/C][C]3856.2[/C][C]3726.32812213237[/C][C]129.87187786763[/C][/ROW]
[ROW][C]23[/C][C]4056.4[/C][C]3893.08699154911[/C][C]163.313008450886[/C][/ROW]
[ROW][C]24[/C][C]3894.4[/C][C]4076.36151899201[/C][C]-181.961518992013[/C][/ROW]
[ROW][C]25[/C][C]3844.4[/C][C]4026.51896562223[/C][C]-182.11896562223[/C][/ROW]
[ROW][C]26[/C][C]3712.2[/C][C]3944.8262600622[/C][C]-232.626260062198[/C][/ROW]
[ROW][C]27[/C][C]3765.4[/C][C]3733.6014000689[/C][C]31.7985999310995[/C][/ROW]
[ROW][C]28[/C][C]3874.8[/C][C]3690.26547040057[/C][C]184.534529599435[/C][/ROW]
[ROW][C]29[/C][C]3777[/C][C]3911.47717754723[/C][C]-134.477177547233[/C][/ROW]
[ROW][C]30[/C][C]3879.2[/C][C]3796.46385657951[/C][C]82.7361434204881[/C][/ROW]
[ROW][C]31[/C][C]3879[/C][C]4011.07716389622[/C][C]-132.077163896221[/C][/ROW]
[ROW][C]32[/C][C]4043.2[/C][C]3979.23282948396[/C][C]63.9671705160413[/C][/ROW]
[ROW][C]33[/C][C]4118.8[/C][C]4064.69466109974[/C][C]54.1053389002577[/C][/ROW]
[ROW][C]34[/C][C]4103.2[/C][C]4043.78029345615[/C][C]59.4197065438502[/C][/ROW]
[ROW][C]35[/C][C]4188.8[/C][C]4139.87106275914[/C][C]48.9289372408566[/C][/ROW]
[ROW][C]36[/C][C]4496.6[/C][C]4208.43502486226[/C][C]288.164975137738[/C][/ROW]
[ROW][C]37[/C][C]4646[/C][C]4628.84690273464[/C][C]17.1530972653627[/C][/ROW]
[ROW][C]38[/C][C]4710[/C][C]4746.7468165062[/C][C]-36.7468165062019[/C][/ROW]
[ROW][C]39[/C][C]4713[/C][C]4731.91129648834[/C][C]-18.911296488337[/C][/ROW]
[ROW][C]40[/C][C]4440[/C][C]4638.32634988199[/C][C]-198.326349881992[/C][/ROW]
[ROW][C]41[/C][C]4498.2[/C][C]4476.76797802395[/C][C]21.432021976053[/C][/ROW]
[ROW][C]42[/C][C]4266.6[/C][C]4517.90536120093[/C][C]-251.305361200934[/C][/ROW]
[ROW][C]43[/C][C]4253.4[/C][C]4398.39577904476[/C][C]-144.995779044763[/C][/ROW]
[ROW][C]44[/C][C]4133.2[/C][C]4353.53895730749[/C][C]-220.338957307488[/C][/ROW]
[/TABLE]
Source: https://freestatistics.org/blog/index.php?pk=301174&T=2

Globally Unique Identifier (entire table): ba.freestatistics.org/blog/index.php?pk=301174&T=2

As an alternative you can also use a QR Code:  

The GUIDs for individual cells are displayed in the table below:

Interpolation Forecasts of Exponential Smoothing
tObservedFittedResiduals
73722.43521.08134920635201.318650793651
83796.63823.39316902239-26.7931690223936
937553818.76727034782-63.7672703478192
103654.43680.53896529184-26.138965291836
113485.23691.54703231363-206.347032313625
123348.63505.06424087831-156.46424087831
1331773480.64633355573-303.646333555728
143207.23277.23615783935-70.0361578393536
153236.23228.568459850417.63154014959309
163358.83161.00916994364197.79083005636
1734363395.4336908269540.5663091730526
183563.23455.58956948974107.610430510259
193588.83695.22692066129-106.426920661287
203645.43689.20738015458-43.8073801545811
213801.23666.96503529117134.234964708829
223856.23726.32812213237129.87187786763
234056.43893.08699154911163.313008450886
243894.44076.36151899201-181.961518992013
253844.44026.51896562223-182.11896562223
263712.23944.8262600622-232.626260062198
273765.43733.601400068931.7985999310995
283874.83690.26547040057184.534529599435
2937773911.47717754723-134.477177547233
303879.23796.4638565795182.7361434204881
3138794011.07716389622-132.077163896221
324043.23979.2328294839663.9671705160413
334118.84064.6946610997454.1053389002577
344103.24043.7802934561559.4197065438502
354188.84139.8710627591448.9289372408566
364496.64208.43502486226288.164975137738
3746464628.8469027346417.1530972653627
3847104746.7468165062-36.7468165062019
3947134731.91129648834-18.911296488337
4044404638.32634988199-198.326349881992
414498.24476.7679780239521.432021976053
424266.64517.90536120093-251.305361200934
434253.44398.39577904476-144.995779044763
444133.24353.53895730749-220.338957307488


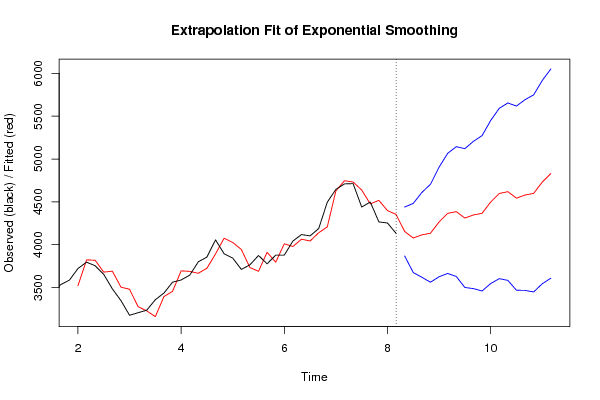
Extrapolation Forecasts of Exponential Smoothing
tForecast95% Lower Bound95% Upper Bound
454154.325974403283868.976279585484439.67566922108
464078.885282139893675.144790112424482.62577416737
474115.077923209843620.359860201374609.79598621831
484134.187230946453562.660038782924705.71442310998
494265.62987201643626.334442965054904.92530106775
504365.555846419683664.904680221665066.2070126177
514386.681820822963629.526805779595143.83683586633
524311.241128559573501.417828021155121.064429098
534347.433769629523488.072150332725206.79538892632
544366.543077366133460.259615728075272.8265390042
554497.985718436083547.009435552735448.96200131943
564597.911692839363604.170741594415591.65264408431
574619.037667242643584.221051740465653.85428274482
584543.596974979253469.199892249585617.99405770893
594579.78961604923467.147615532365692.43161656603
604598.898923785813449.214197574095748.58364999753
614730.341564855763544.703555745815915.97957396571
624830.267539259043609.669353795826050.86572472226

\begin{tabular}{lllllllll}
\hline
Extrapolation Forecasts of Exponential Smoothing \tabularnewline
t & Forecast & 95% Lower Bound & 95% Upper Bound \tabularnewline
45 & 4154.32597440328 & 3868.97627958548 & 4439.67566922108 \tabularnewline
46 & 4078.88528213989 & 3675.14479011242 & 4482.62577416737 \tabularnewline
47 & 4115.07792320984 & 3620.35986020137 & 4609.79598621831 \tabularnewline
48 & 4134.18723094645 & 3562.66003878292 & 4705.71442310998 \tabularnewline
49 & 4265.6298720164 & 3626.33444296505 & 4904.92530106775 \tabularnewline
50 & 4365.55584641968 & 3664.90468022166 & 5066.2070126177 \tabularnewline
51 & 4386.68182082296 & 3629.52680577959 & 5143.83683586633 \tabularnewline
52 & 4311.24112855957 & 3501.41782802115 & 5121.064429098 \tabularnewline
53 & 4347.43376962952 & 3488.07215033272 & 5206.79538892632 \tabularnewline
54 & 4366.54307736613 & 3460.25961572807 & 5272.8265390042 \tabularnewline
55 & 4497.98571843608 & 3547.00943555273 & 5448.96200131943 \tabularnewline
56 & 4597.91169283936 & 3604.17074159441 & 5591.65264408431 \tabularnewline
57 & 4619.03766724264 & 3584.22105174046 & 5653.85428274482 \tabularnewline
58 & 4543.59697497925 & 3469.19989224958 & 5617.99405770893 \tabularnewline
59 & 4579.7896160492 & 3467.14761553236 & 5692.43161656603 \tabularnewline
60 & 4598.89892378581 & 3449.21419757409 & 5748.58364999753 \tabularnewline
61 & 4730.34156485576 & 3544.70355574581 & 5915.97957396571 \tabularnewline
62 & 4830.26753925904 & 3609.66935379582 & 6050.86572472226 \tabularnewline
\hline
\end{tabular}
%Source: https://freestatistics.org/blog/index.php?pk=301174&T=3

[TABLE]
[ROW][C]Extrapolation Forecasts of Exponential Smoothing[/C][/ROW]
[ROW][C]t[/C][C]Forecast[/C][C]95% Lower Bound[/C][C]95% Upper Bound[/C][/ROW]
[ROW][C]45[/C][C]4154.32597440328[/C][C]3868.97627958548[/C][C]4439.67566922108[/C][/ROW]
[ROW][C]46[/C][C]4078.88528213989[/C][C]3675.14479011242[/C][C]4482.62577416737[/C][/ROW]
[ROW][C]47[/C][C]4115.07792320984[/C][C]3620.35986020137[/C][C]4609.79598621831[/C][/ROW]
[ROW][C]48[/C][C]4134.18723094645[/C][C]3562.66003878292[/C][C]4705.71442310998[/C][/ROW]
[ROW][C]49[/C][C]4265.6298720164[/C][C]3626.33444296505[/C][C]4904.92530106775[/C][/ROW]
[ROW][C]50[/C][C]4365.55584641968[/C][C]3664.90468022166[/C][C]5066.2070126177[/C][/ROW]
[ROW][C]51[/C][C]4386.68182082296[/C][C]3629.52680577959[/C][C]5143.83683586633[/C][/ROW]
[ROW][C]52[/C][C]4311.24112855957[/C][C]3501.41782802115[/C][C]5121.064429098[/C][/ROW]
[ROW][C]53[/C][C]4347.43376962952[/C][C]3488.07215033272[/C][C]5206.79538892632[/C][/ROW]
[ROW][C]54[/C][C]4366.54307736613[/C][C]3460.25961572807[/C][C]5272.8265390042[/C][/ROW]
[ROW][C]55[/C][C]4497.98571843608[/C][C]3547.00943555273[/C][C]5448.96200131943[/C][/ROW]
[ROW][C]56[/C][C]4597.91169283936[/C][C]3604.17074159441[/C][C]5591.65264408431[/C][/ROW]
[ROW][C]57[/C][C]4619.03766724264[/C][C]3584.22105174046[/C][C]5653.85428274482[/C][/ROW]
[ROW][C]58[/C][C]4543.59697497925[/C][C]3469.19989224958[/C][C]5617.99405770893[/C][/ROW]
[ROW][C]59[/C][C]4579.7896160492[/C][C]3467.14761553236[/C][C]5692.43161656603[/C][/ROW]
[ROW][C]60[/C][C]4598.89892378581[/C][C]3449.21419757409[/C][C]5748.58364999753[/C][/ROW]
[ROW][C]61[/C][C]4730.34156485576[/C][C]3544.70355574581[/C][C]5915.97957396571[/C][/ROW]
[ROW][C]62[/C][C]4830.26753925904[/C][C]3609.66935379582[/C][C]6050.86572472226[/C][/ROW]
[/TABLE]
Source: https://freestatistics.org/blog/index.php?pk=301174&T=3

Globally Unique Identifier (entire table): ba.freestatistics.org/blog/index.php?pk=301174&T=3

As an alternative you can also use a QR Code:  

The GUIDs for individual cells are displayed in the table below:

Extrapolation Forecasts of Exponential Smoothing
tForecast95% Lower Bound95% Upper Bound
454154.325974403283868.976279585484439.67566922108
464078.885282139893675.144790112424482.62577416737
474115.077923209843620.359860201374609.79598621831
484134.187230946453562.660038782924705.71442310998
494265.62987201643626.334442965054904.92530106775
504365.555846419683664.904680221665066.2070126177
514386.681820822963629.526805779595143.83683586633
524311.241128559573501.417828021155121.064429098
534347.433769629523488.072150332725206.79538892632
544366.543077366133460.259615728075272.8265390042
554497.985718436083547.009435552735448.96200131943
564597.911692839363604.170741594415591.65264408431
574619.037667242643584.221051740465653.85428274482
584543.596974979253469.199892249585617.99405770893
594579.78961604923467.147615532365692.43161656603
604598.898923785813449.214197574095748.58364999753
614730.341564855763544.703555745815915.97957396571
624830.267539259043609.669353795826050.86572472226


Parameters (Session):
par1 = 6 ; par2 = Double ; par3 = additive ; par4 = 12 ;
Parameters (R input):
par1 = 6 ; par2 = Triple ; par3 = additive ; par4 = 18 ;
R code (references can be found in the software module):
par4 <- '18'
par3 <- 'additive'
par2 <- 'Triple'
par1 <- '12'
par1 <- as.numeric(par1)
par4 <- as.numeric(par4)
if (par2 == 'Single') K <- 1
if (par2 == 'Double') K <- 2
if (par2 == 'Triple') K <- par1
nx <- length(x)
nxmK <- nx - K
x <- ts(x, frequency = par1)
if (par2 == 'Single') fit <- HoltWinters(x, gamma=F, beta=F)
if (par2 == 'Double') fit <- HoltWinters(x, gamma=F)
if (par2 == 'Triple') fit <- HoltWinters(x, seasonal=par3)
fit
myresid <- x - fit$fitted[,'xhat']
bitmap(file='test1.png')
op <- par(mfrow=c(2,1))
plot(fit,ylab='Observed (black) / Fitted (red)',main='Interpolation Fit of Exponential Smoothing')
plot(myresid,ylab='Residuals',main='Interpolation Prediction Errors')
par(op)
dev.off()
bitmap(file='test2.png')
p <- predict(fit, par4, prediction.interval=TRUE)
np <- length(p[,1])
plot(fit,p,ylab='Observed (black) / Fitted (red)',main='Extrapolation Fit of Exponential Smoothing')
dev.off()
bitmap(file='test3.png')
op <- par(mfrow = c(2,2))
acf(as.numeric(myresid),lag.max = nx/2,main='Residual ACF')
spectrum(myresid,main='Residals Periodogram')
cpgram(myresid,main='Residal Cumulative Periodogram')
qqnorm(myresid,main='Residual Normal QQ Plot')
qqline(myresid)
par(op)
dev.off()
load(file='createtable')
a<-table.start()
a<-table.row.start(a)
a<-table.element(a,'Estimated Parameters of Exponential Smoothing',2,TRUE)
a<-table.row.end(a)
a<-table.row.start(a)
a<-table.element(a,'Parameter',header=TRUE)
a<-table.element(a,'Value',header=TRUE)
a<-table.row.end(a)
a<-table.row.start(a)
a<-table.element(a,'alpha',header=TRUE)
a<-table.element(a,fit$alpha)
a<-table.row.end(a)
a<-table.row.start(a)
a<-table.element(a,'beta',header=TRUE)
a<-table.element(a,fit$beta)
a<-table.row.end(a)
a<-table.row.start(a)
a<-table.element(a,'gamma',header=TRUE)
a<-table.element(a,fit$gamma)
a<-table.row.end(a)
a<-table.end(a)
table.save(a,file='mytable.tab')
a<-table.start()
a<-table.row.start(a)
a<-table.element(a,'Interpolation Forecasts of Exponential Smoothing',4,TRUE)
a<-table.row.end(a)
a<-table.row.start(a)
a<-table.element(a,'t',header=TRUE)
a<-table.element(a,'Observed',header=TRUE)
a<-table.element(a,'Fitted',header=TRUE)
a<-table.element(a,'Residuals',header=TRUE)
a<-table.row.end(a)
for (i in 1:nxmK) {
a<-table.row.start(a)
a<-table.element(a,i+K,header=TRUE)
a<-table.element(a,x[i+K])
a<-table.element(a,fit$fitted[i,'xhat'])
a<-table.element(a,myresid[i])
a<-table.row.end(a)
}
a<-table.end(a)
table.save(a,file='mytable1.tab')
a<-table.start()
a<-table.row.start(a)
a<-table.element(a,'Extrapolation Forecasts of Exponential Smoothing',4,TRUE)
a<-table.row.end(a)
a<-table.row.start(a)
a<-table.element(a,'t',header=TRUE)
a<-table.element(a,'Forecast',header=TRUE)
a<-table.element(a,'95% Lower Bound',header=TRUE)
a<-table.element(a,'95% Upper Bound',header=TRUE)
a<-table.row.end(a)
for (i in 1:np) {
a<-table.row.start(a)
a<-table.element(a,nx+i,header=TRUE)
a<-table.element(a,p[i,'fit'])
a<-table.element(a,p[i,'lwr'])
a<-table.element(a,p[i,'upr'])
a<-table.row.end(a)
}
a<-table.end(a)
table.save(a,file='mytable2.tab')