Free Statistics

of Irreproducible Research!

Author's title

Author*The author of this computation has been verified*
R Software Modulerwasp_arimabackwardselection.wasp
Title produced by softwareARIMA Backward Selection
Date of computationSun, 18 Dec 2016 17:50:29 +0100
Cite this page as followsStatistical Computations at FreeStatistics.org, Office for Research Development and Education, URL https://freestatistics.org/blog/index.php?v=date/2016/Dec/18/t1482081969f9o0rv62vuczj54.htm/, Retrieved Wed, 08 May 2024 14:27:20 +0000
Statistical Computations at FreeStatistics.org, Office for Research Development and Education, URL https://freestatistics.org/blog/index.php?pk=301196, Retrieved Wed, 08 May 2024 14:27:20 +0000
QR Codes:

Original text written by user:
IsPrivate?No (this computation is public)
User-defined keywords
Estimated Impact83
Family? (F = Feedback message, R = changed R code, M = changed R Module, P = changed Parameters, D = changed Data)
-       [ARIMA Backward Selection] [N 2460- ARIMA Bac...] [2016-12-18 16:50:29] [86c7fb9c8a0af864c0a27e2f433e80d7] [Current]
Feedback Forum

Post a new message
Dataseries X:
3850
3900
3900
3950
3950
3900
3400
2150
3800
3950
3950
3850
3750
3900
3850
3900
3900
4000
3450
2300
3900
4100
4150
4150
3950
4150
4150
4150
4150
4250
3750
2350
4200
4250
4350
4300
4150
4250
4250
4200
4150
4350
3750
2450
4250
4350
4450
4500
4350
4500
4550
4550
3050
3850
4100
2700
4450
4800
4950
4950
4800
4850
4850
5000
5000
5000
4450
2800
4850
5150
5050
5100
5100
5250
5250
5350
5150
5200
4600
2950
5100
5350
5350
5400
5250
5450
5500
5450
5200
5400
4800
3050
5450
5600
5750
5750
5650
5700
5750
5800
5750
5750
4950
3500
5750
6050
6150
6200
6150
6250
6300
6100
6350
6250
5400
3900
6100
6450
6600
6350
6500
6700
6550
6550
6550
6500


Summary of computational transaction
Raw Input view raw input (R code)
Raw Outputview raw output of R engine
Computing time8 seconds
R ServerBig Analytics Cloud Computing Center

\begin{tabular}{lllllllll}
\hline
Summary of computational transaction \tabularnewline
Raw Input view raw input (R code)  \tabularnewline
Raw Outputview raw output of R engine  \tabularnewline
Computing time8 seconds \tabularnewline
R ServerBig Analytics Cloud Computing Center \tabularnewline
\hline
\end{tabular}
%Source: https://freestatistics.org/blog/index.php?pk=301196&T=0

[TABLE]
[ROW]
Summary of computational transaction[/C][/ROW] [ROW]Raw Input[/C] view raw input (R code) [/C][/ROW] [ROW]Raw Output[/C]view raw output of R engine [/C][/ROW] [ROW]Computing time[/C]8 seconds[/C][/ROW] [ROW]R Server[/C]Big Analytics Cloud Computing Center[/C][/ROW] [/TABLE] Source: https://freestatistics.org/blog/index.php?pk=301196&T=0

Globally Unique Identifier (entire table): ba.freestatistics.org/blog/index.php?pk=301196&T=0

As an alternative you can also use a QR Code:  

The GUIDs for individual cells are displayed in the table below:

Summary of computational transaction
Raw Input view raw input (R code)
Raw Outputview raw output of R engine
Computing time8 seconds
R ServerBig Analytics Cloud Computing Center


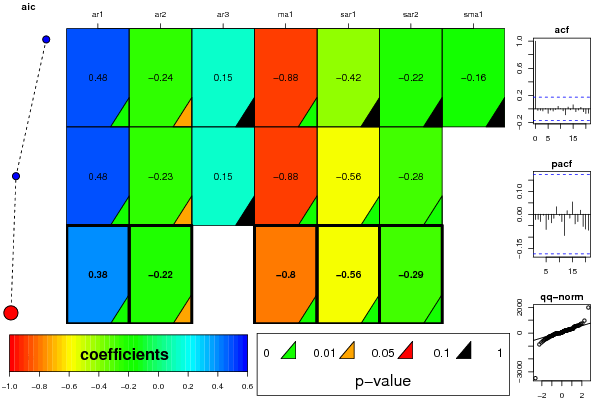
ARIMA Parameter Estimation and Backward Selection
Iterationar1ar2ar3ma1sar1sar2sma1
Estimates ( 1 )0.4791-0.23610.1456-0.8763-0.4159-0.2236-0.1642
(p-val)(3e-04 )(0.0246 )(0.1945 )(0 )(0.1552 )(0.149 )(0.5913 )
Estimates ( 2 )0.4836-0.23470.1493-0.8814-0.5614-0.28420
(p-val)(2e-04 )(0.0256 )(0.1815 )(0 )(0 )(0.0011 )(NA )
Estimates ( 3 )0.3796-0.22180-0.796-0.5554-0.28580
(p-val)(0.0045 )(0.0436 )(NA )(0 )(0 )(0.001 )(NA )
Estimates ( 4 )NANANANANANANA
(p-val)(NA )(NA )(NA )(NA )(NA )(NA )(NA )
Estimates ( 5 )NANANANANANANA
(p-val)(NA )(NA )(NA )(NA )(NA )(NA )(NA )
Estimates ( 6 )NANANANANANANA
(p-val)(NA )(NA )(NA )(NA )(NA )(NA )(NA )
Estimates ( 7 )NANANANANANANA
(p-val)(NA )(NA )(NA )(NA )(NA )(NA )(NA )
Estimates ( 8 )NANANANANANANA
(p-val)(NA )(NA )(NA )(NA )(NA )(NA )(NA )
Estimates ( 9 )NANANANANANANA
(p-val)(NA )(NA )(NA )(NA )(NA )(NA )(NA )
Estimates ( 10 )NANANANANANANA
(p-val)(NA )(NA )(NA )(NA )(NA )(NA )(NA )
Estimates ( 11 )NANANANANANANA
(p-val)(NA )(NA )(NA )(NA )(NA )(NA )(NA )
Estimates ( 12 )NANANANANANANA
(p-val)(NA )(NA )(NA )(NA )(NA )(NA )(NA )
Estimates ( 13 )NANANANANANANA
(p-val)(NA )(NA )(NA )(NA )(NA )(NA )(NA )

\begin{tabular}{lllllllll}
\hline
ARIMA Parameter Estimation and Backward Selection \tabularnewline
Iteration & ar1 & ar2 & ar3 & ma1 & sar1 & sar2 & sma1 \tabularnewline
Estimates ( 1 ) & 0.4791 & -0.2361 & 0.1456 & -0.8763 & -0.4159 & -0.2236 & -0.1642 \tabularnewline
(p-val) & (3e-04 ) & (0.0246 ) & (0.1945 ) & (0 ) & (0.1552 ) & (0.149 ) & (0.5913 ) \tabularnewline
Estimates ( 2 ) & 0.4836 & -0.2347 & 0.1493 & -0.8814 & -0.5614 & -0.2842 & 0 \tabularnewline
(p-val) & (2e-04 ) & (0.0256 ) & (0.1815 ) & (0 ) & (0 ) & (0.0011 ) & (NA ) \tabularnewline
Estimates ( 3 ) & 0.3796 & -0.2218 & 0 & -0.796 & -0.5554 & -0.2858 & 0 \tabularnewline
(p-val) & (0.0045 ) & (0.0436 ) & (NA ) & (0 ) & (0 ) & (0.001 ) & (NA ) \tabularnewline
Estimates ( 4 ) & NA & NA & NA & NA & NA & NA & NA \tabularnewline
(p-val) & (NA ) & (NA ) & (NA ) & (NA ) & (NA ) & (NA ) & (NA ) \tabularnewline
Estimates ( 5 ) & NA & NA & NA & NA & NA & NA & NA \tabularnewline
(p-val) & (NA ) & (NA ) & (NA ) & (NA ) & (NA ) & (NA ) & (NA ) \tabularnewline
Estimates ( 6 ) & NA & NA & NA & NA & NA & NA & NA \tabularnewline
(p-val) & (NA ) & (NA ) & (NA ) & (NA ) & (NA ) & (NA ) & (NA ) \tabularnewline
Estimates ( 7 ) & NA & NA & NA & NA & NA & NA & NA \tabularnewline
(p-val) & (NA ) & (NA ) & (NA ) & (NA ) & (NA ) & (NA ) & (NA ) \tabularnewline
Estimates ( 8 ) & NA & NA & NA & NA & NA & NA & NA \tabularnewline
(p-val) & (NA ) & (NA ) & (NA ) & (NA ) & (NA ) & (NA ) & (NA ) \tabularnewline
Estimates ( 9 ) & NA & NA & NA & NA & NA & NA & NA \tabularnewline
(p-val) & (NA ) & (NA ) & (NA ) & (NA ) & (NA ) & (NA ) & (NA ) \tabularnewline
Estimates ( 10 ) & NA & NA & NA & NA & NA & NA & NA \tabularnewline
(p-val) & (NA ) & (NA ) & (NA ) & (NA ) & (NA ) & (NA ) & (NA ) \tabularnewline
Estimates ( 11 ) & NA & NA & NA & NA & NA & NA & NA \tabularnewline
(p-val) & (NA ) & (NA ) & (NA ) & (NA ) & (NA ) & (NA ) & (NA ) \tabularnewline
Estimates ( 12 ) & NA & NA & NA & NA & NA & NA & NA \tabularnewline
(p-val) & (NA ) & (NA ) & (NA ) & (NA ) & (NA ) & (NA ) & (NA ) \tabularnewline
Estimates ( 13 ) & NA & NA & NA & NA & NA & NA & NA \tabularnewline
(p-val) & (NA ) & (NA ) & (NA ) & (NA ) & (NA ) & (NA ) & (NA ) \tabularnewline
\hline
\end{tabular}
%Source: https://freestatistics.org/blog/index.php?pk=301196&T=1

[TABLE]
[ROW][C]ARIMA Parameter Estimation and Backward Selection[/C][/ROW]
[ROW][C]Iteration[/C][C]ar1[/C][C]ar2[/C][C]ar3[/C][C]ma1[/C][C]sar1[/C][C]sar2[/C][C]sma1[/C][/ROW]
[ROW][C]Estimates ( 1 )[/C][C]0.4791[/C][C]-0.2361[/C][C]0.1456[/C][C]-0.8763[/C][C]-0.4159[/C][C]-0.2236[/C][C]-0.1642[/C][/ROW]
[ROW][C](p-val)[/C][C](3e-04 )[/C][C](0.0246 )[/C][C](0.1945 )[/C][C](0 )[/C][C](0.1552 )[/C][C](0.149 )[/C][C](0.5913 )[/C][/ROW]
[ROW][C]Estimates ( 2 )[/C][C]0.4836[/C][C]-0.2347[/C][C]0.1493[/C][C]-0.8814[/C][C]-0.5614[/C][C]-0.2842[/C][C]0[/C][/ROW]
[ROW][C](p-val)[/C][C](2e-04 )[/C][C](0.0256 )[/C][C](0.1815 )[/C][C](0 )[/C][C](0 )[/C][C](0.0011 )[/C][C](NA )[/C][/ROW]
[ROW][C]Estimates ( 3 )[/C][C]0.3796[/C][C]-0.2218[/C][C]0[/C][C]-0.796[/C][C]-0.5554[/C][C]-0.2858[/C][C]0[/C][/ROW]
[ROW][C](p-val)[/C][C](0.0045 )[/C][C](0.0436 )[/C][C](NA )[/C][C](0 )[/C][C](0 )[/C][C](0.001 )[/C][C](NA )[/C][/ROW]
[ROW][C]Estimates ( 4 )[/C][C]NA[/C][C]NA[/C][C]NA[/C][C]NA[/C][C]NA[/C][C]NA[/C][C]NA[/C][/ROW]
[ROW][C](p-val)[/C][C](NA )[/C][C](NA )[/C][C](NA )[/C][C](NA )[/C][C](NA )[/C][C](NA )[/C][C](NA )[/C][/ROW]
[ROW][C]Estimates ( 5 )[/C][C]NA[/C][C]NA[/C][C]NA[/C][C]NA[/C][C]NA[/C][C]NA[/C][C]NA[/C][/ROW]
[ROW][C](p-val)[/C][C](NA )[/C][C](NA )[/C][C](NA )[/C][C](NA )[/C][C](NA )[/C][C](NA )[/C][C](NA )[/C][/ROW]
[ROW][C]Estimates ( 6 )[/C][C]NA[/C][C]NA[/C][C]NA[/C][C]NA[/C][C]NA[/C][C]NA[/C][C]NA[/C][/ROW]
[ROW][C](p-val)[/C][C](NA )[/C][C](NA )[/C][C](NA )[/C][C](NA )[/C][C](NA )[/C][C](NA )[/C][C](NA )[/C][/ROW]
[ROW][C]Estimates ( 7 )[/C][C]NA[/C][C]NA[/C][C]NA[/C][C]NA[/C][C]NA[/C][C]NA[/C][C]NA[/C][/ROW]
[ROW][C](p-val)[/C][C](NA )[/C][C](NA )[/C][C](NA )[/C][C](NA )[/C][C](NA )[/C][C](NA )[/C][C](NA )[/C][/ROW]
[ROW][C]Estimates ( 8 )[/C][C]NA[/C][C]NA[/C][C]NA[/C][C]NA[/C][C]NA[/C][C]NA[/C][C]NA[/C][/ROW]
[ROW][C](p-val)[/C][C](NA )[/C][C](NA )[/C][C](NA )[/C][C](NA )[/C][C](NA )[/C][C](NA )[/C][C](NA )[/C][/ROW]
[ROW][C]Estimates ( 9 )[/C][C]NA[/C][C]NA[/C][C]NA[/C][C]NA[/C][C]NA[/C][C]NA[/C][C]NA[/C][/ROW]
[ROW][C](p-val)[/C][C](NA )[/C][C](NA )[/C][C](NA )[/C][C](NA )[/C][C](NA )[/C][C](NA )[/C][C](NA )[/C][/ROW]
[ROW][C]Estimates ( 10 )[/C][C]NA[/C][C]NA[/C][C]NA[/C][C]NA[/C][C]NA[/C][C]NA[/C][C]NA[/C][/ROW]
[ROW][C](p-val)[/C][C](NA )[/C][C](NA )[/C][C](NA )[/C][C](NA )[/C][C](NA )[/C][C](NA )[/C][C](NA )[/C][/ROW]
[ROW][C]Estimates ( 11 )[/C][C]NA[/C][C]NA[/C][C]NA[/C][C]NA[/C][C]NA[/C][C]NA[/C][C]NA[/C][/ROW]
[ROW][C](p-val)[/C][C](NA )[/C][C](NA )[/C][C](NA )[/C][C](NA )[/C][C](NA )[/C][C](NA )[/C][C](NA )[/C][/ROW]
[ROW][C]Estimates ( 12 )[/C][C]NA[/C][C]NA[/C][C]NA[/C][C]NA[/C][C]NA[/C][C]NA[/C][C]NA[/C][/ROW]
[ROW][C](p-val)[/C][C](NA )[/C][C](NA )[/C][C](NA )[/C][C](NA )[/C][C](NA )[/C][C](NA )[/C][C](NA )[/C][/ROW]
[ROW][C]Estimates ( 13 )[/C][C]NA[/C][C]NA[/C][C]NA[/C][C]NA[/C][C]NA[/C][C]NA[/C][C]NA[/C][/ROW]
[ROW][C](p-val)[/C][C](NA )[/C][C](NA )[/C][C](NA )[/C][C](NA )[/C][C](NA )[/C][C](NA )[/C][C](NA )[/C][/ROW]
[/TABLE]
Source: https://freestatistics.org/blog/index.php?pk=301196&T=1

Globally Unique Identifier (entire table): ba.freestatistics.org/blog/index.php?pk=301196&T=1

As an alternative you can also use a QR Code:  

The GUIDs for individual cells are displayed in the table below:

ARIMA Parameter Estimation and Backward Selection
Iterationar1ar2ar3ma1sar1sar2sma1
Estimates ( 1 )0.4791-0.23610.1456-0.8763-0.4159-0.2236-0.1642
(p-val)(3e-04 )(0.0246 )(0.1945 )(0 )(0.1552 )(0.149 )(0.5913 )
Estimates ( 2 )0.4836-0.23470.1493-0.8814-0.5614-0.28420
(p-val)(2e-04 )(0.0256 )(0.1815 )(0 )(0 )(0.0011 )(NA )
Estimates ( 3 )0.3796-0.22180-0.796-0.5554-0.28580
(p-val)(0.0045 )(0.0436 )(NA )(0 )(0 )(0.001 )(NA )
Estimates ( 4 )NANANANANANANA
(p-val)(NA )(NA )(NA )(NA )(NA )(NA )(NA )
Estimates ( 5 )NANANANANANANA
(p-val)(NA )(NA )(NA )(NA )(NA )(NA )(NA )
Estimates ( 6 )NANANANANANANA
(p-val)(NA )(NA )(NA )(NA )(NA )(NA )(NA )
Estimates ( 7 )NANANANANANANA
(p-val)(NA )(NA )(NA )(NA )(NA )(NA )(NA )
Estimates ( 8 )NANANANANANANA
(p-val)(NA )(NA )(NA )(NA )(NA )(NA )(NA )
Estimates ( 9 )NANANANANANANA
(p-val)(NA )(NA )(NA )(NA )(NA )(NA )(NA )
Estimates ( 10 )NANANANANANANA
(p-val)(NA )(NA )(NA )(NA )(NA )(NA )(NA )
Estimates ( 11 )NANANANANANANA
(p-val)(NA )(NA )(NA )(NA )(NA )(NA )(NA )
Estimates ( 12 )NANANANANANANA
(p-val)(NA )(NA )(NA )(NA )(NA )(NA )(NA )
Estimates ( 13 )NANANANANANANA
(p-val)(NA )(NA )(NA )(NA )(NA )(NA )(NA )


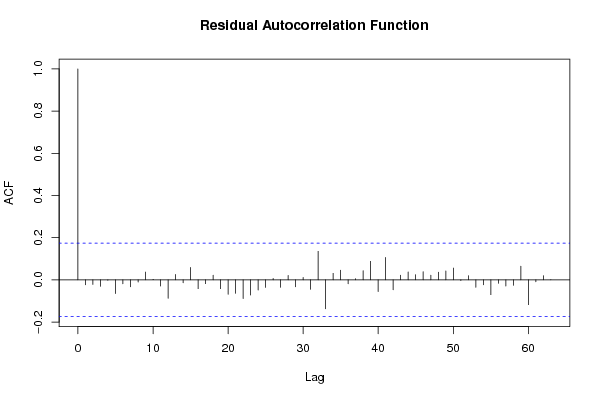
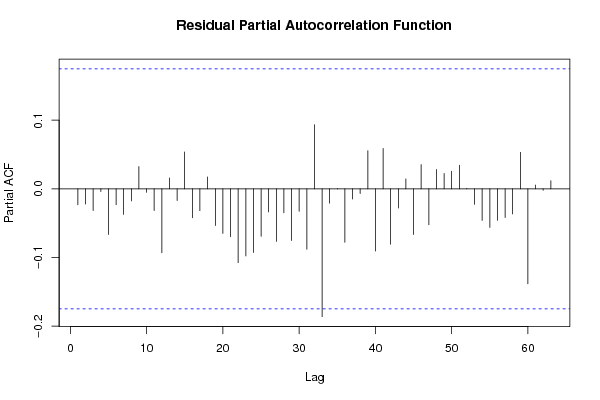
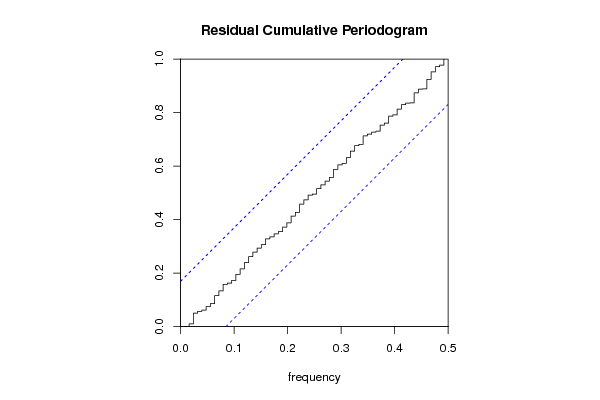
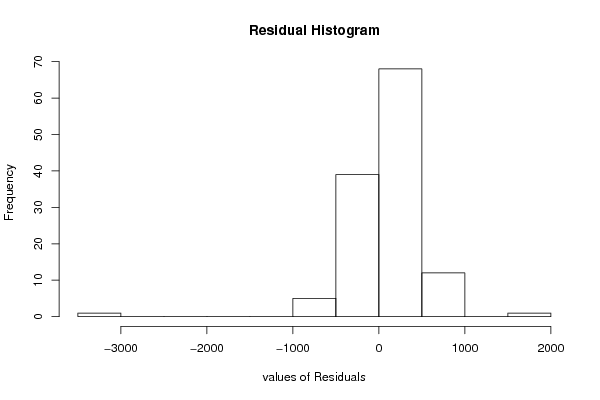
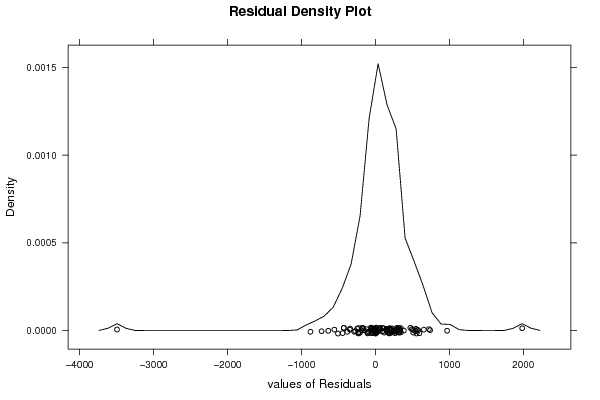
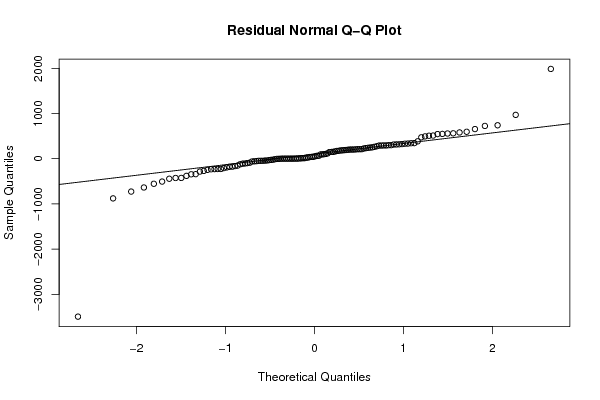
Estimated ARIMA Residuals
Value
-30.762808494715
186.210711254017
-60.8382718875025
54.9107680299978
-11.3086756513507
324.09548442463
10.6030721649715
331.118747761044
21.9381787046691
240.485159212775
209.540902024094
334.80976492569
-46.4067256385585
319.066498221837
147.728473822556
64.6104626993565
94.9169420371424
202.720768646597
174.856251610305
-344.524852020884
493.727242572601
-270.219701417646
293.819935282141
-46.473688949845
37.8923079734231
-96.42217477787
3.36867096050935
-229.85071900043
-207.302138817509
189.29168642866
-233.504451012287
-39.9070001098475
96.0885202183687
-45.5790352751978
148.928079284512
289.785526832416
160.579837753335
210.904247411369
298.483926358996
210.056475869901
-3493.63207405379
315.656693991849
655.638184591073
205.977745007074
595.806400062047
739.807037359268
580.547165648857
548.464840711218
473.095111619811
119.401383106656
181.835355754058
544.657262890963
1985.33478989662
-41.5123203284183
-87.9846555743373
-877.542344533808
225.510827982477
100.157619438225
-341.80573700077
64.8510823426938
202.679345548528
262.821706711226
192.440482492435
291.592139034671
724.753869726301
-162.595939861409
-426.540097438312
-726.844991683071
198.041630211196
-178.799423450493
12.6829375187922
-25.8232870924407
-227.971529400706
106.296036426438
42.2012000480991
-285.000808257927
557.370629093191
-21.0686138916202
-425.508592916511
-636.653160703162
562.069556446853
-379.230341146191
507.427702242916
-56.8376656828529
150.952179009691
-191.958519052096
39.3867553626697
-54.1370015167531
299.873878407377
-152.315495413855
-506.001557044592
293.725393998916
9.71450681116926
384.677090652866
342.456681138507
313.778372837746
345.242646011358
201.665750117066
251.977369842678
-443.175509053916
969.464757525217
-245.994442887757
-110.14164238942
26.6637423427532
-175.877106287931
275.495443704905
233.993220806793
-554.557483572879
512.061013163816
170.679228940219
-227.472375551252
246.03591907536
-122.194061277585
-105.335544329314

\begin{tabular}{lllllllll}
\hline
Estimated ARIMA Residuals \tabularnewline
Value \tabularnewline
-30.762808494715 \tabularnewline
186.210711254017 \tabularnewline
-60.8382718875025 \tabularnewline
54.9107680299978 \tabularnewline
-11.3086756513507 \tabularnewline
324.09548442463 \tabularnewline
10.6030721649715 \tabularnewline
331.118747761044 \tabularnewline
21.9381787046691 \tabularnewline
240.485159212775 \tabularnewline
209.540902024094 \tabularnewline
334.80976492569 \tabularnewline
-46.4067256385585 \tabularnewline
319.066498221837 \tabularnewline
147.728473822556 \tabularnewline
64.6104626993565 \tabularnewline
94.9169420371424 \tabularnewline
202.720768646597 \tabularnewline
174.856251610305 \tabularnewline
-344.524852020884 \tabularnewline
493.727242572601 \tabularnewline
-270.219701417646 \tabularnewline
293.819935282141 \tabularnewline
-46.473688949845 \tabularnewline
37.8923079734231 \tabularnewline
-96.42217477787 \tabularnewline
3.36867096050935 \tabularnewline
-229.85071900043 \tabularnewline
-207.302138817509 \tabularnewline
189.29168642866 \tabularnewline
-233.504451012287 \tabularnewline
-39.9070001098475 \tabularnewline
96.0885202183687 \tabularnewline
-45.5790352751978 \tabularnewline
148.928079284512 \tabularnewline
289.785526832416 \tabularnewline
160.579837753335 \tabularnewline
210.904247411369 \tabularnewline
298.483926358996 \tabularnewline
210.056475869901 \tabularnewline
-3493.63207405379 \tabularnewline
315.656693991849 \tabularnewline
655.638184591073 \tabularnewline
205.977745007074 \tabularnewline
595.806400062047 \tabularnewline
739.807037359268 \tabularnewline
580.547165648857 \tabularnewline
548.464840711218 \tabularnewline
473.095111619811 \tabularnewline
119.401383106656 \tabularnewline
181.835355754058 \tabularnewline
544.657262890963 \tabularnewline
1985.33478989662 \tabularnewline
-41.5123203284183 \tabularnewline
-87.9846555743373 \tabularnewline
-877.542344533808 \tabularnewline
225.510827982477 \tabularnewline
100.157619438225 \tabularnewline
-341.80573700077 \tabularnewline
64.8510823426938 \tabularnewline
202.679345548528 \tabularnewline
262.821706711226 \tabularnewline
192.440482492435 \tabularnewline
291.592139034671 \tabularnewline
724.753869726301 \tabularnewline
-162.595939861409 \tabularnewline
-426.540097438312 \tabularnewline
-726.844991683071 \tabularnewline
198.041630211196 \tabularnewline
-178.799423450493 \tabularnewline
12.6829375187922 \tabularnewline
-25.8232870924407 \tabularnewline
-227.971529400706 \tabularnewline
106.296036426438 \tabularnewline
42.2012000480991 \tabularnewline
-285.000808257927 \tabularnewline
557.370629093191 \tabularnewline
-21.0686138916202 \tabularnewline
-425.508592916511 \tabularnewline
-636.653160703162 \tabularnewline
562.069556446853 \tabularnewline
-379.230341146191 \tabularnewline
507.427702242916 \tabularnewline
-56.8376656828529 \tabularnewline
150.952179009691 \tabularnewline
-191.958519052096 \tabularnewline
39.3867553626697 \tabularnewline
-54.1370015167531 \tabularnewline
299.873878407377 \tabularnewline
-152.315495413855 \tabularnewline
-506.001557044592 \tabularnewline
293.725393998916 \tabularnewline
9.71450681116926 \tabularnewline
384.677090652866 \tabularnewline
342.456681138507 \tabularnewline
313.778372837746 \tabularnewline
345.242646011358 \tabularnewline
201.665750117066 \tabularnewline
251.977369842678 \tabularnewline
-443.175509053916 \tabularnewline
969.464757525217 \tabularnewline
-245.994442887757 \tabularnewline
-110.14164238942 \tabularnewline
26.6637423427532 \tabularnewline
-175.877106287931 \tabularnewline
275.495443704905 \tabularnewline
233.993220806793 \tabularnewline
-554.557483572879 \tabularnewline
512.061013163816 \tabularnewline
170.679228940219 \tabularnewline
-227.472375551252 \tabularnewline
246.03591907536 \tabularnewline
-122.194061277585 \tabularnewline
-105.335544329314 \tabularnewline
\hline
\end{tabular}
%Source: https://freestatistics.org/blog/index.php?pk=301196&T=2

[TABLE]
[ROW][C]Estimated ARIMA Residuals[/C][/ROW]
[ROW][C]Value[/C][/ROW]
[ROW][C]-30.762808494715[/C][/ROW]
[ROW][C]186.210711254017[/C][/ROW]
[ROW][C]-60.8382718875025[/C][/ROW]
[ROW][C]54.9107680299978[/C][/ROW]
[ROW][C]-11.3086756513507[/C][/ROW]
[ROW][C]324.09548442463[/C][/ROW]
[ROW][C]10.6030721649715[/C][/ROW]
[ROW][C]331.118747761044[/C][/ROW]
[ROW][C]21.9381787046691[/C][/ROW]
[ROW][C]240.485159212775[/C][/ROW]
[ROW][C]209.540902024094[/C][/ROW]
[ROW][C]334.80976492569[/C][/ROW]
[ROW][C]-46.4067256385585[/C][/ROW]
[ROW][C]319.066498221837[/C][/ROW]
[ROW][C]147.728473822556[/C][/ROW]
[ROW][C]64.6104626993565[/C][/ROW]
[ROW][C]94.9169420371424[/C][/ROW]
[ROW][C]202.720768646597[/C][/ROW]
[ROW][C]174.856251610305[/C][/ROW]
[ROW][C]-344.524852020884[/C][/ROW]
[ROW][C]493.727242572601[/C][/ROW]
[ROW][C]-270.219701417646[/C][/ROW]
[ROW][C]293.819935282141[/C][/ROW]
[ROW][C]-46.473688949845[/C][/ROW]
[ROW][C]37.8923079734231[/C][/ROW]
[ROW][C]-96.42217477787[/C][/ROW]
[ROW][C]3.36867096050935[/C][/ROW]
[ROW][C]-229.85071900043[/C][/ROW]
[ROW][C]-207.302138817509[/C][/ROW]
[ROW][C]189.29168642866[/C][/ROW]
[ROW][C]-233.504451012287[/C][/ROW]
[ROW][C]-39.9070001098475[/C][/ROW]
[ROW][C]96.0885202183687[/C][/ROW]
[ROW][C]-45.5790352751978[/C][/ROW]
[ROW][C]148.928079284512[/C][/ROW]
[ROW][C]289.785526832416[/C][/ROW]
[ROW][C]160.579837753335[/C][/ROW]
[ROW][C]210.904247411369[/C][/ROW]
[ROW][C]298.483926358996[/C][/ROW]
[ROW][C]210.056475869901[/C][/ROW]
[ROW][C]-3493.63207405379[/C][/ROW]
[ROW][C]315.656693991849[/C][/ROW]
[ROW][C]655.638184591073[/C][/ROW]
[ROW][C]205.977745007074[/C][/ROW]
[ROW][C]595.806400062047[/C][/ROW]
[ROW][C]739.807037359268[/C][/ROW]
[ROW][C]580.547165648857[/C][/ROW]
[ROW][C]548.464840711218[/C][/ROW]
[ROW][C]473.095111619811[/C][/ROW]
[ROW][C]119.401383106656[/C][/ROW]
[ROW][C]181.835355754058[/C][/ROW]
[ROW][C]544.657262890963[/C][/ROW]
[ROW][C]1985.33478989662[/C][/ROW]
[ROW][C]-41.5123203284183[/C][/ROW]
[ROW][C]-87.9846555743373[/C][/ROW]
[ROW][C]-877.542344533808[/C][/ROW]
[ROW][C]225.510827982477[/C][/ROW]
[ROW][C]100.157619438225[/C][/ROW]
[ROW][C]-341.80573700077[/C][/ROW]
[ROW][C]64.8510823426938[/C][/ROW]
[ROW][C]202.679345548528[/C][/ROW]
[ROW][C]262.821706711226[/C][/ROW]
[ROW][C]192.440482492435[/C][/ROW]
[ROW][C]291.592139034671[/C][/ROW]
[ROW][C]724.753869726301[/C][/ROW]
[ROW][C]-162.595939861409[/C][/ROW]
[ROW][C]-426.540097438312[/C][/ROW]
[ROW][C]-726.844991683071[/C][/ROW]
[ROW][C]198.041630211196[/C][/ROW]
[ROW][C]-178.799423450493[/C][/ROW]
[ROW][C]12.6829375187922[/C][/ROW]
[ROW][C]-25.8232870924407[/C][/ROW]
[ROW][C]-227.971529400706[/C][/ROW]
[ROW][C]106.296036426438[/C][/ROW]
[ROW][C]42.2012000480991[/C][/ROW]
[ROW][C]-285.000808257927[/C][/ROW]
[ROW][C]557.370629093191[/C][/ROW]
[ROW][C]-21.0686138916202[/C][/ROW]
[ROW][C]-425.508592916511[/C][/ROW]
[ROW][C]-636.653160703162[/C][/ROW]
[ROW][C]562.069556446853[/C][/ROW]
[ROW][C]-379.230341146191[/C][/ROW]
[ROW][C]507.427702242916[/C][/ROW]
[ROW][C]-56.8376656828529[/C][/ROW]
[ROW][C]150.952179009691[/C][/ROW]
[ROW][C]-191.958519052096[/C][/ROW]
[ROW][C]39.3867553626697[/C][/ROW]
[ROW][C]-54.1370015167531[/C][/ROW]
[ROW][C]299.873878407377[/C][/ROW]
[ROW][C]-152.315495413855[/C][/ROW]
[ROW][C]-506.001557044592[/C][/ROW]
[ROW][C]293.725393998916[/C][/ROW]
[ROW][C]9.71450681116926[/C][/ROW]
[ROW][C]384.677090652866[/C][/ROW]
[ROW][C]342.456681138507[/C][/ROW]
[ROW][C]313.778372837746[/C][/ROW]
[ROW][C]345.242646011358[/C][/ROW]
[ROW][C]201.665750117066[/C][/ROW]
[ROW][C]251.977369842678[/C][/ROW]
[ROW][C]-443.175509053916[/C][/ROW]
[ROW][C]969.464757525217[/C][/ROW]
[ROW][C]-245.994442887757[/C][/ROW]
[ROW][C]-110.14164238942[/C][/ROW]
[ROW][C]26.6637423427532[/C][/ROW]
[ROW][C]-175.877106287931[/C][/ROW]
[ROW][C]275.495443704905[/C][/ROW]
[ROW][C]233.993220806793[/C][/ROW]
[ROW][C]-554.557483572879[/C][/ROW]
[ROW][C]512.061013163816[/C][/ROW]
[ROW][C]170.679228940219[/C][/ROW]
[ROW][C]-227.472375551252[/C][/ROW]
[ROW][C]246.03591907536[/C][/ROW]
[ROW][C]-122.194061277585[/C][/ROW]
[ROW][C]-105.335544329314[/C][/ROW]
[/TABLE]
Source: https://freestatistics.org/blog/index.php?pk=301196&T=2

Globally Unique Identifier (entire table): ba.freestatistics.org/blog/index.php?pk=301196&T=2

As an alternative you can also use a QR Code:  

The GUIDs for individual cells are displayed in the table below:

Estimated ARIMA Residuals
Value
-30.762808494715
186.210711254017
-60.8382718875025
54.9107680299978
-11.3086756513507
324.09548442463
10.6030721649715
331.118747761044
21.9381787046691
240.485159212775
209.540902024094
334.80976492569
-46.4067256385585
319.066498221837
147.728473822556
64.6104626993565
94.9169420371424
202.720768646597
174.856251610305
-344.524852020884
493.727242572601
-270.219701417646
293.819935282141
-46.473688949845
37.8923079734231
-96.42217477787
3.36867096050935
-229.85071900043
-207.302138817509
189.29168642866
-233.504451012287
-39.9070001098475
96.0885202183687
-45.5790352751978
148.928079284512
289.785526832416
160.579837753335
210.904247411369
298.483926358996
210.056475869901
-3493.63207405379
315.656693991849
655.638184591073
205.977745007074
595.806400062047
739.807037359268
580.547165648857
548.464840711218
473.095111619811
119.401383106656
181.835355754058
544.657262890963
1985.33478989662
-41.5123203284183
-87.9846555743373
-877.542344533808
225.510827982477
100.157619438225
-341.80573700077
64.8510823426938
202.679345548528
262.821706711226
192.440482492435
291.592139034671
724.753869726301
-162.595939861409
-426.540097438312
-726.844991683071
198.041630211196
-178.799423450493
12.6829375187922
-25.8232870924407
-227.971529400706
106.296036426438
42.2012000480991
-285.000808257927
557.370629093191
-21.0686138916202
-425.508592916511
-636.653160703162
562.069556446853
-379.230341146191
507.427702242916
-56.8376656828529
150.952179009691
-191.958519052096
39.3867553626697
-54.1370015167531
299.873878407377
-152.315495413855
-506.001557044592
293.725393998916
9.71450681116926
384.677090652866
342.456681138507
313.778372837746
345.242646011358
201.665750117066
251.977369842678
-443.175509053916
969.464757525217
-245.994442887757
-110.14164238942
26.6637423427532
-175.877106287931
275.495443704905
233.993220806793
-554.557483572879
512.061013163816
170.679228940219
-227.472375551252
246.03591907536
-122.194061277585
-105.335544329314


Parameters (Session):
par1 = TRUE ; par2 = 1.1 ; par3 = 1 ; par4 = 1 ; par5 = 12 ; par6 = 3 ; par7 = 1 ; par8 = 2 ; par9 = 1 ;
Parameters (R input):
par1 = TRUE ; par2 = 1.1 ; par3 = 1 ; par4 = 1 ; par5 = 12 ; par6 = 3 ; par7 = 1 ; par8 = 2 ; par9 = 1 ;
R code (references can be found in the software module):
library(lattice)
if (par1 == 'TRUE') par1 <- TRUE
if (par1 == 'FALSE') par1 <- FALSE
par2 <- as.numeric(par2) #Box-Cox lambda transformation parameter
par3 <- as.numeric(par3) #degree of non-seasonal differencing
par4 <- as.numeric(par4) #degree of seasonal differencing
par5 <- as.numeric(par5) #seasonal period
par6 <- as.numeric(par6) #degree (p) of the non-seasonal AR(p) polynomial
par7 <- as.numeric(par7) #degree (q) of the non-seasonal MA(q) polynomial
par8 <- as.numeric(par8) #degree (P) of the seasonal AR(P) polynomial
par9 <- as.numeric(par9) #degree (Q) of the seasonal MA(Q) polynomial
armaGR <- function(arima.out, names, n){
try1 <- arima.out$coef
try2 <- sqrt(diag(arima.out$var.coef))
try.data.frame <- data.frame(matrix(NA,ncol=4,nrow=length(names)))
dimnames(try.data.frame) <- list(names,c('coef','std','tstat','pv'))
try.data.frame[,1] <- try1
for(i in 1:length(try2)) try.data.frame[which(rownames(try.data.frame)==names(try2)[i]),2] <- try2[i]
try.data.frame[,3] <- try.data.frame[,1] / try.data.frame[,2]
try.data.frame[,4] <- round((1-pt(abs(try.data.frame[,3]),df=n-(length(try2)+1)))*2,5)
vector <- rep(NA,length(names))
vector[is.na(try.data.frame[,4])] <- 0
maxi <- which.max(try.data.frame[,4])
continue <- max(try.data.frame[,4],na.rm=TRUE) > .05
vector[maxi] <- 0
list(summary=try.data.frame,next.vector=vector,continue=continue)
}
arimaSelect <- function(series, order=c(13,0,0), seasonal=list(order=c(2,0,0),period=12), include.mean=F){
nrc <- order[1]+order[3]+seasonal$order[1]+seasonal$order[3]
coeff <- matrix(NA, nrow=nrc*2, ncol=nrc)
pval <- matrix(NA, nrow=nrc*2, ncol=nrc)
mylist <- rep(list(NULL), nrc)
names <- NULL
if(order[1] > 0) names <- paste('ar',1:order[1],sep='')
if(order[3] > 0) names <- c( names , paste('ma',1:order[3],sep='') )
if(seasonal$order[1] > 0) names <- c(names, paste('sar',1:seasonal$order[1],sep=''))
if(seasonal$order[3] > 0) names <- c(names, paste('sma',1:seasonal$order[3],sep=''))
arima.out <- arima(series, order=order, seasonal=seasonal, include.mean=include.mean, method='ML')
mylist[[1]] <- arima.out
last.arma <- armaGR(arima.out, names, length(series))
mystop <- FALSE
i <- 1
coeff[i,] <- last.arma[[1]][,1]
pval [i,] <- last.arma[[1]][,4]
i <- 2
aic <- arima.out$aic
while(!mystop){
mylist[[i]] <- arima.out
arima.out <- arima(series, order=order, seasonal=seasonal, include.mean=include.mean, method='ML', fixed=last.arma$next.vector)
aic <- c(aic, arima.out$aic)
last.arma <- armaGR(arima.out, names, length(series))
mystop <- !last.arma$continue
coeff[i,] <- last.arma[[1]][,1]
pval [i,] <- last.arma[[1]][,4]
i <- i+1
}
list(coeff, pval, mylist, aic=aic)
}
arimaSelectplot <- function(arimaSelect.out,noms,choix){
noms <- names(arimaSelect.out[[3]][[1]]$coef)
coeff <- arimaSelect.out[[1]]
k <- min(which(is.na(coeff[,1])))-1
coeff <- coeff[1:k,]
pval <- arimaSelect.out[[2]][1:k,]
aic <- arimaSelect.out$aic[1:k]
coeff[coeff==0] <- NA
n <- ncol(coeff)
if(missing(choix)) choix <- k
layout(matrix(c(1,1,1,2,
3,3,3,2,
3,3,3,4,
5,6,7,7),nr=4),
widths=c(10,35,45,15),
heights=c(30,30,15,15))
couleurs <- rainbow(75)[1:50]#(50)
ticks <- pretty(coeff)
par(mar=c(1,1,3,1))
plot(aic,k:1-.5,type='o',pch=21,bg='blue',cex=2,axes=F,lty=2,xpd=NA)
points(aic[choix],k-choix+.5,pch=21,cex=4,bg=2,xpd=NA)
title('aic',line=2)
par(mar=c(3,0,0,0))
plot(0,axes=F,xlab='',ylab='',xlim=range(ticks),ylim=c(.1,1))
rect(xleft = min(ticks) + (0:49)/50*(max(ticks)-min(ticks)),
xright = min(ticks) + (1:50)/50*(max(ticks)-min(ticks)),
ytop = rep(1,50),
ybottom= rep(0,50),col=couleurs,border=NA)
axis(1,ticks)
rect(xleft=min(ticks),xright=max(ticks),ytop=1,ybottom=0)
text(mean(coeff,na.rm=T),.5,'coefficients',cex=2,font=2)
par(mar=c(1,1,3,1))
image(1:n,1:k,t(coeff[k:1,]),axes=F,col=couleurs,zlim=range(ticks))
for(i in 1:n) for(j in 1:k) if(!is.na(coeff[j,i])) {
if(pval[j,i]<.01) symb = 'green'
else if( (pval[j,i]<.05) & (pval[j,i]>=.01)) symb = 'orange'
else if( (pval[j,i]<.1) & (pval[j,i]>=.05)) symb = 'red'
else symb = 'black'
polygon(c(i+.5 ,i+.2 ,i+.5 ,i+.5),
c(k-j+0.5,k-j+0.5,k-j+0.8,k-j+0.5),
col=symb)
if(j==choix) {
rect(xleft=i-.5,
xright=i+.5,
ybottom=k-j+1.5,
ytop=k-j+.5,
lwd=4)
text(i,
k-j+1,
round(coeff[j,i],2),
cex=1.2,
font=2)
}
else{
rect(xleft=i-.5,xright=i+.5,ybottom=k-j+1.5,ytop=k-j+.5)
text(i,k-j+1,round(coeff[j,i],2),cex=1.2,font=1)
}
}
axis(3,1:n,noms)
par(mar=c(0.5,0,0,0.5))
plot(0,axes=F,xlab='',ylab='',type='n',xlim=c(0,8),ylim=c(-.2,.8))
cols <- c('green','orange','red','black')
niv <- c('0','0.01','0.05','0.1')
for(i in 0:3){
polygon(c(1+2*i ,1+2*i ,1+2*i-.5 ,1+2*i),
c(.4 ,.7 , .4 , .4),
col=cols[i+1])
text(2*i,0.5,niv[i+1],cex=1.5)
}
text(8,.5,1,cex=1.5)
text(4,0,'p-value',cex=2)
box()
residus <- arimaSelect.out[[3]][[choix]]$res
par(mar=c(1,2,4,1))
acf(residus,main='')
title('acf',line=.5)
par(mar=c(1,2,4,1))
pacf(residus,main='')
title('pacf',line=.5)
par(mar=c(2,2,4,1))
qqnorm(residus,main='')
title('qq-norm',line=.5)
qqline(residus)
residus
}
if (par2 == 0) x <- log(x)
if (par2 != 0) x <- x^par2
(selection <- arimaSelect(x, order=c(par6,par3,par7), seasonal=list(order=c(par8,par4,par9), period=par5)))
bitmap(file='test1.png')
resid <- arimaSelectplot(selection)
dev.off()
resid
bitmap(file='test2.png')
acf(resid,length(resid)/2, main='Residual Autocorrelation Function')
dev.off()
bitmap(file='test3.png')
pacf(resid,length(resid)/2, main='Residual Partial Autocorrelation Function')
dev.off()
bitmap(file='test4.png')
cpgram(resid, main='Residual Cumulative Periodogram')
dev.off()
bitmap(file='test5.png')
hist(resid, main='Residual Histogram', xlab='values of Residuals')
dev.off()
bitmap(file='test6.png')
densityplot(~resid,col='black',main='Residual Density Plot', xlab='values of Residuals')
dev.off()
bitmap(file='test7.png')
qqnorm(resid, main='Residual Normal Q-Q Plot')
qqline(resid)
dev.off()
ncols <- length(selection[[1]][1,])
nrows <- length(selection[[2]][,1])-1
load(file='createtable')
a<-table.start()
a<-table.row.start(a)
a<-table.element(a,'ARIMA Parameter Estimation and Backward Selection', ncols+1,TRUE)
a<-table.row.end(a)
a<-table.row.start(a)
a<-table.element(a,'Iteration', header=TRUE)
for (i in 1:ncols) {
a<-table.element(a,names(selection[[3]][[1]]$coef)[i],header=TRUE)
}
a<-table.row.end(a)
for (j in 1:nrows) {
a<-table.row.start(a)
mydum <- 'Estimates ('
mydum <- paste(mydum,j)
mydum <- paste(mydum,')')
a<-table.element(a,mydum, header=TRUE)
for (i in 1:ncols) {
a<-table.element(a,round(selection[[1]][j,i],4))
}
a<-table.row.end(a)
a<-table.row.start(a)
a<-table.element(a,'(p-val)', header=TRUE)
for (i in 1:ncols) {
mydum <- '('
mydum <- paste(mydum,round(selection[[2]][j,i],4),sep='')
mydum <- paste(mydum,')')
a<-table.element(a,mydum)
}
a<-table.row.end(a)
}
a<-table.end(a)
table.save(a,file='mytable.tab')
a<-table.start()
a<-table.row.start(a)
a<-table.element(a,'Estimated ARIMA Residuals', 1,TRUE)
a<-table.row.end(a)
a<-table.row.start(a)
a<-table.element(a,'Value', 1,TRUE)
a<-table.row.end(a)
for (i in (par4*par5+par3):length(resid)) {
a<-table.row.start(a)
a<-table.element(a,resid[i])
a<-table.row.end(a)
}
a<-table.end(a)
table.save(a,file='mytable1.tab')