Free Statistics

of Irreproducible Research!

Author's title

Author*The author of this computation has been verified*
R Software Modulerwasp_arimabackwardselection.wasp
Title produced by softwareARIMA Backward Selection
Date of computationSun, 18 Dec 2016 18:42:41 +0100
Cite this page as followsStatistical Computations at FreeStatistics.org, Office for Research Development and Education, URL https://freestatistics.org/blog/index.php?v=date/2016/Dec/18/t1482083365ts12xfypl9hmv75.htm/, Retrieved Wed, 08 May 2024 22:11:23 +0000
Statistical Computations at FreeStatistics.org, Office for Research Development and Education, URL https://freestatistics.org/blog/index.php?pk=301203, Retrieved Wed, 08 May 2024 22:11:23 +0000
QR Codes:

Original text written by user:
IsPrivate?No (this computation is public)
User-defined keywords
Estimated Impact66
Family? (F = Feedback message, R = changed R code, M = changed R Module, P = changed Parameters, D = changed Data)
-       [ARIMA Backward Selection] [] [2016-12-18 17:42:41] [9ac947b5174fcc9cd01e144b03ceb277] [Current]
Feedback Forum

Post a new message
Dataseries X:
7984
7937
7821
7749
7785
7632
7533
7536
7470
7367
7246
7150
7050
6907
6803
6626
6512
6509
6419
6365
6395
6360
6386
6360
6259
6198
6103
6064
5968
5908
5805
5728
5678
5274
5166
5106
5008
5034
4901
4853
4790
4703
4640
4544
4465
4335
4345
4246
4131
4112
4111
4096
3970
3970
3908
3861
3819
3781
3684
3664
3648
3564
3490


Summary of computational transaction
Raw Input view raw input (R code)
Raw Outputview raw output of R engine
Computing time2 seconds
R ServerBig Analytics Cloud Computing Center

\begin{tabular}{lllllllll}
\hline
Summary of computational transaction \tabularnewline
Raw Input view raw input (R code)  \tabularnewline
Raw Outputview raw output of R engine  \tabularnewline
Computing time2 seconds \tabularnewline
R ServerBig Analytics Cloud Computing Center \tabularnewline
\hline
\end{tabular}
%Source: https://freestatistics.org/blog/index.php?pk=301203&T=0

[TABLE]
[ROW]
Summary of computational transaction[/C][/ROW] [ROW]Raw Input[/C] view raw input (R code) [/C][/ROW] [ROW]Raw Output[/C]view raw output of R engine [/C][/ROW] [ROW]Computing time[/C]2 seconds[/C][/ROW] [ROW]R Server[/C]Big Analytics Cloud Computing Center[/C][/ROW] [/TABLE] Source: https://freestatistics.org/blog/index.php?pk=301203&T=0

Globally Unique Identifier (entire table): ba.freestatistics.org/blog/index.php?pk=301203&T=0

As an alternative you can also use a QR Code:  

The GUIDs for individual cells are displayed in the table below:

Summary of computational transaction
Raw Input view raw input (R code)
Raw Outputview raw output of R engine
Computing time2 seconds
R ServerBig Analytics Cloud Computing Center


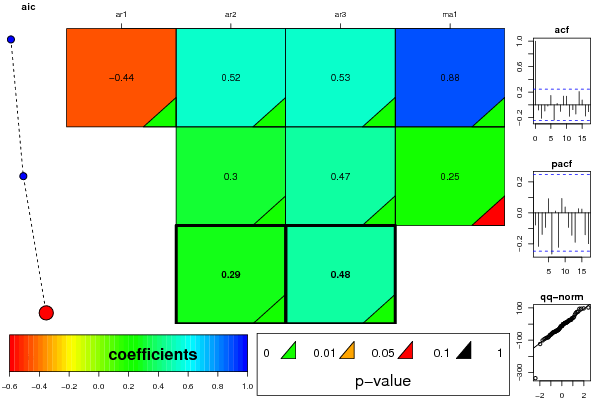
ARIMA Parameter Estimation and Backward Selection
Iterationar1ar2ar3ma1
Estimates ( 1 )-0.44290.52160.52720.8833
(p-val)(0.0011 )(0 )(0 )(0 )
Estimates ( 2 )00.29880.46510.2492
(p-val)(NA )(0.0057 )(0 )(0.095 )
Estimates ( 3 )00.29380.48430
(p-val)(NA )(0.0088 )(0 )(NA )
Estimates ( 4 )NANANANA
(p-val)(NA )(NA )(NA )(NA )
Estimates ( 5 )NANANANA
(p-val)(NA )(NA )(NA )(NA )
Estimates ( 6 )NANANANA
(p-val)(NA )(NA )(NA )(NA )
Estimates ( 7 )NANANANA
(p-val)(NA )(NA )(NA )(NA )

\begin{tabular}{lllllllll}
\hline
ARIMA Parameter Estimation and Backward Selection \tabularnewline
Iteration & ar1 & ar2 & ar3 & ma1 \tabularnewline
Estimates ( 1 ) & -0.4429 & 0.5216 & 0.5272 & 0.8833 \tabularnewline
(p-val) & (0.0011 ) & (0 ) & (0 ) & (0 ) \tabularnewline
Estimates ( 2 ) & 0 & 0.2988 & 0.4651 & 0.2492 \tabularnewline
(p-val) & (NA ) & (0.0057 ) & (0 ) & (0.095 ) \tabularnewline
Estimates ( 3 ) & 0 & 0.2938 & 0.4843 & 0 \tabularnewline
(p-val) & (NA ) & (0.0088 ) & (0 ) & (NA ) \tabularnewline
Estimates ( 4 ) & NA & NA & NA & NA \tabularnewline
(p-val) & (NA ) & (NA ) & (NA ) & (NA ) \tabularnewline
Estimates ( 5 ) & NA & NA & NA & NA \tabularnewline
(p-val) & (NA ) & (NA ) & (NA ) & (NA ) \tabularnewline
Estimates ( 6 ) & NA & NA & NA & NA \tabularnewline
(p-val) & (NA ) & (NA ) & (NA ) & (NA ) \tabularnewline
Estimates ( 7 ) & NA & NA & NA & NA \tabularnewline
(p-val) & (NA ) & (NA ) & (NA ) & (NA ) \tabularnewline
\hline
\end{tabular}
%Source: https://freestatistics.org/blog/index.php?pk=301203&T=1

[TABLE]
[ROW][C]ARIMA Parameter Estimation and Backward Selection[/C][/ROW]
[ROW][C]Iteration[/C][C]ar1[/C][C]ar2[/C][C]ar3[/C][C]ma1[/C][/ROW]
[ROW][C]Estimates ( 1 )[/C][C]-0.4429[/C][C]0.5216[/C][C]0.5272[/C][C]0.8833[/C][/ROW]
[ROW][C](p-val)[/C][C](0.0011 )[/C][C](0 )[/C][C](0 )[/C][C](0 )[/C][/ROW]
[ROW][C]Estimates ( 2 )[/C][C]0[/C][C]0.2988[/C][C]0.4651[/C][C]0.2492[/C][/ROW]
[ROW][C](p-val)[/C][C](NA )[/C][C](0.0057 )[/C][C](0 )[/C][C](0.095 )[/C][/ROW]
[ROW][C]Estimates ( 3 )[/C][C]0[/C][C]0.2938[/C][C]0.4843[/C][C]0[/C][/ROW]
[ROW][C](p-val)[/C][C](NA )[/C][C](0.0088 )[/C][C](0 )[/C][C](NA )[/C][/ROW]
[ROW][C]Estimates ( 4 )[/C][C]NA[/C][C]NA[/C][C]NA[/C][C]NA[/C][/ROW]
[ROW][C](p-val)[/C][C](NA )[/C][C](NA )[/C][C](NA )[/C][C](NA )[/C][/ROW]
[ROW][C]Estimates ( 5 )[/C][C]NA[/C][C]NA[/C][C]NA[/C][C]NA[/C][/ROW]
[ROW][C](p-val)[/C][C](NA )[/C][C](NA )[/C][C](NA )[/C][C](NA )[/C][/ROW]
[ROW][C]Estimates ( 6 )[/C][C]NA[/C][C]NA[/C][C]NA[/C][C]NA[/C][/ROW]
[ROW][C](p-val)[/C][C](NA )[/C][C](NA )[/C][C](NA )[/C][C](NA )[/C][/ROW]
[ROW][C]Estimates ( 7 )[/C][C]NA[/C][C]NA[/C][C]NA[/C][C]NA[/C][/ROW]
[ROW][C](p-val)[/C][C](NA )[/C][C](NA )[/C][C](NA )[/C][C](NA )[/C][/ROW]
[/TABLE]
Source: https://freestatistics.org/blog/index.php?pk=301203&T=1

Globally Unique Identifier (entire table): ba.freestatistics.org/blog/index.php?pk=301203&T=1

As an alternative you can also use a QR Code:  

The GUIDs for individual cells are displayed in the table below:

ARIMA Parameter Estimation and Backward Selection
Iterationar1ar2ar3ma1
Estimates ( 1 )-0.44290.52160.52720.8833
(p-val)(0.0011 )(0 )(0 )(0 )
Estimates ( 2 )00.29880.46510.2492
(p-val)(NA )(0.0057 )(0 )(0.095 )
Estimates ( 3 )00.29380.48430
(p-val)(NA )(0.0088 )(0 )(NA )
Estimates ( 4 )NANANANA
(p-val)(NA )(NA )(NA )(NA )
Estimates ( 5 )NANANANA
(p-val)(NA )(NA )(NA )(NA )
Estimates ( 6 )NANANANA
(p-val)(NA )(NA )(NA )(NA )
Estimates ( 7 )NANANANA
(p-val)(NA )(NA )(NA )(NA )


Estimated ARIMA Residuals
Value
7.98399217497081
-33.5760270330313
-77.0773070303557
-13.1721973847629
95.0589828559255
-101.068310552622
-51.0922615587996
44.7012055370228
23.608489170374
-63.7306770544575
-86.7957574610281
-12.8993768828372
-12.7229206524115
-54.8645090760455
-15.7977314288755
-83.8225923680065
4.47369160731887
97.146338929173
2.18655522198878
-0.623514310210339
58.4426477166026
8.43553314831479
40.0513151267769
-39.4749949770039
-82.6537557513248
-44.730911392382
-41.5829217986457
36.565570906042
-48.3516835272803
7.8876913718077
-58.1404800202636
0.0665405400031887
8.66754375397068
-335.243609420433
26.283084375109
77.4226961767463
102.892668801525
68.5256701689586
-92.88348005233
12.956534118237
-38.5813402039976
-1.18250065646862
-21.5547734050488
-35.3307590344284
-10.9064252522094
-69.2946726038144
95.5228584516863
-47.2109556542182
-45.7581063405423
17.3307125988131
75.0917437943781
25.4576059489409
-123.206645591308
35.6448367285911
-26.2555154341198
18.1481790179623
-27.9962011423236
11.8570761482038
-65.543575239843
27.2204426765175
23.8763099521902
-38.8552928016916
-50.2355618468987

\begin{tabular}{lllllllll}
\hline
Estimated ARIMA Residuals \tabularnewline
Value \tabularnewline
7.98399217497081 \tabularnewline
-33.5760270330313 \tabularnewline
-77.0773070303557 \tabularnewline
-13.1721973847629 \tabularnewline
95.0589828559255 \tabularnewline
-101.068310552622 \tabularnewline
-51.0922615587996 \tabularnewline
44.7012055370228 \tabularnewline
23.608489170374 \tabularnewline
-63.7306770544575 \tabularnewline
-86.7957574610281 \tabularnewline
-12.8993768828372 \tabularnewline
-12.7229206524115 \tabularnewline
-54.8645090760455 \tabularnewline
-15.7977314288755 \tabularnewline
-83.8225923680065 \tabularnewline
4.47369160731887 \tabularnewline
97.146338929173 \tabularnewline
2.18655522198878 \tabularnewline
-0.623514310210339 \tabularnewline
58.4426477166026 \tabularnewline
8.43553314831479 \tabularnewline
40.0513151267769 \tabularnewline
-39.4749949770039 \tabularnewline
-82.6537557513248 \tabularnewline
-44.730911392382 \tabularnewline
-41.5829217986457 \tabularnewline
36.565570906042 \tabularnewline
-48.3516835272803 \tabularnewline
7.8876913718077 \tabularnewline
-58.1404800202636 \tabularnewline
0.0665405400031887 \tabularnewline
8.66754375397068 \tabularnewline
-335.243609420433 \tabularnewline
26.283084375109 \tabularnewline
77.4226961767463 \tabularnewline
102.892668801525 \tabularnewline
68.5256701689586 \tabularnewline
-92.88348005233 \tabularnewline
12.956534118237 \tabularnewline
-38.5813402039976 \tabularnewline
-1.18250065646862 \tabularnewline
-21.5547734050488 \tabularnewline
-35.3307590344284 \tabularnewline
-10.9064252522094 \tabularnewline
-69.2946726038144 \tabularnewline
95.5228584516863 \tabularnewline
-47.2109556542182 \tabularnewline
-45.7581063405423 \tabularnewline
17.3307125988131 \tabularnewline
75.0917437943781 \tabularnewline
25.4576059489409 \tabularnewline
-123.206645591308 \tabularnewline
35.6448367285911 \tabularnewline
-26.2555154341198 \tabularnewline
18.1481790179623 \tabularnewline
-27.9962011423236 \tabularnewline
11.8570761482038 \tabularnewline
-65.543575239843 \tabularnewline
27.2204426765175 \tabularnewline
23.8763099521902 \tabularnewline
-38.8552928016916 \tabularnewline
-50.2355618468987 \tabularnewline
\hline
\end{tabular}
%Source: https://freestatistics.org/blog/index.php?pk=301203&T=2

[TABLE]
[ROW][C]Estimated ARIMA Residuals[/C][/ROW]
[ROW][C]Value[/C][/ROW]
[ROW][C]7.98399217497081[/C][/ROW]
[ROW][C]-33.5760270330313[/C][/ROW]
[ROW][C]-77.0773070303557[/C][/ROW]
[ROW][C]-13.1721973847629[/C][/ROW]
[ROW][C]95.0589828559255[/C][/ROW]
[ROW][C]-101.068310552622[/C][/ROW]
[ROW][C]-51.0922615587996[/C][/ROW]
[ROW][C]44.7012055370228[/C][/ROW]
[ROW][C]23.608489170374[/C][/ROW]
[ROW][C]-63.7306770544575[/C][/ROW]
[ROW][C]-86.7957574610281[/C][/ROW]
[ROW][C]-12.8993768828372[/C][/ROW]
[ROW][C]-12.7229206524115[/C][/ROW]
[ROW][C]-54.8645090760455[/C][/ROW]
[ROW][C]-15.7977314288755[/C][/ROW]
[ROW][C]-83.8225923680065[/C][/ROW]
[ROW][C]4.47369160731887[/C][/ROW]
[ROW][C]97.146338929173[/C][/ROW]
[ROW][C]2.18655522198878[/C][/ROW]
[ROW][C]-0.623514310210339[/C][/ROW]
[ROW][C]58.4426477166026[/C][/ROW]
[ROW][C]8.43553314831479[/C][/ROW]
[ROW][C]40.0513151267769[/C][/ROW]
[ROW][C]-39.4749949770039[/C][/ROW]
[ROW][C]-82.6537557513248[/C][/ROW]
[ROW][C]-44.730911392382[/C][/ROW]
[ROW][C]-41.5829217986457[/C][/ROW]
[ROW][C]36.565570906042[/C][/ROW]
[ROW][C]-48.3516835272803[/C][/ROW]
[ROW][C]7.8876913718077[/C][/ROW]
[ROW][C]-58.1404800202636[/C][/ROW]
[ROW][C]0.0665405400031887[/C][/ROW]
[ROW][C]8.66754375397068[/C][/ROW]
[ROW][C]-335.243609420433[/C][/ROW]
[ROW][C]26.283084375109[/C][/ROW]
[ROW][C]77.4226961767463[/C][/ROW]
[ROW][C]102.892668801525[/C][/ROW]
[ROW][C]68.5256701689586[/C][/ROW]
[ROW][C]-92.88348005233[/C][/ROW]
[ROW][C]12.956534118237[/C][/ROW]
[ROW][C]-38.5813402039976[/C][/ROW]
[ROW][C]-1.18250065646862[/C][/ROW]
[ROW][C]-21.5547734050488[/C][/ROW]
[ROW][C]-35.3307590344284[/C][/ROW]
[ROW][C]-10.9064252522094[/C][/ROW]
[ROW][C]-69.2946726038144[/C][/ROW]
[ROW][C]95.5228584516863[/C][/ROW]
[ROW][C]-47.2109556542182[/C][/ROW]
[ROW][C]-45.7581063405423[/C][/ROW]
[ROW][C]17.3307125988131[/C][/ROW]
[ROW][C]75.0917437943781[/C][/ROW]
[ROW][C]25.4576059489409[/C][/ROW]
[ROW][C]-123.206645591308[/C][/ROW]
[ROW][C]35.6448367285911[/C][/ROW]
[ROW][C]-26.2555154341198[/C][/ROW]
[ROW][C]18.1481790179623[/C][/ROW]
[ROW][C]-27.9962011423236[/C][/ROW]
[ROW][C]11.8570761482038[/C][/ROW]
[ROW][C]-65.543575239843[/C][/ROW]
[ROW][C]27.2204426765175[/C][/ROW]
[ROW][C]23.8763099521902[/C][/ROW]
[ROW][C]-38.8552928016916[/C][/ROW]
[ROW][C]-50.2355618468987[/C][/ROW]
[/TABLE]
Source: https://freestatistics.org/blog/index.php?pk=301203&T=2

Globally Unique Identifier (entire table): ba.freestatistics.org/blog/index.php?pk=301203&T=2

As an alternative you can also use a QR Code:  

The GUIDs for individual cells are displayed in the table below:

Estimated ARIMA Residuals
Value
7.98399217497081
-33.5760270330313
-77.0773070303557
-13.1721973847629
95.0589828559255
-101.068310552622
-51.0922615587996
44.7012055370228
23.608489170374
-63.7306770544575
-86.7957574610281
-12.8993768828372
-12.7229206524115
-54.8645090760455
-15.7977314288755
-83.8225923680065
4.47369160731887
97.146338929173
2.18655522198878
-0.623514310210339
58.4426477166026
8.43553314831479
40.0513151267769
-39.4749949770039
-82.6537557513248
-44.730911392382
-41.5829217986457
36.565570906042
-48.3516835272803
7.8876913718077
-58.1404800202636
0.0665405400031887
8.66754375397068
-335.243609420433
26.283084375109
77.4226961767463
102.892668801525
68.5256701689586
-92.88348005233
12.956534118237
-38.5813402039976
-1.18250065646862
-21.5547734050488
-35.3307590344284
-10.9064252522094
-69.2946726038144
95.5228584516863
-47.2109556542182
-45.7581063405423
17.3307125988131
75.0917437943781
25.4576059489409
-123.206645591308
35.6448367285911
-26.2555154341198
18.1481790179623
-27.9962011423236
11.8570761482038
-65.543575239843
27.2204426765175
23.8763099521902
-38.8552928016916
-50.2355618468987


Parameters (Session):
par1 = FALSE ; par2 = 1 ; par3 = 1 ; par4 = 0 ; par5 = 12 ; par6 = 3 ; par7 = 1 ; par8 = 0 ; par9 = 0 ;
Parameters (R input):
par1 = FALSE ; par2 = 1 ; par3 = 1 ; par4 = 0 ; par5 = 12 ; par6 = 3 ; par7 = 1 ; par8 = 0 ; par9 = 0 ;
R code (references can be found in the software module):
par9 <- '0'
par8 <- '0'
par7 <- '1'
par6 <- '3'
par5 <- '12'
par4 <- '1'
par3 <- '0'
par2 <- '1'
par1 <- 'FALSE'
library(lattice)
if (par1 == 'TRUE') par1 <- TRUE
if (par1 == 'FALSE') par1 <- FALSE
par2 <- as.numeric(par2) #Box-Cox lambda transformation parameter
par3 <- as.numeric(par3) #degree of non-seasonal differencing
par4 <- as.numeric(par4) #degree of seasonal differencing
par5 <- as.numeric(par5) #seasonal period
par6 <- as.numeric(par6) #degree (p) of the non-seasonal AR(p) polynomial
par7 <- as.numeric(par7) #degree (q) of the non-seasonal MA(q) polynomial
par8 <- as.numeric(par8) #degree (P) of the seasonal AR(P) polynomial
par9 <- as.numeric(par9) #degree (Q) of the seasonal MA(Q) polynomial
armaGR <- function(arima.out, names, n){
try1 <- arima.out$coef
try2 <- sqrt(diag(arima.out$var.coef))
try.data.frame <- data.frame(matrix(NA,ncol=4,nrow=length(names)))
dimnames(try.data.frame) <- list(names,c('coef','std','tstat','pv'))
try.data.frame[,1] <- try1
for(i in 1:length(try2)) try.data.frame[which(rownames(try.data.frame)==names(try2)[i]),2] <- try2[i]
try.data.frame[,3] <- try.data.frame[,1] / try.data.frame[,2]
try.data.frame[,4] <- round((1-pt(abs(try.data.frame[,3]),df=n-(length(try2)+1)))*2,5)
vector <- rep(NA,length(names))
vector[is.na(try.data.frame[,4])] <- 0
maxi <- which.max(try.data.frame[,4])
continue <- max(try.data.frame[,4],na.rm=TRUE) > .05
vector[maxi] <- 0
list(summary=try.data.frame,next.vector=vector,continue=continue)
}
arimaSelect <- function(series, order=c(13,0,0), seasonal=list(order=c(2,0,0),period=12), include.mean=F){
nrc <- order[1]+order[3]+seasonal$order[1]+seasonal$order[3]
coeff <- matrix(NA, nrow=nrc*2, ncol=nrc)
pval <- matrix(NA, nrow=nrc*2, ncol=nrc)
mylist <- rep(list(NULL), nrc)
names <- NULL
if(order[1] > 0) names <- paste('ar',1:order[1],sep='')
if(order[3] > 0) names <- c( names , paste('ma',1:order[3],sep='') )
if(seasonal$order[1] > 0) names <- c(names, paste('sar',1:seasonal$order[1],sep=''))
if(seasonal$order[3] > 0) names <- c(names, paste('sma',1:seasonal$order[3],sep=''))
arima.out <- arima(series, order=order, seasonal=seasonal, include.mean=include.mean, method='ML')
mylist[[1]] <- arima.out
last.arma <- armaGR(arima.out, names, length(series))
mystop <- FALSE
i <- 1
coeff[i,] <- last.arma[[1]][,1]
pval [i,] <- last.arma[[1]][,4]
i <- 2
aic <- arima.out$aic
while(!mystop){
mylist[[i]] <- arima.out
arima.out <- arima(series, order=order, seasonal=seasonal, include.mean=include.mean, method='ML', fixed=last.arma$next.vector)
aic <- c(aic, arima.out$aic)
last.arma <- armaGR(arima.out, names, length(series))
mystop <- !last.arma$continue
coeff[i,] <- last.arma[[1]][,1]
pval [i,] <- last.arma[[1]][,4]
i <- i+1
}
list(coeff, pval, mylist, aic=aic)
}
arimaSelectplot <- function(arimaSelect.out,noms,choix){
noms <- names(arimaSelect.out[[3]][[1]]$coef)
coeff <- arimaSelect.out[[1]]
k <- min(which(is.na(coeff[,1])))-1
coeff <- coeff[1:k,]
pval <- arimaSelect.out[[2]][1:k,]
aic <- arimaSelect.out$aic[1:k]
coeff[coeff==0] <- NA
n <- ncol(coeff)
if(missing(choix)) choix <- k
layout(matrix(c(1,1,1,2,
3,3,3,2,
3,3,3,4,
5,6,7,7),nr=4),
widths=c(10,35,45,15),
heights=c(30,30,15,15))
couleurs <- rainbow(75)[1:50]#(50)
ticks <- pretty(coeff)
par(mar=c(1,1,3,1))
plot(aic,k:1-.5,type='o',pch=21,bg='blue',cex=2,axes=F,lty=2,xpd=NA)
points(aic[choix],k-choix+.5,pch=21,cex=4,bg=2,xpd=NA)
title('aic',line=2)
par(mar=c(3,0,0,0))
plot(0,axes=F,xlab='',ylab='',xlim=range(ticks),ylim=c(.1,1))
rect(xleft = min(ticks) + (0:49)/50*(max(ticks)-min(ticks)),
xright = min(ticks) + (1:50)/50*(max(ticks)-min(ticks)),
ytop = rep(1,50),
ybottom= rep(0,50),col=couleurs,border=NA)
axis(1,ticks)
rect(xleft=min(ticks),xright=max(ticks),ytop=1,ybottom=0)
text(mean(coeff,na.rm=T),.5,'coefficients',cex=2,font=2)
par(mar=c(1,1,3,1))
image(1:n,1:k,t(coeff[k:1,]),axes=F,col=couleurs,zlim=range(ticks))
for(i in 1:n) for(j in 1:k) if(!is.na(coeff[j,i])) {
if(pval[j,i]<.01) symb = 'green'
else if( (pval[j,i]<.05) & (pval[j,i]>=.01)) symb = 'orange'
else if( (pval[j,i]<.1) & (pval[j,i]>=.05)) symb = 'red'
else symb = 'black'
polygon(c(i+.5 ,i+.2 ,i+.5 ,i+.5),
c(k-j+0.5,k-j+0.5,k-j+0.8,k-j+0.5),
col=symb)
if(j==choix) {
rect(xleft=i-.5,
xright=i+.5,
ybottom=k-j+1.5,
ytop=k-j+.5,
lwd=4)
text(i,
k-j+1,
round(coeff[j,i],2),
cex=1.2,
font=2)
}
else{
rect(xleft=i-.5,xright=i+.5,ybottom=k-j+1.5,ytop=k-j+.5)
text(i,k-j+1,round(coeff[j,i],2),cex=1.2,font=1)
}
}
axis(3,1:n,noms)
par(mar=c(0.5,0,0,0.5))
plot(0,axes=F,xlab='',ylab='',type='n',xlim=c(0,8),ylim=c(-.2,.8))
cols <- c('green','orange','red','black')
niv <- c('0','0.01','0.05','0.1')
for(i in 0:3){
polygon(c(1+2*i ,1+2*i ,1+2*i-.5 ,1+2*i),
c(.4 ,.7 , .4 , .4),
col=cols[i+1])
text(2*i,0.5,niv[i+1],cex=1.5)
}
text(8,.5,1,cex=1.5)
text(4,0,'p-value',cex=2)
box()
residus <- arimaSelect.out[[3]][[choix]]$res
par(mar=c(1,2,4,1))
acf(residus,main='')
title('acf',line=.5)
par(mar=c(1,2,4,1))
pacf(residus,main='')
title('pacf',line=.5)
par(mar=c(2,2,4,1))
qqnorm(residus,main='')
title('qq-norm',line=.5)
qqline(residus)
residus
}
if (par2 == 0) x <- log(x)
if (par2 != 0) x <- x^par2
(selection <- arimaSelect(x, order=c(par6,par3,par7), seasonal=list(order=c(par8,par4,par9), period=par5)))
bitmap(file='test1.png')
resid <- arimaSelectplot(selection)
dev.off()
resid
bitmap(file='test2.png')
acf(resid,length(resid)/2, main='Residual Autocorrelation Function')
dev.off()
bitmap(file='test3.png')
pacf(resid,length(resid)/2, main='Residual Partial Autocorrelation Function')
dev.off()
bitmap(file='test4.png')
cpgram(resid, main='Residual Cumulative Periodogram')
dev.off()
bitmap(file='test5.png')
hist(resid, main='Residual Histogram', xlab='values of Residuals')
dev.off()
bitmap(file='test6.png')
densityplot(~resid,col='black',main='Residual Density Plot', xlab='values of Residuals')
dev.off()
bitmap(file='test7.png')
qqnorm(resid, main='Residual Normal Q-Q Plot')
qqline(resid)
dev.off()
ncols <- length(selection[[1]][1,])
nrows <- length(selection[[2]][,1])-1
load(file='createtable')
a<-table.start()
a<-table.row.start(a)
a<-table.element(a,'ARIMA Parameter Estimation and Backward Selection', ncols+1,TRUE)
a<-table.row.end(a)
a<-table.row.start(a)
a<-table.element(a,'Iteration', header=TRUE)
for (i in 1:ncols) {
a<-table.element(a,names(selection[[3]][[1]]$coef)[i],header=TRUE)
}
a<-table.row.end(a)
for (j in 1:nrows) {
a<-table.row.start(a)
mydum <- 'Estimates ('
mydum <- paste(mydum,j)
mydum <- paste(mydum,')')
a<-table.element(a,mydum, header=TRUE)
for (i in 1:ncols) {
a<-table.element(a,round(selection[[1]][j,i],4))
}
a<-table.row.end(a)
a<-table.row.start(a)
a<-table.element(a,'(p-val)', header=TRUE)
for (i in 1:ncols) {
mydum <- '('
mydum <- paste(mydum,round(selection[[2]][j,i],4),sep='')
mydum <- paste(mydum,')')
a<-table.element(a,mydum)
}
a<-table.row.end(a)
}
a<-table.end(a)
table.save(a,file='mytable.tab')
a<-table.start()
a<-table.row.start(a)
a<-table.element(a,'Estimated ARIMA Residuals', 1,TRUE)
a<-table.row.end(a)
a<-table.row.start(a)
a<-table.element(a,'Value', 1,TRUE)
a<-table.row.end(a)
for (i in (par4*par5+par3):length(resid)) {
a<-table.row.start(a)
a<-table.element(a,resid[i])
a<-table.row.end(a)
}
a<-table.end(a)
table.save(a,file='mytable1.tab')