Free Statistics

of Irreproducible Research!

Author's title

Author*The author of this computation has been verified*
R Software Modulerwasp_arimabackwardselection.wasp
Title produced by softwareARIMA Backward Selection
Date of computationSun, 18 Dec 2016 18:47:33 +0100
Cite this page as followsStatistical Computations at FreeStatistics.org, Office for Research Development and Education, URL https://freestatistics.org/blog/index.php?v=date/2016/Dec/18/t1482083526w4a0i8gnmuu1bhx.htm/, Retrieved Thu, 09 May 2024 02:03:36 +0200
Statistical Computations at FreeStatistics.org, Office for Research Development and Education, URL https://freestatistics.org/blog/index.php?pk=, Retrieved Thu, 09 May 2024 02:03:36 +0200
QR Codes:

Original text written by user:
IsPrivate?No (this computation is public)
User-defined keywords
Estimated Impact0
Dataseries X:
3647
1885
4791
3178
2849
4716
3085
2799
3573
2721
3355
5667
2856
1944
4188
2949
3567
4137
3494
2489
3244
2669
2529
3377
3366
2073
4133
4213
3710
5123
3141
3084
3804
3203
2757
2243
5229
2857
3395
4882
7140
8945
6866
4205
3217
3079
2263
4187
2665
2073
3540
3686
2384
4500
1679
868
1869
3710
6904
3415
938
3359
3551
2278
3033
2280
2901
4812
4882
7896
5048
3741
4418
3471
5055
7595
8124
2333
3008
2744
2833
2428
4269
3207
5170
7767
4544
3741
2193
3432
5282
6635
4222
7317
4132
5048
4383
3761
4081
6491
5859
7139
7682
8649
6146
7137
9948
15819
8370
13222
16711
19059
8303
20781
9638
13444
6072
13442
14457
17705
16463
19194
20688
14739
12702
15760


Summary of computational transaction
Raw Input view raw input (R code)
Raw Outputview raw output of R engine
Computing time3 seconds
R ServerBig Analytics Cloud Computing Center

\begin{tabular}{lllllllll}
\hline
Summary of computational transaction \tabularnewline
Raw Input view raw input (R code)  \tabularnewline
Raw Outputview raw output of R engine  \tabularnewline
Computing time3 seconds \tabularnewline
R ServerBig Analytics Cloud Computing Center \tabularnewline
\hline
\end{tabular}
%Source: https://freestatistics.org/blog/index.php?pk=&T=0

[TABLE]
[ROW]
Summary of computational transaction[/C][/ROW] [ROW]Raw Input[/C] view raw input (R code) [/C][/ROW] [ROW]Raw Output[/C]view raw output of R engine [/C][/ROW] [ROW]Computing time[/C]3 seconds[/C][/ROW] [ROW]R Server[/C]Big Analytics Cloud Computing Center[/C][/ROW] [/TABLE] Source: https://freestatistics.org/blog/index.php?pk=&T=0

Globally Unique Identifier (entire table): ba.freestatistics.org/blog/index.php?pk=&T=0

As an alternative you can also use a QR Code:  

The GUIDs for individual cells are displayed in the table below:

Summary of computational transaction
Raw Input view raw input (R code)
Raw Outputview raw output of R engine
Computing time3 seconds
R ServerBig Analytics Cloud Computing Center


ARIMA Parameter Estimation and Backward Selection
Iterationar1ar2sar1sar2
Estimates ( 1 )-0.5228-0.0956-0.7096-0.3527
(p-val)(0 )(0.3042 )(0 )(3e-04 )
Estimates ( 2 )-0.47640-0.6987-0.3559
(p-val)(0 )(NA )(0 )(2e-04 )
Estimates ( 3 )NANANANA
(p-val)(NA )(NA )(NA )(NA )
Estimates ( 4 )NANANANA
(p-val)(NA )(NA )(NA )(NA )
Estimates ( 5 )NANANANA
(p-val)(NA )(NA )(NA )(NA )
Estimates ( 6 )NANANANA
(p-val)(NA )(NA )(NA )(NA )
Estimates ( 7 )NANANANA
(p-val)(NA )(NA )(NA )(NA )

\begin{tabular}{lllllllll}
\hline
ARIMA Parameter Estimation and Backward Selection \tabularnewline
Iteration & ar1 & ar2 & sar1 & sar2 \tabularnewline
Estimates ( 1 ) & -0.5228 & -0.0956 & -0.7096 & -0.3527 \tabularnewline
(p-val) & (0 ) & (0.3042 ) & (0 ) & (3e-04 ) \tabularnewline
Estimates ( 2 ) & -0.4764 & 0 & -0.6987 & -0.3559 \tabularnewline
(p-val) & (0 ) & (NA ) & (0 ) & (2e-04 ) \tabularnewline
Estimates ( 3 ) & NA & NA & NA & NA \tabularnewline
(p-val) & (NA ) & (NA ) & (NA ) & (NA ) \tabularnewline
Estimates ( 4 ) & NA & NA & NA & NA \tabularnewline
(p-val) & (NA ) & (NA ) & (NA ) & (NA ) \tabularnewline
Estimates ( 5 ) & NA & NA & NA & NA \tabularnewline
(p-val) & (NA ) & (NA ) & (NA ) & (NA ) \tabularnewline
Estimates ( 6 ) & NA & NA & NA & NA \tabularnewline
(p-val) & (NA ) & (NA ) & (NA ) & (NA ) \tabularnewline
Estimates ( 7 ) & NA & NA & NA & NA \tabularnewline
(p-val) & (NA ) & (NA ) & (NA ) & (NA ) \tabularnewline
\hline
\end{tabular}
%Source: https://freestatistics.org/blog/index.php?pk=&T=1

[TABLE]
[ROW][C]ARIMA Parameter Estimation and Backward Selection[/C][/ROW]
[ROW][C]Iteration[/C][C]ar1[/C][C]ar2[/C][C]sar1[/C][C]sar2[/C][/ROW]
[ROW][C]Estimates ( 1 )[/C][C]-0.5228[/C][C]-0.0956[/C][C]-0.7096[/C][C]-0.3527[/C][/ROW]
[ROW][C](p-val)[/C][C](0 )[/C][C](0.3042 )[/C][C](0 )[/C][C](3e-04 )[/C][/ROW]
[ROW][C]Estimates ( 2 )[/C][C]-0.4764[/C][C]0[/C][C]-0.6987[/C][C]-0.3559[/C][/ROW]
[ROW][C](p-val)[/C][C](0 )[/C][C](NA )[/C][C](0 )[/C][C](2e-04 )[/C][/ROW]
[ROW][C]Estimates ( 3 )[/C][C]NA[/C][C]NA[/C][C]NA[/C][C]NA[/C][/ROW]
[ROW][C](p-val)[/C][C](NA )[/C][C](NA )[/C][C](NA )[/C][C](NA )[/C][/ROW]
[ROW][C]Estimates ( 4 )[/C][C]NA[/C][C]NA[/C][C]NA[/C][C]NA[/C][/ROW]
[ROW][C](p-val)[/C][C](NA )[/C][C](NA )[/C][C](NA )[/C][C](NA )[/C][/ROW]
[ROW][C]Estimates ( 5 )[/C][C]NA[/C][C]NA[/C][C]NA[/C][C]NA[/C][/ROW]
[ROW][C](p-val)[/C][C](NA )[/C][C](NA )[/C][C](NA )[/C][C](NA )[/C][/ROW]
[ROW][C]Estimates ( 6 )[/C][C]NA[/C][C]NA[/C][C]NA[/C][C]NA[/C][/ROW]
[ROW][C](p-val)[/C][C](NA )[/C][C](NA )[/C][C](NA )[/C][C](NA )[/C][/ROW]
[ROW][C]Estimates ( 7 )[/C][C]NA[/C][C]NA[/C][C]NA[/C][C]NA[/C][/ROW]
[ROW][C](p-val)[/C][C](NA )[/C][C](NA )[/C][C](NA )[/C][C](NA )[/C][/ROW]
[/TABLE]
Source: https://freestatistics.org/blog/index.php?pk=&T=1

Globally Unique Identifier (entire table): ba.freestatistics.org/blog/index.php?pk=&T=1

As an alternative you can also use a QR Code:  

The GUIDs for individual cells are displayed in the table below:

ARIMA Parameter Estimation and Backward Selection
Iterationar1ar2sar1sar2
Estimates ( 1 )-0.5228-0.0956-0.7096-0.3527
(p-val)(0 )(0.3042 )(0 )(3e-04 )
Estimates ( 2 )-0.47640-0.6987-0.3559
(p-val)(0 )(NA )(0 )(2e-04 )
Estimates ( 3 )NANANANA
(p-val)(NA )(NA )(NA )(NA )
Estimates ( 4 )NANANANA
(p-val)(NA )(NA )(NA )(NA )
Estimates ( 5 )NANANANA
(p-val)(NA )(NA )(NA )(NA )
Estimates ( 6 )NANANANA
(p-val)(NA )(NA )(NA )(NA )
Estimates ( 7 )NANANANA
(p-val)(NA )(NA )(NA )(NA )


Estimated ARIMA Residuals
Value
-9.27753156242031
2533.67270465325
-2252.75515873223
-396.004247166278
576.374898452774
-510.86902663973
-487.819787696807
3025.92308494567
-1497.9330934888
-1947.31726957714
973.360511667794
-461.698341379881
780.540836544352
1028.11764909279
-572.772969101307
-1818.20849492873
499.644081682076
437.432694401368
-912.994083430627
244.588722162142
847.886012783666
-652.082560299296
1063.56518461534
1337.64280968736
-511.150834396315
1336.71467013244
-1460.56525884502
-1061.42030044969
368.715211502247
-34.041822456114
-680.189371134379
-1149.14004127745
2475.87751919859
-777.12718446834
-242.687640577298
1752.84200343628
2224.59097502664
3051.12334999927
-96.3998900848
-3397.90633695913
-4605.48930513596
-1428.73283906572
-322.937953050988
2255.80793141743
-1890.80296443086
-1753.11051013613
1772.62766925951
1158.07955825452
-1081.33508272042
1020.31674769605
-1458.01499290325
-1601.19571991463
1743.82329402409
2616.21721157436
4771.33296363251
-1867.44794234527
-3488.04400453841
35.849791698409
285.961384717061
-22.3311342675106
1541.12600054921
-2037.55288593697
-924.351356186317
3758.43532627031
2415.04877660071
2283.12056564535
-3287.99032941725
-2220.59959183427
764.589935324901
-1764.98522860533
983.620802270152
3565.3543870345
1648.21863753514
-6048.21292014543
-2290.65327547151
-1283.92931877095
-866.172678600509
263.128968298912
2340.68042775725
-289.015806148222
960.506318509376
5768.26271657101
-1738.42070112042
-3189.68838468157
-3449.34628235071
1326.49510781144
3064.09050906203
3302.03619929814
-1438.92375913767
738.426340308916
-2458.49777075643
-313.076015392056
207.372862829155
-2820.03038822541
206.069422039697
2568.84460434019
2149.23957824789
610.844403848251
984.744791588699
-56.0510981112402
-1422.52300896263
-945.011679534977
3413.92269837677
6297.54984595263
-3608.32518878319
1474.04174626629
4029.64263025447
1098.54246224991
-7539.07503772157
6302.59012220348
-8699.63262990417
-5311.56836149783
-1623.36247746683
1361.35537752364
2816.73667530928
446.099079753912
7157.26957255252
-1797.26412136786
1736.22871732783
-7548.19094396847
379.330029056768
-3151.45173445705

\begin{tabular}{lllllllll}
\hline
Estimated ARIMA Residuals \tabularnewline
Value \tabularnewline
-9.27753156242031 \tabularnewline
2533.67270465325 \tabularnewline
-2252.75515873223 \tabularnewline
-396.004247166278 \tabularnewline
576.374898452774 \tabularnewline
-510.86902663973 \tabularnewline
-487.819787696807 \tabularnewline
3025.92308494567 \tabularnewline
-1497.9330934888 \tabularnewline
-1947.31726957714 \tabularnewline
973.360511667794 \tabularnewline
-461.698341379881 \tabularnewline
780.540836544352 \tabularnewline
1028.11764909279 \tabularnewline
-572.772969101307 \tabularnewline
-1818.20849492873 \tabularnewline
499.644081682076 \tabularnewline
437.432694401368 \tabularnewline
-912.994083430627 \tabularnewline
244.588722162142 \tabularnewline
847.886012783666 \tabularnewline
-652.082560299296 \tabularnewline
1063.56518461534 \tabularnewline
1337.64280968736 \tabularnewline
-511.150834396315 \tabularnewline
1336.71467013244 \tabularnewline
-1460.56525884502 \tabularnewline
-1061.42030044969 \tabularnewline
368.715211502247 \tabularnewline
-34.041822456114 \tabularnewline
-680.189371134379 \tabularnewline
-1149.14004127745 \tabularnewline
2475.87751919859 \tabularnewline
-777.12718446834 \tabularnewline
-242.687640577298 \tabularnewline
1752.84200343628 \tabularnewline
2224.59097502664 \tabularnewline
3051.12334999927 \tabularnewline
-96.3998900848 \tabularnewline
-3397.90633695913 \tabularnewline
-4605.48930513596 \tabularnewline
-1428.73283906572 \tabularnewline
-322.937953050988 \tabularnewline
2255.80793141743 \tabularnewline
-1890.80296443086 \tabularnewline
-1753.11051013613 \tabularnewline
1772.62766925951 \tabularnewline
1158.07955825452 \tabularnewline
-1081.33508272042 \tabularnewline
1020.31674769605 \tabularnewline
-1458.01499290325 \tabularnewline
-1601.19571991463 \tabularnewline
1743.82329402409 \tabularnewline
2616.21721157436 \tabularnewline
4771.33296363251 \tabularnewline
-1867.44794234527 \tabularnewline
-3488.04400453841 \tabularnewline
35.849791698409 \tabularnewline
285.961384717061 \tabularnewline
-22.3311342675106 \tabularnewline
1541.12600054921 \tabularnewline
-2037.55288593697 \tabularnewline
-924.351356186317 \tabularnewline
3758.43532627031 \tabularnewline
2415.04877660071 \tabularnewline
2283.12056564535 \tabularnewline
-3287.99032941725 \tabularnewline
-2220.59959183427 \tabularnewline
764.589935324901 \tabularnewline
-1764.98522860533 \tabularnewline
983.620802270152 \tabularnewline
3565.3543870345 \tabularnewline
1648.21863753514 \tabularnewline
-6048.21292014543 \tabularnewline
-2290.65327547151 \tabularnewline
-1283.92931877095 \tabularnewline
-866.172678600509 \tabularnewline
263.128968298912 \tabularnewline
2340.68042775725 \tabularnewline
-289.015806148222 \tabularnewline
960.506318509376 \tabularnewline
5768.26271657101 \tabularnewline
-1738.42070112042 \tabularnewline
-3189.68838468157 \tabularnewline
-3449.34628235071 \tabularnewline
1326.49510781144 \tabularnewline
3064.09050906203 \tabularnewline
3302.03619929814 \tabularnewline
-1438.92375913767 \tabularnewline
738.426340308916 \tabularnewline
-2458.49777075643 \tabularnewline
-313.076015392056 \tabularnewline
207.372862829155 \tabularnewline
-2820.03038822541 \tabularnewline
206.069422039697 \tabularnewline
2568.84460434019 \tabularnewline
2149.23957824789 \tabularnewline
610.844403848251 \tabularnewline
984.744791588699 \tabularnewline
-56.0510981112402 \tabularnewline
-1422.52300896263 \tabularnewline
-945.011679534977 \tabularnewline
3413.92269837677 \tabularnewline
6297.54984595263 \tabularnewline
-3608.32518878319 \tabularnewline
1474.04174626629 \tabularnewline
4029.64263025447 \tabularnewline
1098.54246224991 \tabularnewline
-7539.07503772157 \tabularnewline
6302.59012220348 \tabularnewline
-8699.63262990417 \tabularnewline
-5311.56836149783 \tabularnewline
-1623.36247746683 \tabularnewline
1361.35537752364 \tabularnewline
2816.73667530928 \tabularnewline
446.099079753912 \tabularnewline
7157.26957255252 \tabularnewline
-1797.26412136786 \tabularnewline
1736.22871732783 \tabularnewline
-7548.19094396847 \tabularnewline
379.330029056768 \tabularnewline
-3151.45173445705 \tabularnewline
\hline
\end{tabular}
%Source: https://freestatistics.org/blog/index.php?pk=&T=2

[TABLE]
[ROW][C]Estimated ARIMA Residuals[/C][/ROW]
[ROW][C]Value[/C][/ROW]
[ROW][C]-9.27753156242031[/C][/ROW]
[ROW][C]2533.67270465325[/C][/ROW]
[ROW][C]-2252.75515873223[/C][/ROW]
[ROW][C]-396.004247166278[/C][/ROW]
[ROW][C]576.374898452774[/C][/ROW]
[ROW][C]-510.86902663973[/C][/ROW]
[ROW][C]-487.819787696807[/C][/ROW]
[ROW][C]3025.92308494567[/C][/ROW]
[ROW][C]-1497.9330934888[/C][/ROW]
[ROW][C]-1947.31726957714[/C][/ROW]
[ROW][C]973.360511667794[/C][/ROW]
[ROW][C]-461.698341379881[/C][/ROW]
[ROW][C]780.540836544352[/C][/ROW]
[ROW][C]1028.11764909279[/C][/ROW]
[ROW][C]-572.772969101307[/C][/ROW]
[ROW][C]-1818.20849492873[/C][/ROW]
[ROW][C]499.644081682076[/C][/ROW]
[ROW][C]437.432694401368[/C][/ROW]
[ROW][C]-912.994083430627[/C][/ROW]
[ROW][C]244.588722162142[/C][/ROW]
[ROW][C]847.886012783666[/C][/ROW]
[ROW][C]-652.082560299296[/C][/ROW]
[ROW][C]1063.56518461534[/C][/ROW]
[ROW][C]1337.64280968736[/C][/ROW]
[ROW][C]-511.150834396315[/C][/ROW]
[ROW][C]1336.71467013244[/C][/ROW]
[ROW][C]-1460.56525884502[/C][/ROW]
[ROW][C]-1061.42030044969[/C][/ROW]
[ROW][C]368.715211502247[/C][/ROW]
[ROW][C]-34.041822456114[/C][/ROW]
[ROW][C]-680.189371134379[/C][/ROW]
[ROW][C]-1149.14004127745[/C][/ROW]
[ROW][C]2475.87751919859[/C][/ROW]
[ROW][C]-777.12718446834[/C][/ROW]
[ROW][C]-242.687640577298[/C][/ROW]
[ROW][C]1752.84200343628[/C][/ROW]
[ROW][C]2224.59097502664[/C][/ROW]
[ROW][C]3051.12334999927[/C][/ROW]
[ROW][C]-96.3998900848[/C][/ROW]
[ROW][C]-3397.90633695913[/C][/ROW]
[ROW][C]-4605.48930513596[/C][/ROW]
[ROW][C]-1428.73283906572[/C][/ROW]
[ROW][C]-322.937953050988[/C][/ROW]
[ROW][C]2255.80793141743[/C][/ROW]
[ROW][C]-1890.80296443086[/C][/ROW]
[ROW][C]-1753.11051013613[/C][/ROW]
[ROW][C]1772.62766925951[/C][/ROW]
[ROW][C]1158.07955825452[/C][/ROW]
[ROW][C]-1081.33508272042[/C][/ROW]
[ROW][C]1020.31674769605[/C][/ROW]
[ROW][C]-1458.01499290325[/C][/ROW]
[ROW][C]-1601.19571991463[/C][/ROW]
[ROW][C]1743.82329402409[/C][/ROW]
[ROW][C]2616.21721157436[/C][/ROW]
[ROW][C]4771.33296363251[/C][/ROW]
[ROW][C]-1867.44794234527[/C][/ROW]
[ROW][C]-3488.04400453841[/C][/ROW]
[ROW][C]35.849791698409[/C][/ROW]
[ROW][C]285.961384717061[/C][/ROW]
[ROW][C]-22.3311342675106[/C][/ROW]
[ROW][C]1541.12600054921[/C][/ROW]
[ROW][C]-2037.55288593697[/C][/ROW]
[ROW][C]-924.351356186317[/C][/ROW]
[ROW][C]3758.43532627031[/C][/ROW]
[ROW][C]2415.04877660071[/C][/ROW]
[ROW][C]2283.12056564535[/C][/ROW]
[ROW][C]-3287.99032941725[/C][/ROW]
[ROW][C]-2220.59959183427[/C][/ROW]
[ROW][C]764.589935324901[/C][/ROW]
[ROW][C]-1764.98522860533[/C][/ROW]
[ROW][C]983.620802270152[/C][/ROW]
[ROW][C]3565.3543870345[/C][/ROW]
[ROW][C]1648.21863753514[/C][/ROW]
[ROW][C]-6048.21292014543[/C][/ROW]
[ROW][C]-2290.65327547151[/C][/ROW]
[ROW][C]-1283.92931877095[/C][/ROW]
[ROW][C]-866.172678600509[/C][/ROW]
[ROW][C]263.128968298912[/C][/ROW]
[ROW][C]2340.68042775725[/C][/ROW]
[ROW][C]-289.015806148222[/C][/ROW]
[ROW][C]960.506318509376[/C][/ROW]
[ROW][C]5768.26271657101[/C][/ROW]
[ROW][C]-1738.42070112042[/C][/ROW]
[ROW][C]-3189.68838468157[/C][/ROW]
[ROW][C]-3449.34628235071[/C][/ROW]
[ROW][C]1326.49510781144[/C][/ROW]
[ROW][C]3064.09050906203[/C][/ROW]
[ROW][C]3302.03619929814[/C][/ROW]
[ROW][C]-1438.92375913767[/C][/ROW]
[ROW][C]738.426340308916[/C][/ROW]
[ROW][C]-2458.49777075643[/C][/ROW]
[ROW][C]-313.076015392056[/C][/ROW]
[ROW][C]207.372862829155[/C][/ROW]
[ROW][C]-2820.03038822541[/C][/ROW]
[ROW][C]206.069422039697[/C][/ROW]
[ROW][C]2568.84460434019[/C][/ROW]
[ROW][C]2149.23957824789[/C][/ROW]
[ROW][C]610.844403848251[/C][/ROW]
[ROW][C]984.744791588699[/C][/ROW]
[ROW][C]-56.0510981112402[/C][/ROW]
[ROW][C]-1422.52300896263[/C][/ROW]
[ROW][C]-945.011679534977[/C][/ROW]
[ROW][C]3413.92269837677[/C][/ROW]
[ROW][C]6297.54984595263[/C][/ROW]
[ROW][C]-3608.32518878319[/C][/ROW]
[ROW][C]1474.04174626629[/C][/ROW]
[ROW][C]4029.64263025447[/C][/ROW]
[ROW][C]1098.54246224991[/C][/ROW]
[ROW][C]-7539.07503772157[/C][/ROW]
[ROW][C]6302.59012220348[/C][/ROW]
[ROW][C]-8699.63262990417[/C][/ROW]
[ROW][C]-5311.56836149783[/C][/ROW]
[ROW][C]-1623.36247746683[/C][/ROW]
[ROW][C]1361.35537752364[/C][/ROW]
[ROW][C]2816.73667530928[/C][/ROW]
[ROW][C]446.099079753912[/C][/ROW]
[ROW][C]7157.26957255252[/C][/ROW]
[ROW][C]-1797.26412136786[/C][/ROW]
[ROW][C]1736.22871732783[/C][/ROW]
[ROW][C]-7548.19094396847[/C][/ROW]
[ROW][C]379.330029056768[/C][/ROW]
[ROW][C]-3151.45173445705[/C][/ROW]
[/TABLE]
Source: https://freestatistics.org/blog/index.php?pk=&T=2

Globally Unique Identifier (entire table): ba.freestatistics.org/blog/index.php?pk=&T=2

As an alternative you can also use a QR Code:  

The GUIDs for individual cells are displayed in the table below:

Estimated ARIMA Residuals
Value
-9.27753156242031
2533.67270465325
-2252.75515873223
-396.004247166278
576.374898452774
-510.86902663973
-487.819787696807
3025.92308494567
-1497.9330934888
-1947.31726957714
973.360511667794
-461.698341379881
780.540836544352
1028.11764909279
-572.772969101307
-1818.20849492873
499.644081682076
437.432694401368
-912.994083430627
244.588722162142
847.886012783666
-652.082560299296
1063.56518461534
1337.64280968736
-511.150834396315
1336.71467013244
-1460.56525884502
-1061.42030044969
368.715211502247
-34.041822456114
-680.189371134379
-1149.14004127745
2475.87751919859
-777.12718446834
-242.687640577298
1752.84200343628
2224.59097502664
3051.12334999927
-96.3998900848
-3397.90633695913
-4605.48930513596
-1428.73283906572
-322.937953050988
2255.80793141743
-1890.80296443086
-1753.11051013613
1772.62766925951
1158.07955825452
-1081.33508272042
1020.31674769605
-1458.01499290325
-1601.19571991463
1743.82329402409
2616.21721157436
4771.33296363251
-1867.44794234527
-3488.04400453841
35.849791698409
285.961384717061
-22.3311342675106
1541.12600054921
-2037.55288593697
-924.351356186317
3758.43532627031
2415.04877660071
2283.12056564535
-3287.99032941725
-2220.59959183427
764.589935324901
-1764.98522860533
983.620802270152
3565.3543870345
1648.21863753514
-6048.21292014543
-2290.65327547151
-1283.92931877095
-866.172678600509
263.128968298912
2340.68042775725
-289.015806148222
960.506318509376
5768.26271657101
-1738.42070112042
-3189.68838468157
-3449.34628235071
1326.49510781144
3064.09050906203
3302.03619929814
-1438.92375913767
738.426340308916
-2458.49777075643
-313.076015392056
207.372862829155
-2820.03038822541
206.069422039697
2568.84460434019
2149.23957824789
610.844403848251
984.744791588699
-56.0510981112402
-1422.52300896263
-945.011679534977
3413.92269837677
6297.54984595263
-3608.32518878319
1474.04174626629
4029.64263025447
1098.54246224991
-7539.07503772157
6302.59012220348
-8699.63262990417
-5311.56836149783
-1623.36247746683
1361.35537752364
2816.73667530928
446.099079753912
7157.26957255252
-1797.26412136786
1736.22871732783
-7548.19094396847
379.330029056768
-3151.45173445705


Parameters (Session):
par1 = 1111110.9520012DefaultDefaultDefaultDefaultDefaultDefaultDefaultDefault1DefaultDefault36361111111111111111144436444FALSEFALSEFALSEFALSE ; par2 = 2222220518111111111.01.01110111101111001001112121TripleDoubleTriple1111 ; par3 = TRUETRUETRUEFALSETRUETRUE0BFGS010100111111100001001110000000BFGSBFGS1additiveadditiveadditive1111 ; par4 = P1 P5 Q1 Q3 P95 P99000001101110111412411444444411401212121001 ; par5 = 1212121212121212121212121214444 ; par6 = White NoiseWhite NoiseWhite NoiseWhite NoiseWhite NoiseWhite NoiseWhite NoiseWhite NoiseWhite NoiseWhite NoiseWhite NoiseWhite NoiseWhite NoiseWhite Noise2222 ; par7 = 0.950.950.950.950.950.950.950.950.950.950.950000 ; par8 = 2222 ; par9 = 0000 ;
Parameters (R input):
par1 = FALSE ; par2 = 1 ; par3 = 1 ; par4 = 1 ; par5 = 4 ; par6 = 2 ; par7 = 0 ; par8 = 2 ; par9 = 0 ;
R code (references can be found in the software module):
par9 <- '0'
par8 <- '2'
par7 <- '0'
par6 <- '2'
par5 <- '4'
par4 <- '0'
par3 <- '1'
par2 <- '1'
par1 <- 'FALSE'
library(lattice)
if (par1 == 'TRUE') par1 <- TRUE
if (par1 == 'FALSE') par1 <- FALSE
par2 <- as.numeric(par2) #Box-Cox lambda transformation parameter
par3 <- as.numeric(par3) #degree of non-seasonal differencing
par4 <- as.numeric(par4) #degree of seasonal differencing
par5 <- as.numeric(par5) #seasonal period
par6 <- as.numeric(par6) #degree (p) of the non-seasonal AR(p) polynomial
par7 <- as.numeric(par7) #degree (q) of the non-seasonal MA(q) polynomial
par8 <- as.numeric(par8) #degree (P) of the seasonal AR(P) polynomial
par9 <- as.numeric(par9) #degree (Q) of the seasonal MA(Q) polynomial
armaGR <- function(arima.out, names, n){
try1 <- arima.out$coef
try2 <- sqrt(diag(arima.out$var.coef))
try.data.frame <- data.frame(matrix(NA,ncol=4,nrow=length(names)))
dimnames(try.data.frame) <- list(names,c('coef','std','tstat','pv'))
try.data.frame[,1] <- try1
for(i in 1:length(try2)) try.data.frame[which(rownames(try.data.frame)==names(try2)[i]),2] <- try2[i]
try.data.frame[,3] <- try.data.frame[,1] / try.data.frame[,2]
try.data.frame[,4] <- round((1-pt(abs(try.data.frame[,3]),df=n-(length(try2)+1)))*2,5)
vector <- rep(NA,length(names))
vector[is.na(try.data.frame[,4])] <- 0
maxi <- which.max(try.data.frame[,4])
continue <- max(try.data.frame[,4],na.rm=TRUE) > .05
vector[maxi] <- 0
list(summary=try.data.frame,next.vector=vector,continue=continue)
}
arimaSelect <- function(series, order=c(13,0,0), seasonal=list(order=c(2,0,0),period=12), include.mean=F){
nrc <- order[1]+order[3]+seasonal$order[1]+seasonal$order[3]
coeff <- matrix(NA, nrow=nrc*2, ncol=nrc)
pval <- matrix(NA, nrow=nrc*2, ncol=nrc)
mylist <- rep(list(NULL), nrc)
names <- NULL
if(order[1] > 0) names <- paste('ar',1:order[1],sep='')
if(order[3] > 0) names <- c( names , paste('ma',1:order[3],sep='') )
if(seasonal$order[1] > 0) names <- c(names, paste('sar',1:seasonal$order[1],sep=''))
if(seasonal$order[3] > 0) names <- c(names, paste('sma',1:seasonal$order[3],sep=''))
arima.out <- arima(series, order=order, seasonal=seasonal, include.mean=include.mean, method='ML')
mylist[[1]] <- arima.out
last.arma <- armaGR(arima.out, names, length(series))
mystop <- FALSE
i <- 1
coeff[i,] <- last.arma[[1]][,1]
pval [i,] <- last.arma[[1]][,4]
i <- 2
aic <- arima.out$aic
while(!mystop){
mylist[[i]] <- arima.out
arima.out <- arima(series, order=order, seasonal=seasonal, include.mean=include.mean, method='ML', fixed=last.arma$next.vector)
aic <- c(aic, arima.out$aic)
last.arma <- armaGR(arima.out, names, length(series))
mystop <- !last.arma$continue
coeff[i,] <- last.arma[[1]][,1]
pval [i,] <- last.arma[[1]][,4]
i <- i+1
}
list(coeff, pval, mylist, aic=aic)
}
arimaSelectplot <- function(arimaSelect.out,noms,choix){
noms <- names(arimaSelect.out[[3]][[1]]$coef)
coeff <- arimaSelect.out[[1]]
k <- min(which(is.na(coeff[,1])))-1
coeff <- coeff[1:k,]
pval <- arimaSelect.out[[2]][1:k,]
aic <- arimaSelect.out$aic[1:k]
coeff[coeff==0] <- NA
n <- ncol(coeff)
if(missing(choix)) choix <- k
layout(matrix(c(1,1,1,2,
3,3,3,2,
3,3,3,4,
5,6,7,7),nr=4),
widths=c(10,35,45,15),
heights=c(30,30,15,15))
couleurs <- rainbow(75)[1:50]#(50)
ticks <- pretty(coeff)
par(mar=c(1,1,3,1))
plot(aic,k:1-.5,type='o',pch=21,bg='blue',cex=2,axes=F,lty=2,xpd=NA)
points(aic[choix],k-choix+.5,pch=21,cex=4,bg=2,xpd=NA)
title('aic',line=2)
par(mar=c(3,0,0,0))
plot(0,axes=F,xlab='',ylab='',xlim=range(ticks),ylim=c(.1,1))
rect(xleft = min(ticks) + (0:49)/50*(max(ticks)-min(ticks)),
xright = min(ticks) + (1:50)/50*(max(ticks)-min(ticks)),
ytop = rep(1,50),
ybottom= rep(0,50),col=couleurs,border=NA)
axis(1,ticks)
rect(xleft=min(ticks),xright=max(ticks),ytop=1,ybottom=0)
text(mean(coeff,na.rm=T),.5,'coefficients',cex=2,font=2)
par(mar=c(1,1,3,1))
image(1:n,1:k,t(coeff[k:1,]),axes=F,col=couleurs,zlim=range(ticks))
for(i in 1:n) for(j in 1:k) if(!is.na(coeff[j,i])) {
if(pval[j,i]<.01) symb = 'green'
else if( (pval[j,i]<.05) & (pval[j,i]>=.01)) symb = 'orange'
else if( (pval[j,i]<.1) & (pval[j,i]>=.05)) symb = 'red'
else symb = 'black'
polygon(c(i+.5 ,i+.2 ,i+.5 ,i+.5),
c(k-j+0.5,k-j+0.5,k-j+0.8,k-j+0.5),
col=symb)
if(j==choix) {
rect(xleft=i-.5,
xright=i+.5,
ybottom=k-j+1.5,
ytop=k-j+.5,
lwd=4)
text(i,
k-j+1,
round(coeff[j,i],2),
cex=1.2,
font=2)
}
else{
rect(xleft=i-.5,xright=i+.5,ybottom=k-j+1.5,ytop=k-j+.5)
text(i,k-j+1,round(coeff[j,i],2),cex=1.2,font=1)
}
}
axis(3,1:n,noms)
par(mar=c(0.5,0,0,0.5))
plot(0,axes=F,xlab='',ylab='',type='n',xlim=c(0,8),ylim=c(-.2,.8))
cols <- c('green','orange','red','black')
niv <- c('0','0.01','0.05','0.1')
for(i in 0:3){
polygon(c(1+2*i ,1+2*i ,1+2*i-.5 ,1+2*i),
c(.4 ,.7 , .4 , .4),
col=cols[i+1])
text(2*i,0.5,niv[i+1],cex=1.5)
}
text(8,.5,1,cex=1.5)
text(4,0,'p-value',cex=2)
box()
residus <- arimaSelect.out[[3]][[choix]]$res
par(mar=c(1,2,4,1))
acf(residus,main='')
title('acf',line=.5)
par(mar=c(1,2,4,1))
pacf(residus,main='')
title('pacf',line=.5)
par(mar=c(2,2,4,1))
qqnorm(residus,main='')
title('qq-norm',line=.5)
qqline(residus)
residus
}
if (par2 == 0) x <- log(x)
if (par2 != 0) x <- x^par2
(selection <- arimaSelect(x, order=c(par6,par3,par7), seasonal=list(order=c(par8,par4,par9), period=par5)))
bitmap(file='test1.png')
resid <- arimaSelectplot(selection)
dev.off()
resid
bitmap(file='test2.png')
acf(resid,length(resid)/2, main='Residual Autocorrelation Function')
dev.off()
bitmap(file='test3.png')
pacf(resid,length(resid)/2, main='Residual Partial Autocorrelation Function')
dev.off()
bitmap(file='test4.png')
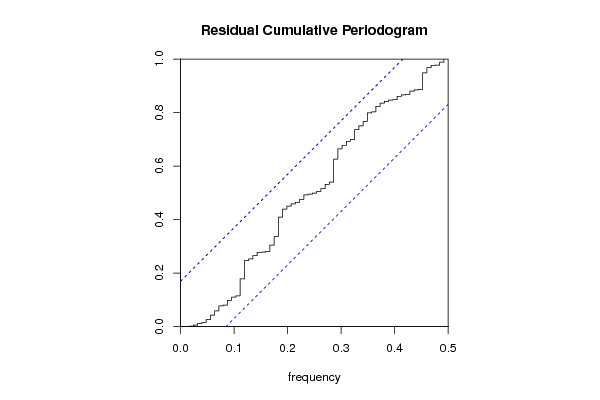
cpgram(resid, main='Residual Cumulative Periodogram')
dev.off()
bitmap(file='test5.png')
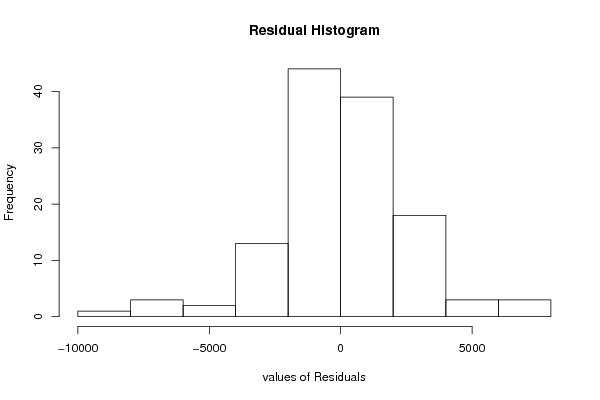
hist(resid, main='Residual Histogram', xlab='values of Residuals')
dev.off()
bitmap(file='test6.png')
densityplot(~resid,col='black',main='Residual Density Plot', xlab='values of Residuals')
dev.off()
bitmap(file='test7.png')
qqnorm(resid, main='Residual Normal Q-Q Plot')
qqline(resid)
dev.off()
ncols <- length(selection[[1]][1,])
nrows <- length(selection[[2]][,1])-1
load(file='createtable')
a<-table.start()
a<-table.row.start(a)
a<-table.element(a,'ARIMA Parameter Estimation and Backward Selection', ncols+1,TRUE)
a<-table.row.end(a)
a<-table.row.start(a)
a<-table.element(a,'Iteration', header=TRUE)
for (i in 1:ncols) {
a<-table.element(a,names(selection[[3]][[1]]$coef)[i],header=TRUE)
}
a<-table.row.end(a)
for (j in 1:nrows) {
a<-table.row.start(a)
mydum <- 'Estimates ('
mydum <- paste(mydum,j)
mydum <- paste(mydum,')')
a<-table.element(a,mydum, header=TRUE)
for (i in 1:ncols) {
a<-table.element(a,round(selection[[1]][j,i],4))
}
a<-table.row.end(a)
a<-table.row.start(a)
a<-table.element(a,'(p-val)', header=TRUE)
for (i in 1:ncols) {
mydum <- '('
mydum <- paste(mydum,round(selection[[2]][j,i],4),sep='')
mydum <- paste(mydum,')')
a<-table.element(a,mydum)
}
a<-table.row.end(a)
}
a<-table.end(a)
table.save(a,file='mytable.tab')
a<-table.start()
a<-table.row.start(a)
a<-table.element(a,'Estimated ARIMA Residuals', 1,TRUE)
a<-table.row.end(a)
a<-table.row.start(a)
a<-table.element(a,'Value', 1,TRUE)
a<-table.row.end(a)
for (i in (par4*par5+par3):length(resid)) {
a<-table.row.start(a)
a<-table.element(a,resid[i])
a<-table.row.end(a)
}
a<-table.end(a)
table.save(a,file='mytable1.tab')