Free Statistics

of Irreproducible Research!

Author's title

Author*The author of this computation has been verified*
R Software Modulerwasp_decompose.wasp
Title produced by softwareClassical Decomposition
Date of computationSun, 18 Dec 2016 19:57:41 +0100
Cite this page as followsStatistical Computations at FreeStatistics.org, Office for Research Development and Education, URL https://freestatistics.org/blog/index.php?v=date/2016/Dec/18/t1482087554i2h2ve5tnouz8r1.htm/, Retrieved Thu, 09 May 2024 01:20:37 +0000
Statistical Computations at FreeStatistics.org, Office for Research Development and Education, URL https://freestatistics.org/blog/index.php?pk=301220, Retrieved Thu, 09 May 2024 01:20:37 +0000
QR Codes:

Original text written by user:
IsPrivate?No (this computation is public)
User-defined keywords
Estimated Impact66
Family? (F = Feedback message, R = changed R code, M = changed R Module, P = changed Parameters, D = changed Data)
-       [Classical Decomposition] [Classical decompo...] [2016-12-18 18:57:41] [6c55ad42faec53ff18247bf53b5ba716] [Current]
Feedback Forum

Post a new message
Dataseries X:
7147
8001
9052
9066
8979
8988
8917
8874
8554
8241
8100
7908
7916
7848
7868
7915
7863
7625
7462


Summary of computational transaction
Raw Input view raw input (R code)
Raw Outputview raw output of R engine
Computing time2 seconds
R ServerBig Analytics Cloud Computing Center

\begin{tabular}{lllllllll}
\hline
Summary of computational transaction \tabularnewline
Raw Input view raw input (R code)  \tabularnewline
Raw Outputview raw output of R engine  \tabularnewline
Computing time2 seconds \tabularnewline
R ServerBig Analytics Cloud Computing Center \tabularnewline
\hline
\end{tabular}
%Source: https://freestatistics.org/blog/index.php?pk=301220&T=0

[TABLE]
[ROW]
Summary of computational transaction[/C][/ROW] [ROW]Raw Input[/C] view raw input (R code) [/C][/ROW] [ROW]Raw Output[/C]view raw output of R engine [/C][/ROW] [ROW]Computing time[/C]2 seconds[/C][/ROW] [ROW]R Server[/C]Big Analytics Cloud Computing Center[/C][/ROW] [/TABLE] Source: https://freestatistics.org/blog/index.php?pk=301220&T=0

Globally Unique Identifier (entire table): ba.freestatistics.org/blog/index.php?pk=301220&T=0

As an alternative you can also use a QR Code:  

The GUIDs for individual cells are displayed in the table below:

Summary of computational transaction
Raw Input view raw input (R code)
Raw Outputview raw output of R engine
Computing time2 seconds
R ServerBig Analytics Cloud Computing Center


Classical Decomposition by Moving Averages
tObservationsFitTrendSeasonalRandom
17147NANA21.0556NA
280018029.198050.25-21.0556-28.1944
390528813.818792.7521.0556238.194
490669019.699040.75-21.055646.3056
589799024.06900321.0556-45.0556
689888946.948968-21.055641.0556
789178945.06892421.0556-28.0556
888748783.698804.75-21.055690.3056
985548576.818555.7521.0556-22.8056
1082418262.948284-21.0556-21.9444
1181008108.318087.2521.0556-8.30556
1279087936.947958-21.0556-28.9444
1379167918.06789721.0556-2.05556
1478487848.947870-21.0556-0.944444
1578687895.817874.7521.0556-27.8056
1679157869.197890.25-21.055645.8056
1778637837.567816.521.055625.4444
1876257622.697643.75-21.05562.30556
197462NANA21.0556NA

\begin{tabular}{lllllllll}
\hline
Classical Decomposition by Moving Averages \tabularnewline
t & Observations & Fit & Trend & Seasonal & Random \tabularnewline
1 & 7147 & NA & NA & 21.0556 & NA \tabularnewline
2 & 8001 & 8029.19 & 8050.25 & -21.0556 & -28.1944 \tabularnewline
3 & 9052 & 8813.81 & 8792.75 & 21.0556 & 238.194 \tabularnewline
4 & 9066 & 9019.69 & 9040.75 & -21.0556 & 46.3056 \tabularnewline
5 & 8979 & 9024.06 & 9003 & 21.0556 & -45.0556 \tabularnewline
6 & 8988 & 8946.94 & 8968 & -21.0556 & 41.0556 \tabularnewline
7 & 8917 & 8945.06 & 8924 & 21.0556 & -28.0556 \tabularnewline
8 & 8874 & 8783.69 & 8804.75 & -21.0556 & 90.3056 \tabularnewline
9 & 8554 & 8576.81 & 8555.75 & 21.0556 & -22.8056 \tabularnewline
10 & 8241 & 8262.94 & 8284 & -21.0556 & -21.9444 \tabularnewline
11 & 8100 & 8108.31 & 8087.25 & 21.0556 & -8.30556 \tabularnewline
12 & 7908 & 7936.94 & 7958 & -21.0556 & -28.9444 \tabularnewline
13 & 7916 & 7918.06 & 7897 & 21.0556 & -2.05556 \tabularnewline
14 & 7848 & 7848.94 & 7870 & -21.0556 & -0.944444 \tabularnewline
15 & 7868 & 7895.81 & 7874.75 & 21.0556 & -27.8056 \tabularnewline
16 & 7915 & 7869.19 & 7890.25 & -21.0556 & 45.8056 \tabularnewline
17 & 7863 & 7837.56 & 7816.5 & 21.0556 & 25.4444 \tabularnewline
18 & 7625 & 7622.69 & 7643.75 & -21.0556 & 2.30556 \tabularnewline
19 & 7462 & NA & NA & 21.0556 & NA \tabularnewline
\hline
\end{tabular}
%Source: https://freestatistics.org/blog/index.php?pk=301220&T=1

[TABLE]
[ROW][C]Classical Decomposition by Moving Averages[/C][/ROW]
[ROW][C]t[/C][C]Observations[/C][C]Fit[/C][C]Trend[/C][C]Seasonal[/C][C]Random[/C][/ROW]
[ROW][C]1[/C][C]7147[/C][C]NA[/C][C]NA[/C][C]21.0556[/C][C]NA[/C][/ROW]
[ROW][C]2[/C][C]8001[/C][C]8029.19[/C][C]8050.25[/C][C]-21.0556[/C][C]-28.1944[/C][/ROW]
[ROW][C]3[/C][C]9052[/C][C]8813.81[/C][C]8792.75[/C][C]21.0556[/C][C]238.194[/C][/ROW]
[ROW][C]4[/C][C]9066[/C][C]9019.69[/C][C]9040.75[/C][C]-21.0556[/C][C]46.3056[/C][/ROW]
[ROW][C]5[/C][C]8979[/C][C]9024.06[/C][C]9003[/C][C]21.0556[/C][C]-45.0556[/C][/ROW]
[ROW][C]6[/C][C]8988[/C][C]8946.94[/C][C]8968[/C][C]-21.0556[/C][C]41.0556[/C][/ROW]
[ROW][C]7[/C][C]8917[/C][C]8945.06[/C][C]8924[/C][C]21.0556[/C][C]-28.0556[/C][/ROW]
[ROW][C]8[/C][C]8874[/C][C]8783.69[/C][C]8804.75[/C][C]-21.0556[/C][C]90.3056[/C][/ROW]
[ROW][C]9[/C][C]8554[/C][C]8576.81[/C][C]8555.75[/C][C]21.0556[/C][C]-22.8056[/C][/ROW]
[ROW][C]10[/C][C]8241[/C][C]8262.94[/C][C]8284[/C][C]-21.0556[/C][C]-21.9444[/C][/ROW]
[ROW][C]11[/C][C]8100[/C][C]8108.31[/C][C]8087.25[/C][C]21.0556[/C][C]-8.30556[/C][/ROW]
[ROW][C]12[/C][C]7908[/C][C]7936.94[/C][C]7958[/C][C]-21.0556[/C][C]-28.9444[/C][/ROW]
[ROW][C]13[/C][C]7916[/C][C]7918.06[/C][C]7897[/C][C]21.0556[/C][C]-2.05556[/C][/ROW]
[ROW][C]14[/C][C]7848[/C][C]7848.94[/C][C]7870[/C][C]-21.0556[/C][C]-0.944444[/C][/ROW]
[ROW][C]15[/C][C]7868[/C][C]7895.81[/C][C]7874.75[/C][C]21.0556[/C][C]-27.8056[/C][/ROW]
[ROW][C]16[/C][C]7915[/C][C]7869.19[/C][C]7890.25[/C][C]-21.0556[/C][C]45.8056[/C][/ROW]
[ROW][C]17[/C][C]7863[/C][C]7837.56[/C][C]7816.5[/C][C]21.0556[/C][C]25.4444[/C][/ROW]
[ROW][C]18[/C][C]7625[/C][C]7622.69[/C][C]7643.75[/C][C]-21.0556[/C][C]2.30556[/C][/ROW]
[ROW][C]19[/C][C]7462[/C][C]NA[/C][C]NA[/C][C]21.0556[/C][C]NA[/C][/ROW]
[/TABLE]
Source: https://freestatistics.org/blog/index.php?pk=301220&T=1

Globally Unique Identifier (entire table): ba.freestatistics.org/blog/index.php?pk=301220&T=1

As an alternative you can also use a QR Code:  

The GUIDs for individual cells are displayed in the table below:

Classical Decomposition by Moving Averages
tObservationsFitTrendSeasonalRandom
17147NANA21.0556NA
280018029.198050.25-21.0556-28.1944
390528813.818792.7521.0556238.194
490669019.699040.75-21.055646.3056
589799024.06900321.0556-45.0556
689888946.948968-21.055641.0556
789178945.06892421.0556-28.0556
888748783.698804.75-21.055690.3056
985548576.818555.7521.0556-22.8056
1082418262.948284-21.0556-21.9444
1181008108.318087.2521.0556-8.30556
1279087936.947958-21.0556-28.9444
1379167918.06789721.0556-2.05556
1478487848.947870-21.0556-0.944444
1578687895.817874.7521.0556-27.8056
1679157869.197890.25-21.055645.8056
1778637837.567816.521.055625.4444
1876257622.697643.75-21.05562.30556
197462NANA21.0556NA


Parameters (Session):
par1 = Default ; par2 = 1 ; par3 = 1 ; par4 = 0 ; par5 = 12 ; par6 = White Noise ; par7 = 0.95 ;
Parameters (R input):
par1 = additive ; par2 = 2 ;
R code (references can be found in the software module):
par2 <- '1'
par1 <- 'additive'
par2 <- as.numeric(par2)
x <- ts(x,freq=par2)
m <- decompose(x,type=par1)
m$figure
bitmap(file='test1.png')
plot(m)
dev.off()
mylagmax <- length(x)/2
bitmap(file='test2.png')
op <- par(mfrow = c(2,2))
acf(as.numeric(x),lag.max = mylagmax,main='Observed')
acf(as.numeric(m$trend),na.action=na.pass,lag.max = mylagmax,main='Trend')
acf(as.numeric(m$seasonal),na.action=na.pass,lag.max = mylagmax,main='Seasonal')
acf(as.numeric(m$random),na.action=na.pass,lag.max = mylagmax,main='Random')
par(op)
dev.off()
bitmap(file='test3.png')
op <- par(mfrow = c(2,2))
spectrum(as.numeric(x),main='Observed')
spectrum(as.numeric(m$trend[!is.na(m$trend)]),main='Trend')
spectrum(as.numeric(m$seasonal[!is.na(m$seasonal)]),main='Seasonal')
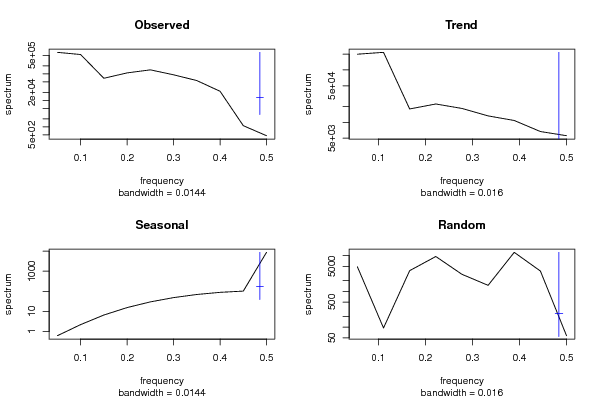
spectrum(as.numeric(m$random[!is.na(m$random)]),main='Random')
par(op)
dev.off()
bitmap(file='test4.png')
op <- par(mfrow = c(2,2))
cpgram(as.numeric(x),main='Observed')
cpgram(as.numeric(m$trend[!is.na(m$trend)]),main='Trend')
cpgram(as.numeric(m$seasonal[!is.na(m$seasonal)]),main='Seasonal')
cpgram(as.numeric(m$random[!is.na(m$random)]),main='Random')
par(op)
dev.off()
load(file='createtable')
a<-table.start()
a<-table.row.start(a)
a<-table.element(a,'Classical Decomposition by Moving Averages',6,TRUE)
a<-table.row.end(a)
a<-table.row.start(a)
a<-table.element(a,'t',header=TRUE)
a<-table.element(a,'Observations',header=TRUE)
a<-table.element(a,'Fit',header=TRUE)
a<-table.element(a,'Trend',header=TRUE)
a<-table.element(a,'Seasonal',header=TRUE)
a<-table.element(a,'Random',header=TRUE)
a<-table.row.end(a)
for (i in 1:length(m$trend)) {
a<-table.row.start(a)
a<-table.element(a,i,header=TRUE)
a<-table.element(a,x[i])
if (par1 == 'additive') a<-table.element(a,signif(m$trend[i]+m$seasonal[i],6)) else a<-table.element(a,signif(m$trend[i]*m$seasonal[i],6))
a<-table.element(a,signif(m$trend[i],6))
a<-table.element(a,signif(m$seasonal[i],6))
a<-table.element(a,signif(m$random[i],6))
a<-table.row.end(a)
}
a<-table.end(a)
table.save(a,file='mytable.tab')