Free Statistics

of Irreproducible Research!

Author's title

Author*The author of this computation has been verified*
R Software Modulerwasp_autocorrelation.wasp
Title produced by software(Partial) Autocorrelation Function
Date of computationSun, 18 Dec 2016 22:16:07 +0100
Cite this page as followsStatistical Computations at FreeStatistics.org, Office for Research Development and Education, URL https://freestatistics.org/blog/index.php?v=date/2016/Dec/18/t1482095783ph9cjpyzvy7ujwv.htm/, Retrieved Wed, 08 May 2024 14:01:16 +0000
Statistical Computations at FreeStatistics.org, Office for Research Development and Education, URL https://freestatistics.org/blog/index.php?pk=301249, Retrieved Wed, 08 May 2024 14:01:16 +0000
QR Codes:

Original text written by user:
IsPrivate?No (this computation is public)
User-defined keywords
Estimated Impact61
Family? (F = Feedback message, R = changed R code, M = changed R Module, P = changed Parameters, D = changed Data)
-       [(Partial) Autocorrelation Function] [] [2016-12-18 21:16:07] [8e62cbb8023b87d93040197279d31dd8] [Current]
Feedback Forum

Post a new message
Dataseries X:
5731
5461
4594
3770
3551
3094
3020
3081
3041
3087
3455
3225
3177
2551
1680
1599
1846
1990
2238
2089
2230
2468
2675
2989
2868
2564
1583
1435
1297
1266
1607
1819
2039
1817
1833
2442
2157
1870
1057
660
1057
1127
1096
1018
1184
1690
1868
2019
2170
1994
917
566
727
980
1138
1069
1039
1509
1591
2056
1975
1748
738
1039
1038
1054
1689
1726
2101
2325
2155
2190
1725
1404
571
704
1061
1593
2039
1767
1804
1520
1795
2171
1853
1425
835
927
1204
1408
1828
1788
1878
1513
1538
2273
2223
1833
1380
1081
1586
1809
1737
1896
2248
2116
2416
2934
2513
1958
986
1378
2071
2272
2474
NA
NA
NA
NA
NA
NA
NA
NA
NA
NA
NA
NA
NA
NA
NA
NA
NA
NA
NA
NA
NA
NA
NA
NA
NA
NA
NA
NA
NA


Summary of computational transaction
Raw Input view raw input (R code)
Raw Outputview raw output of R engine
Computing time2 seconds
R ServerBig Analytics Cloud Computing Center

\begin{tabular}{lllllllll}
\hline
Summary of computational transaction \tabularnewline
Raw Input view raw input (R code)  \tabularnewline
Raw Outputview raw output of R engine  \tabularnewline
Computing time2 seconds \tabularnewline
R ServerBig Analytics Cloud Computing Center \tabularnewline
\hline
\end{tabular}
%Source: https://freestatistics.org/blog/index.php?pk=301249&T=0

[TABLE]
[ROW]
Summary of computational transaction[/C][/ROW] [ROW]Raw Input[/C] view raw input (R code) [/C][/ROW] [ROW]Raw Output[/C]view raw output of R engine [/C][/ROW] [ROW]Computing time[/C]2 seconds[/C][/ROW] [ROW]R Server[/C]Big Analytics Cloud Computing Center[/C][/ROW] [/TABLE] Source: https://freestatistics.org/blog/index.php?pk=301249&T=0

Globally Unique Identifier (entire table): ba.freestatistics.org/blog/index.php?pk=301249&T=0

As an alternative you can also use a QR Code:  

The GUIDs for individual cells are displayed in the table below:

Summary of computational transaction
Raw Input view raw input (R code)
Raw Outputview raw output of R engine
Computing time2 seconds
R ServerBig Analytics Cloud Computing Center


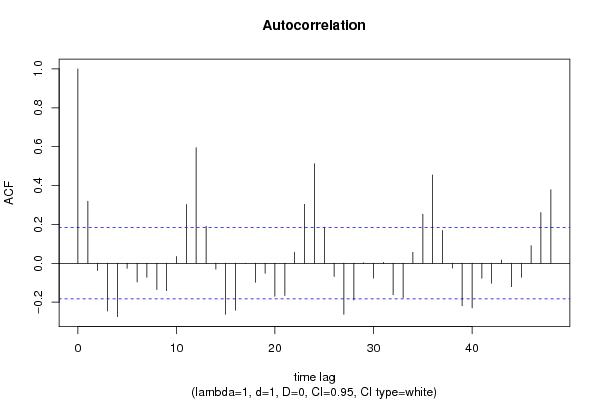
Autocorrelation Function
Time lag kACF(k)T-STATP-value
10.3188853.40480.000457
2-0.037797-0.40360.343645
3-0.245785-2.62430.004937
4-0.27483-2.93440.002021
5-0.02549-0.27220.392997
6-0.096241-1.02760.153162
7-0.071871-0.76740.222224
8-0.1353-1.44460.075655
9-0.141128-1.50680.06731
100.0350690.37440.35439
110.3021653.22620.000819
120.5947956.35070
130.1905532.03450.022109
14-0.030335-0.32390.373307
15-0.262242-2.80.003002
16-0.241834-2.58210.005544
17-0.000169-0.00180.499283
18-0.097483-1.04080.150079
19-0.051124-0.54590.293115
20-0.170227-1.81750.035881
21-0.166174-1.77430.039345
220.0571590.61030.271443
230.3030813.2360.000793
240.5119565.46620
250.1852711.97810.025162
26-0.068284-0.72910.233727
27-0.262383-2.80150.002989
28-0.188822-2.01610.023072
290.0019280.02060.491804
30-0.076593-0.81780.207591
310.0047080.05030.479997
32-0.162546-1.73550.042675
33-0.176313-1.88250.031159
340.0562340.60040.274713
350.2520662.69130.004094
360.4546434.85432e-06
370.1689731.80410.036925
38-0.024176-0.25810.398387
39-0.218654-2.33460.010658
40-0.229751-2.45310.007839
41-0.077178-0.8240.20582
42-0.103028-1.10.136817
430.0166620.17790.429557
44-0.120451-1.28610.100513
45-0.072118-0.770.221445
460.0897980.95880.169848
470.2605762.78220.00316
480.3786234.04264.8e-05

\begin{tabular}{lllllllll}
\hline
Autocorrelation Function \tabularnewline
Time lag k & ACF(k) & T-STAT & P-value \tabularnewline
1 & 0.318885 & 3.4048 & 0.000457 \tabularnewline
2 & -0.037797 & -0.4036 & 0.343645 \tabularnewline
3 & -0.245785 & -2.6243 & 0.004937 \tabularnewline
4 & -0.27483 & -2.9344 & 0.002021 \tabularnewline
5 & -0.02549 & -0.2722 & 0.392997 \tabularnewline
6 & -0.096241 & -1.0276 & 0.153162 \tabularnewline
7 & -0.071871 & -0.7674 & 0.222224 \tabularnewline
8 & -0.1353 & -1.4446 & 0.075655 \tabularnewline
9 & -0.141128 & -1.5068 & 0.06731 \tabularnewline
10 & 0.035069 & 0.3744 & 0.35439 \tabularnewline
11 & 0.302165 & 3.2262 & 0.000819 \tabularnewline
12 & 0.594795 & 6.3507 & 0 \tabularnewline
13 & 0.190553 & 2.0345 & 0.022109 \tabularnewline
14 & -0.030335 & -0.3239 & 0.373307 \tabularnewline
15 & -0.262242 & -2.8 & 0.003002 \tabularnewline
16 & -0.241834 & -2.5821 & 0.005544 \tabularnewline
17 & -0.000169 & -0.0018 & 0.499283 \tabularnewline
18 & -0.097483 & -1.0408 & 0.150079 \tabularnewline
19 & -0.051124 & -0.5459 & 0.293115 \tabularnewline
20 & -0.170227 & -1.8175 & 0.035881 \tabularnewline
21 & -0.166174 & -1.7743 & 0.039345 \tabularnewline
22 & 0.057159 & 0.6103 & 0.271443 \tabularnewline
23 & 0.303081 & 3.236 & 0.000793 \tabularnewline
24 & 0.511956 & 5.4662 & 0 \tabularnewline
25 & 0.185271 & 1.9781 & 0.025162 \tabularnewline
26 & -0.068284 & -0.7291 & 0.233727 \tabularnewline
27 & -0.262383 & -2.8015 & 0.002989 \tabularnewline
28 & -0.188822 & -2.0161 & 0.023072 \tabularnewline
29 & 0.001928 & 0.0206 & 0.491804 \tabularnewline
30 & -0.076593 & -0.8178 & 0.207591 \tabularnewline
31 & 0.004708 & 0.0503 & 0.479997 \tabularnewline
32 & -0.162546 & -1.7355 & 0.042675 \tabularnewline
33 & -0.176313 & -1.8825 & 0.031159 \tabularnewline
34 & 0.056234 & 0.6004 & 0.274713 \tabularnewline
35 & 0.252066 & 2.6913 & 0.004094 \tabularnewline
36 & 0.454643 & 4.8543 & 2e-06 \tabularnewline
37 & 0.168973 & 1.8041 & 0.036925 \tabularnewline
38 & -0.024176 & -0.2581 & 0.398387 \tabularnewline
39 & -0.218654 & -2.3346 & 0.010658 \tabularnewline
40 & -0.229751 & -2.4531 & 0.007839 \tabularnewline
41 & -0.077178 & -0.824 & 0.20582 \tabularnewline
42 & -0.103028 & -1.1 & 0.136817 \tabularnewline
43 & 0.016662 & 0.1779 & 0.429557 \tabularnewline
44 & -0.120451 & -1.2861 & 0.100513 \tabularnewline
45 & -0.072118 & -0.77 & 0.221445 \tabularnewline
46 & 0.089798 & 0.9588 & 0.169848 \tabularnewline
47 & 0.260576 & 2.7822 & 0.00316 \tabularnewline
48 & 0.378623 & 4.0426 & 4.8e-05 \tabularnewline
\hline
\end{tabular}
%Source: https://freestatistics.org/blog/index.php?pk=301249&T=1

[TABLE]
[ROW][C]Autocorrelation Function[/C][/ROW]
[ROW][C]Time lag k[/C][C]ACF(k)[/C][C]T-STAT[/C][C]P-value[/C][/ROW]
[ROW][C]1[/C][C]0.318885[/C][C]3.4048[/C][C]0.000457[/C][/ROW]
[ROW][C]2[/C][C]-0.037797[/C][C]-0.4036[/C][C]0.343645[/C][/ROW]
[ROW][C]3[/C][C]-0.245785[/C][C]-2.6243[/C][C]0.004937[/C][/ROW]
[ROW][C]4[/C][C]-0.27483[/C][C]-2.9344[/C][C]0.002021[/C][/ROW]
[ROW][C]5[/C][C]-0.02549[/C][C]-0.2722[/C][C]0.392997[/C][/ROW]
[ROW][C]6[/C][C]-0.096241[/C][C]-1.0276[/C][C]0.153162[/C][/ROW]
[ROW][C]7[/C][C]-0.071871[/C][C]-0.7674[/C][C]0.222224[/C][/ROW]
[ROW][C]8[/C][C]-0.1353[/C][C]-1.4446[/C][C]0.075655[/C][/ROW]
[ROW][C]9[/C][C]-0.141128[/C][C]-1.5068[/C][C]0.06731[/C][/ROW]
[ROW][C]10[/C][C]0.035069[/C][C]0.3744[/C][C]0.35439[/C][/ROW]
[ROW][C]11[/C][C]0.302165[/C][C]3.2262[/C][C]0.000819[/C][/ROW]
[ROW][C]12[/C][C]0.594795[/C][C]6.3507[/C][C]0[/C][/ROW]
[ROW][C]13[/C][C]0.190553[/C][C]2.0345[/C][C]0.022109[/C][/ROW]
[ROW][C]14[/C][C]-0.030335[/C][C]-0.3239[/C][C]0.373307[/C][/ROW]
[ROW][C]15[/C][C]-0.262242[/C][C]-2.8[/C][C]0.003002[/C][/ROW]
[ROW][C]16[/C][C]-0.241834[/C][C]-2.5821[/C][C]0.005544[/C][/ROW]
[ROW][C]17[/C][C]-0.000169[/C][C]-0.0018[/C][C]0.499283[/C][/ROW]
[ROW][C]18[/C][C]-0.097483[/C][C]-1.0408[/C][C]0.150079[/C][/ROW]
[ROW][C]19[/C][C]-0.051124[/C][C]-0.5459[/C][C]0.293115[/C][/ROW]
[ROW][C]20[/C][C]-0.170227[/C][C]-1.8175[/C][C]0.035881[/C][/ROW]
[ROW][C]21[/C][C]-0.166174[/C][C]-1.7743[/C][C]0.039345[/C][/ROW]
[ROW][C]22[/C][C]0.057159[/C][C]0.6103[/C][C]0.271443[/C][/ROW]
[ROW][C]23[/C][C]0.303081[/C][C]3.236[/C][C]0.000793[/C][/ROW]
[ROW][C]24[/C][C]0.511956[/C][C]5.4662[/C][C]0[/C][/ROW]
[ROW][C]25[/C][C]0.185271[/C][C]1.9781[/C][C]0.025162[/C][/ROW]
[ROW][C]26[/C][C]-0.068284[/C][C]-0.7291[/C][C]0.233727[/C][/ROW]
[ROW][C]27[/C][C]-0.262383[/C][C]-2.8015[/C][C]0.002989[/C][/ROW]
[ROW][C]28[/C][C]-0.188822[/C][C]-2.0161[/C][C]0.023072[/C][/ROW]
[ROW][C]29[/C][C]0.001928[/C][C]0.0206[/C][C]0.491804[/C][/ROW]
[ROW][C]30[/C][C]-0.076593[/C][C]-0.8178[/C][C]0.207591[/C][/ROW]
[ROW][C]31[/C][C]0.004708[/C][C]0.0503[/C][C]0.479997[/C][/ROW]
[ROW][C]32[/C][C]-0.162546[/C][C]-1.7355[/C][C]0.042675[/C][/ROW]
[ROW][C]33[/C][C]-0.176313[/C][C]-1.8825[/C][C]0.031159[/C][/ROW]
[ROW][C]34[/C][C]0.056234[/C][C]0.6004[/C][C]0.274713[/C][/ROW]
[ROW][C]35[/C][C]0.252066[/C][C]2.6913[/C][C]0.004094[/C][/ROW]
[ROW][C]36[/C][C]0.454643[/C][C]4.8543[/C][C]2e-06[/C][/ROW]
[ROW][C]37[/C][C]0.168973[/C][C]1.8041[/C][C]0.036925[/C][/ROW]
[ROW][C]38[/C][C]-0.024176[/C][C]-0.2581[/C][C]0.398387[/C][/ROW]
[ROW][C]39[/C][C]-0.218654[/C][C]-2.3346[/C][C]0.010658[/C][/ROW]
[ROW][C]40[/C][C]-0.229751[/C][C]-2.4531[/C][C]0.007839[/C][/ROW]
[ROW][C]41[/C][C]-0.077178[/C][C]-0.824[/C][C]0.20582[/C][/ROW]
[ROW][C]42[/C][C]-0.103028[/C][C]-1.1[/C][C]0.136817[/C][/ROW]
[ROW][C]43[/C][C]0.016662[/C][C]0.1779[/C][C]0.429557[/C][/ROW]
[ROW][C]44[/C][C]-0.120451[/C][C]-1.2861[/C][C]0.100513[/C][/ROW]
[ROW][C]45[/C][C]-0.072118[/C][C]-0.77[/C][C]0.221445[/C][/ROW]
[ROW][C]46[/C][C]0.089798[/C][C]0.9588[/C][C]0.169848[/C][/ROW]
[ROW][C]47[/C][C]0.260576[/C][C]2.7822[/C][C]0.00316[/C][/ROW]
[ROW][C]48[/C][C]0.378623[/C][C]4.0426[/C][C]4.8e-05[/C][/ROW]
[/TABLE]
Source: https://freestatistics.org/blog/index.php?pk=301249&T=1

Globally Unique Identifier (entire table): ba.freestatistics.org/blog/index.php?pk=301249&T=1

As an alternative you can also use a QR Code:  

The GUIDs for individual cells are displayed in the table below:

Autocorrelation Function
Time lag kACF(k)T-STATP-value
10.3188853.40480.000457
2-0.037797-0.40360.343645
3-0.245785-2.62430.004937
4-0.27483-2.93440.002021
5-0.02549-0.27220.392997
6-0.096241-1.02760.153162
7-0.071871-0.76740.222224
8-0.1353-1.44460.075655
9-0.141128-1.50680.06731
100.0350690.37440.35439
110.3021653.22620.000819
120.5947956.35070
130.1905532.03450.022109
14-0.030335-0.32390.373307
15-0.262242-2.80.003002
16-0.241834-2.58210.005544
17-0.000169-0.00180.499283
18-0.097483-1.04080.150079
19-0.051124-0.54590.293115
20-0.170227-1.81750.035881
21-0.166174-1.77430.039345
220.0571590.61030.271443
230.3030813.2360.000793
240.5119565.46620
250.1852711.97810.025162
26-0.068284-0.72910.233727
27-0.262383-2.80150.002989
28-0.188822-2.01610.023072
290.0019280.02060.491804
30-0.076593-0.81780.207591
310.0047080.05030.479997
32-0.162546-1.73550.042675
33-0.176313-1.88250.031159
340.0562340.60040.274713
350.2520662.69130.004094
360.4546434.85432e-06
370.1689731.80410.036925
38-0.024176-0.25810.398387
39-0.218654-2.33460.010658
40-0.229751-2.45310.007839
41-0.077178-0.8240.20582
42-0.103028-1.10.136817
430.0166620.17790.429557
44-0.120451-1.28610.100513
45-0.072118-0.770.221445
460.0897980.95880.169848
470.2605762.78220.00316
480.3786234.04264.8e-05


Partial Autocorrelation Function
Time lag kPACF(k)T-STATP-value
10.3188853.40480.000457
2-0.155274-1.65790.050046
3-0.208002-2.22090.014169
4-0.153644-1.64050.051832
50.0963251.02850.152954
6-0.225337-2.40590.008869
7-0.081441-0.86960.193186
8-0.168106-1.79490.037662
9-0.131468-1.40370.081564
10-0.02348-0.25070.401249
110.2569472.74340.003532
120.4602594.91422e-06
13-0.120973-1.29160.099547
140.1342731.43360.077205
15-0.039388-0.42050.337439
160.0293290.31320.377369
170.0469890.50170.30842
18-0.03833-0.40930.341561
19-0.023845-0.25460.399748
20-0.165977-1.77220.03952
21-0.086523-0.92380.178768
22-0.071157-0.75970.224487
230.091290.97470.165883
240.1352881.44450.075673
25-0.001384-0.01480.49412
260.0030110.03210.487206
270.0221420.23640.406767
280.0748010.79870.213077
290.0251340.26840.394453
300.0242840.25930.397941
310.1077241.15020.126238
32-0.068375-0.730.233431
33-0.111248-1.18780.118689
34-0.012043-0.12860.448959
35-0.015219-0.16250.435601
360.0296820.31690.375941
37-0.010229-0.10920.456613
380.141011.50560.067471
39-0.054347-0.58030.281441
40-0.099833-1.06590.144354
41-0.053829-0.57470.283299
42-0.031268-0.33380.369553
430.0464890.49640.310295
440.0140120.14960.440671
450.1158411.23680.109344
46-0.048553-0.51840.30259
470.0793360.84710.199362
48-0.046517-0.49670.310192

\begin{tabular}{lllllllll}
\hline
Partial Autocorrelation Function \tabularnewline
Time lag k & PACF(k) & T-STAT & P-value \tabularnewline
1 & 0.318885 & 3.4048 & 0.000457 \tabularnewline
2 & -0.155274 & -1.6579 & 0.050046 \tabularnewline
3 & -0.208002 & -2.2209 & 0.014169 \tabularnewline
4 & -0.153644 & -1.6405 & 0.051832 \tabularnewline
5 & 0.096325 & 1.0285 & 0.152954 \tabularnewline
6 & -0.225337 & -2.4059 & 0.008869 \tabularnewline
7 & -0.081441 & -0.8696 & 0.193186 \tabularnewline
8 & -0.168106 & -1.7949 & 0.037662 \tabularnewline
9 & -0.131468 & -1.4037 & 0.081564 \tabularnewline
10 & -0.02348 & -0.2507 & 0.401249 \tabularnewline
11 & 0.256947 & 2.7434 & 0.003532 \tabularnewline
12 & 0.460259 & 4.9142 & 2e-06 \tabularnewline
13 & -0.120973 & -1.2916 & 0.099547 \tabularnewline
14 & 0.134273 & 1.4336 & 0.077205 \tabularnewline
15 & -0.039388 & -0.4205 & 0.337439 \tabularnewline
16 & 0.029329 & 0.3132 & 0.377369 \tabularnewline
17 & 0.046989 & 0.5017 & 0.30842 \tabularnewline
18 & -0.03833 & -0.4093 & 0.341561 \tabularnewline
19 & -0.023845 & -0.2546 & 0.399748 \tabularnewline
20 & -0.165977 & -1.7722 & 0.03952 \tabularnewline
21 & -0.086523 & -0.9238 & 0.178768 \tabularnewline
22 & -0.071157 & -0.7597 & 0.224487 \tabularnewline
23 & 0.09129 & 0.9747 & 0.165883 \tabularnewline
24 & 0.135288 & 1.4445 & 0.075673 \tabularnewline
25 & -0.001384 & -0.0148 & 0.49412 \tabularnewline
26 & 0.003011 & 0.0321 & 0.487206 \tabularnewline
27 & 0.022142 & 0.2364 & 0.406767 \tabularnewline
28 & 0.074801 & 0.7987 & 0.213077 \tabularnewline
29 & 0.025134 & 0.2684 & 0.394453 \tabularnewline
30 & 0.024284 & 0.2593 & 0.397941 \tabularnewline
31 & 0.107724 & 1.1502 & 0.126238 \tabularnewline
32 & -0.068375 & -0.73 & 0.233431 \tabularnewline
33 & -0.111248 & -1.1878 & 0.118689 \tabularnewline
34 & -0.012043 & -0.1286 & 0.448959 \tabularnewline
35 & -0.015219 & -0.1625 & 0.435601 \tabularnewline
36 & 0.029682 & 0.3169 & 0.375941 \tabularnewline
37 & -0.010229 & -0.1092 & 0.456613 \tabularnewline
38 & 0.14101 & 1.5056 & 0.067471 \tabularnewline
39 & -0.054347 & -0.5803 & 0.281441 \tabularnewline
40 & -0.099833 & -1.0659 & 0.144354 \tabularnewline
41 & -0.053829 & -0.5747 & 0.283299 \tabularnewline
42 & -0.031268 & -0.3338 & 0.369553 \tabularnewline
43 & 0.046489 & 0.4964 & 0.310295 \tabularnewline
44 & 0.014012 & 0.1496 & 0.440671 \tabularnewline
45 & 0.115841 & 1.2368 & 0.109344 \tabularnewline
46 & -0.048553 & -0.5184 & 0.30259 \tabularnewline
47 & 0.079336 & 0.8471 & 0.199362 \tabularnewline
48 & -0.046517 & -0.4967 & 0.310192 \tabularnewline
\hline
\end{tabular}
%Source: https://freestatistics.org/blog/index.php?pk=301249&T=2

[TABLE]
[ROW][C]Partial Autocorrelation Function[/C][/ROW]
[ROW][C]Time lag k[/C][C]PACF(k)[/C][C]T-STAT[/C][C]P-value[/C][/ROW]
[ROW][C]1[/C][C]0.318885[/C][C]3.4048[/C][C]0.000457[/C][/ROW]
[ROW][C]2[/C][C]-0.155274[/C][C]-1.6579[/C][C]0.050046[/C][/ROW]
[ROW][C]3[/C][C]-0.208002[/C][C]-2.2209[/C][C]0.014169[/C][/ROW]
[ROW][C]4[/C][C]-0.153644[/C][C]-1.6405[/C][C]0.051832[/C][/ROW]
[ROW][C]5[/C][C]0.096325[/C][C]1.0285[/C][C]0.152954[/C][/ROW]
[ROW][C]6[/C][C]-0.225337[/C][C]-2.4059[/C][C]0.008869[/C][/ROW]
[ROW][C]7[/C][C]-0.081441[/C][C]-0.8696[/C][C]0.193186[/C][/ROW]
[ROW][C]8[/C][C]-0.168106[/C][C]-1.7949[/C][C]0.037662[/C][/ROW]
[ROW][C]9[/C][C]-0.131468[/C][C]-1.4037[/C][C]0.081564[/C][/ROW]
[ROW][C]10[/C][C]-0.02348[/C][C]-0.2507[/C][C]0.401249[/C][/ROW]
[ROW][C]11[/C][C]0.256947[/C][C]2.7434[/C][C]0.003532[/C][/ROW]
[ROW][C]12[/C][C]0.460259[/C][C]4.9142[/C][C]2e-06[/C][/ROW]
[ROW][C]13[/C][C]-0.120973[/C][C]-1.2916[/C][C]0.099547[/C][/ROW]
[ROW][C]14[/C][C]0.134273[/C][C]1.4336[/C][C]0.077205[/C][/ROW]
[ROW][C]15[/C][C]-0.039388[/C][C]-0.4205[/C][C]0.337439[/C][/ROW]
[ROW][C]16[/C][C]0.029329[/C][C]0.3132[/C][C]0.377369[/C][/ROW]
[ROW][C]17[/C][C]0.046989[/C][C]0.5017[/C][C]0.30842[/C][/ROW]
[ROW][C]18[/C][C]-0.03833[/C][C]-0.4093[/C][C]0.341561[/C][/ROW]
[ROW][C]19[/C][C]-0.023845[/C][C]-0.2546[/C][C]0.399748[/C][/ROW]
[ROW][C]20[/C][C]-0.165977[/C][C]-1.7722[/C][C]0.03952[/C][/ROW]
[ROW][C]21[/C][C]-0.086523[/C][C]-0.9238[/C][C]0.178768[/C][/ROW]
[ROW][C]22[/C][C]-0.071157[/C][C]-0.7597[/C][C]0.224487[/C][/ROW]
[ROW][C]23[/C][C]0.09129[/C][C]0.9747[/C][C]0.165883[/C][/ROW]
[ROW][C]24[/C][C]0.135288[/C][C]1.4445[/C][C]0.075673[/C][/ROW]
[ROW][C]25[/C][C]-0.001384[/C][C]-0.0148[/C][C]0.49412[/C][/ROW]
[ROW][C]26[/C][C]0.003011[/C][C]0.0321[/C][C]0.487206[/C][/ROW]
[ROW][C]27[/C][C]0.022142[/C][C]0.2364[/C][C]0.406767[/C][/ROW]
[ROW][C]28[/C][C]0.074801[/C][C]0.7987[/C][C]0.213077[/C][/ROW]
[ROW][C]29[/C][C]0.025134[/C][C]0.2684[/C][C]0.394453[/C][/ROW]
[ROW][C]30[/C][C]0.024284[/C][C]0.2593[/C][C]0.397941[/C][/ROW]
[ROW][C]31[/C][C]0.107724[/C][C]1.1502[/C][C]0.126238[/C][/ROW]
[ROW][C]32[/C][C]-0.068375[/C][C]-0.73[/C][C]0.233431[/C][/ROW]
[ROW][C]33[/C][C]-0.111248[/C][C]-1.1878[/C][C]0.118689[/C][/ROW]
[ROW][C]34[/C][C]-0.012043[/C][C]-0.1286[/C][C]0.448959[/C][/ROW]
[ROW][C]35[/C][C]-0.015219[/C][C]-0.1625[/C][C]0.435601[/C][/ROW]
[ROW][C]36[/C][C]0.029682[/C][C]0.3169[/C][C]0.375941[/C][/ROW]
[ROW][C]37[/C][C]-0.010229[/C][C]-0.1092[/C][C]0.456613[/C][/ROW]
[ROW][C]38[/C][C]0.14101[/C][C]1.5056[/C][C]0.067471[/C][/ROW]
[ROW][C]39[/C][C]-0.054347[/C][C]-0.5803[/C][C]0.281441[/C][/ROW]
[ROW][C]40[/C][C]-0.099833[/C][C]-1.0659[/C][C]0.144354[/C][/ROW]
[ROW][C]41[/C][C]-0.053829[/C][C]-0.5747[/C][C]0.283299[/C][/ROW]
[ROW][C]42[/C][C]-0.031268[/C][C]-0.3338[/C][C]0.369553[/C][/ROW]
[ROW][C]43[/C][C]0.046489[/C][C]0.4964[/C][C]0.310295[/C][/ROW]
[ROW][C]44[/C][C]0.014012[/C][C]0.1496[/C][C]0.440671[/C][/ROW]
[ROW][C]45[/C][C]0.115841[/C][C]1.2368[/C][C]0.109344[/C][/ROW]
[ROW][C]46[/C][C]-0.048553[/C][C]-0.5184[/C][C]0.30259[/C][/ROW]
[ROW][C]47[/C][C]0.079336[/C][C]0.8471[/C][C]0.199362[/C][/ROW]
[ROW][C]48[/C][C]-0.046517[/C][C]-0.4967[/C][C]0.310192[/C][/ROW]
[/TABLE]
Source: https://freestatistics.org/blog/index.php?pk=301249&T=2

Globally Unique Identifier (entire table): ba.freestatistics.org/blog/index.php?pk=301249&T=2

As an alternative you can also use a QR Code:  

The GUIDs for individual cells are displayed in the table below:

Partial Autocorrelation Function
Time lag kPACF(k)T-STATP-value
10.3188853.40480.000457
2-0.155274-1.65790.050046
3-0.208002-2.22090.014169
4-0.153644-1.64050.051832
50.0963251.02850.152954
6-0.225337-2.40590.008869
7-0.081441-0.86960.193186
8-0.168106-1.79490.037662
9-0.131468-1.40370.081564
10-0.02348-0.25070.401249
110.2569472.74340.003532
120.4602594.91422e-06
13-0.120973-1.29160.099547
140.1342731.43360.077205
15-0.039388-0.42050.337439
160.0293290.31320.377369
170.0469890.50170.30842
18-0.03833-0.40930.341561
19-0.023845-0.25460.399748
20-0.165977-1.77220.03952
21-0.086523-0.92380.178768
22-0.071157-0.75970.224487
230.091290.97470.165883
240.1352881.44450.075673
25-0.001384-0.01480.49412
260.0030110.03210.487206
270.0221420.23640.406767
280.0748010.79870.213077
290.0251340.26840.394453
300.0242840.25930.397941
310.1077241.15020.126238
32-0.068375-0.730.233431
33-0.111248-1.18780.118689
34-0.012043-0.12860.448959
35-0.015219-0.16250.435601
360.0296820.31690.375941
37-0.010229-0.10920.456613
380.141011.50560.067471
39-0.054347-0.58030.281441
40-0.099833-1.06590.144354
41-0.053829-0.57470.283299
42-0.031268-0.33380.369553
430.0464890.49640.310295
440.0140120.14960.440671
450.1158411.23680.109344
46-0.048553-0.51840.30259
470.0793360.84710.199362
48-0.046517-0.49670.310192


Parameters (Session):
par1 = Default ; par2 = 1 ; par3 = 1 ; par4 = 0 ; par5 = 12 ; par6 = White Noise ; par7 = 0.95 ;
Parameters (R input):
par1 = 48 ; par2 = 1 ; par3 = 1 ; par4 = 0 ; par5 = 12 ; par6 = White Noise ; par7 = 0.95 ; par8 = ;
R code (references can be found in the software module):
if (par1 == 'Default') {
par1 = 10*log10(length(x))
} else {
par1 <- as.numeric(par1)
}
par2 <- as.numeric(par2)
par3 <- as.numeric(par3)
par4 <- as.numeric(par4)
par5 <- as.numeric(par5)
if (par6 == 'White Noise') par6 <- 'white' else par6 <- 'ma'
par7 <- as.numeric(par7)
if (par8 != '') par8 <- as.numeric(par8)
x <- na.omit(x)
ox <- x
if (par8 == '') {
if (par2 == 0) {
x <- log(x)
} else {
x <- (x ^ par2 - 1) / par2
}
} else {
x <- log(x,base=par8)
}
if (par3 > 0) x <- diff(x,lag=1,difference=par3)
if (par4 > 0) x <- diff(x,lag=par5,difference=par4)
bitmap(file='picts.png')
op <- par(mfrow=c(2,1))
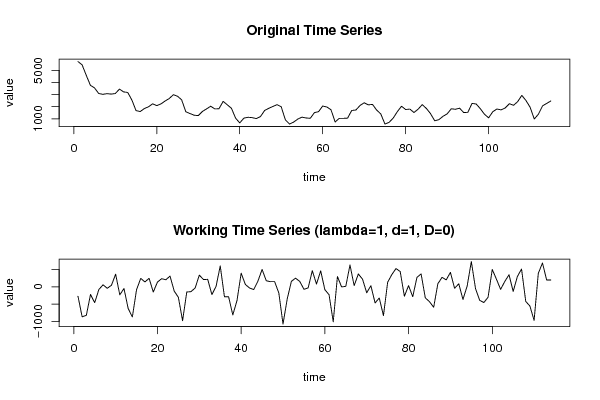
plot(ox,type='l',main='Original Time Series',xlab='time',ylab='value')
if (par8=='') {
mytitle <- paste('Working Time Series (lambda=',par2,', d=',par3,', D=',par4,')',sep='')
mysub <- paste('(lambda=',par2,', d=',par3,', D=',par4,', CI=', par7, ', CI type=',par6,')',sep='')
} else {
mytitle <- paste('Working Time Series (base=',par8,', d=',par3,', D=',par4,')',sep='')
mysub <- paste('(base=',par8,', d=',par3,', D=',par4,', CI=', par7, ', CI type=',par6,')',sep='')
}
plot(x,type='l', main=mytitle,xlab='time',ylab='value')
par(op)
dev.off()
bitmap(file='pic1.png')
racf <- acf(x, par1, main='Autocorrelation', xlab='time lag', ylab='ACF', ci.type=par6, ci=par7, sub=mysub)
dev.off()
bitmap(file='pic2.png')
rpacf <- pacf(x,par1,main='Partial Autocorrelation',xlab='lags',ylab='PACF',sub=mysub)
dev.off()
(myacf <- c(racf$acf))
(mypacf <- c(rpacf$acf))
lengthx <- length(x)
sqrtn <- sqrt(lengthx)
load(file='createtable')
a<-table.start()
a<-table.row.start(a)
a<-table.element(a,'Autocorrelation Function',4,TRUE)
a<-table.row.end(a)
a<-table.row.start(a)
a<-table.element(a,'Time lag k',header=TRUE)
a<-table.element(a,'ACF(k)',header=TRUE)
a<-table.element(a,'T-STAT',header=TRUE)
a<-table.element(a,'P-value',header=TRUE)
a<-table.row.end(a)
for (i in 2:(par1+1)) {
a<-table.row.start(a)
a<-table.element(a,i-1,header=TRUE)
a<-table.element(a,round(myacf[i],6))
mytstat <- myacf[i]*sqrtn
a<-table.element(a,round(mytstat,4))
a<-table.element(a,round(1-pt(abs(mytstat),lengthx),6))
a<-table.row.end(a)
}
a<-table.end(a)
table.save(a,file='mytable.tab')
a<-table.start()
a<-table.row.start(a)
a<-table.element(a,'Partial Autocorrelation Function',4,TRUE)
a<-table.row.end(a)
a<-table.row.start(a)
a<-table.element(a,'Time lag k',header=TRUE)
a<-table.element(a,'PACF(k)',header=TRUE)
a<-table.element(a,'T-STAT',header=TRUE)
a<-table.element(a,'P-value',header=TRUE)
a<-table.row.end(a)
for (i in 1:par1) {
a<-table.row.start(a)
a<-table.element(a,i,header=TRUE)
a<-table.element(a,round(mypacf[i],6))
mytstat <- mypacf[i]*sqrtn
a<-table.element(a,round(mytstat,4))
a<-table.element(a,round(1-pt(abs(mytstat),lengthx),6))
a<-table.row.end(a)
}
a<-table.end(a)
table.save(a,file='mytable1.tab')