Free Statistics

of Irreproducible Research!

Author's title

Author*The author of this computation has been verified*
R Software Modulerwasp_structuraltimeseries.wasp
Title produced by softwareStructural Time Series Models
Date of computationTue, 20 Dec 2016 10:57:26 +0100
Cite this page as followsStatistical Computations at FreeStatistics.org, Office for Research Development and Education, URL https://freestatistics.org/blog/index.php?v=date/2016/Dec/20/t14822278998d78wt81ne06q42.htm/, Retrieved Sat, 27 Apr 2024 17:08:14 +0000
Statistical Computations at FreeStatistics.org, Office for Research Development and Education, URL https://freestatistics.org/blog/index.php?pk=301564, Retrieved Sat, 27 Apr 2024 17:08:14 +0000
QR Codes:

Original text written by user:
IsPrivate?No (this computation is public)
User-defined keywords
Estimated Impact99
Family? (F = Feedback message, R = changed R code, M = changed R Module, P = changed Parameters, D = changed Data)
-       [Structural Time Series Models] [] [2016-12-20 09:57:26] [b2e25925e4919b0d6985405fcb461c0d] [Current]
Feedback Forum

Post a new message
Dataseries X:
4400
4400
5400
7300
7200
7100
7000
10000
10100
9400
8500
8300
9200
10400
11700
12200
10400
10400
9800
9200


Summary of computational transaction
Raw Input view raw input (R code)
Raw Outputview raw output of R engine
Computing time3 seconds
R ServerBig Analytics Cloud Computing Center

\begin{tabular}{lllllllll}
\hline
Summary of computational transaction \tabularnewline
Raw Input view raw input (R code)  \tabularnewline
Raw Outputview raw output of R engine  \tabularnewline
Computing time3 seconds \tabularnewline
R ServerBig Analytics Cloud Computing Center \tabularnewline
\hline
\end{tabular}
%Source: https://freestatistics.org/blog/index.php?pk=301564&T=0

[TABLE]
[ROW]
Summary of computational transaction[/C][/ROW] [ROW]Raw Input[/C] view raw input (R code) [/C][/ROW] [ROW]Raw Output[/C]view raw output of R engine [/C][/ROW] [ROW]Computing time[/C]3 seconds[/C][/ROW] [ROW]R Server[/C]Big Analytics Cloud Computing Center[/C][/ROW] [/TABLE] Source: https://freestatistics.org/blog/index.php?pk=301564&T=0

Globally Unique Identifier (entire table): ba.freestatistics.org/blog/index.php?pk=301564&T=0

As an alternative you can also use a QR Code:  

The GUIDs for individual cells are displayed in the table below:

Summary of computational transaction
Raw Input view raw input (R code)
Raw Outputview raw output of R engine
Computing time3 seconds
R ServerBig Analytics Cloud Computing Center


Structural Time Series Model -- Interpolation
tObservedLevelSlopeSeasonalStand. Residuals
144004400000
244004400000
354005396.015936122223.984063877779183.984063877779330.906822828120423
473007288.4920639841511.507936015850611.50793601585051.71936418266014
572007188.9328067778211.06719322217611.0671932221759-0.101119540804379
671007089.3700791560910.629920843913910.6299208439139-0.100720645630297
770006989.8039219473510.19607805265110.196078052651-0.10032488521032
8100009978.125001331221.874998668802721.87499866880272.71132835893561
91010010077.821013023922.17898697609722.1789869760970.0708488426923599
1094009380.6201561574119.379843842591119.3798438425912-0.654923928405836
1185008484.1698849976215.830115002375515.8301150023755-0.83376613392227
1283008285.0000007577914.999999242205514.9999992422055-0.195733225056137
1392009026.77166613274-15.7480299875551173.2283338672640.799398072239623
141040010382.54545753717.454544991991817.45454246300631.06233520651358
151170011680.217785789619.782214210357219.78221421035721.16430727534313
161220012179.347826045620.652173954410620.65217395441040.435947110233682
171040010382.640144575817.359855424229517.3598554242293-1.65281124500391
181040010382.671480054417.328519945584217.3285199455842-0.0157595237464604
1998009783.7837836776716.216216322334916.2162163223352-0.560420526613525
2092009184.892086208815.107913791197115.1079137911972-0.559411667976525

\begin{tabular}{lllllllll}
\hline
Structural Time Series Model -- Interpolation \tabularnewline
t & Observed & Level & Slope & Seasonal & Stand. Residuals \tabularnewline
1 & 4400 & 4400 & 0 & 0 & 0 \tabularnewline
2 & 4400 & 4400 & 0 & 0 & 0 \tabularnewline
3 & 5400 & 5396.01593612222 & 3.98406387777918 & 3.98406387777933 & 0.906822828120423 \tabularnewline
4 & 7300 & 7288.49206398415 & 11.5079360158506 & 11.5079360158505 & 1.71936418266014 \tabularnewline
5 & 7200 & 7188.93280677782 & 11.067193222176 & 11.0671932221759 & -0.101119540804379 \tabularnewline
6 & 7100 & 7089.37007915609 & 10.6299208439139 & 10.6299208439139 & -0.100720645630297 \tabularnewline
7 & 7000 & 6989.80392194735 & 10.196078052651 & 10.196078052651 & -0.10032488521032 \tabularnewline
8 & 10000 & 9978.1250013312 & 21.8749986688027 & 21.8749986688027 & 2.71132835893561 \tabularnewline
9 & 10100 & 10077.8210130239 & 22.178986976097 & 22.178986976097 & 0.0708488426923599 \tabularnewline
10 & 9400 & 9380.62015615741 & 19.3798438425911 & 19.3798438425912 & -0.654923928405836 \tabularnewline
11 & 8500 & 8484.16988499762 & 15.8301150023755 & 15.8301150023755 & -0.83376613392227 \tabularnewline
12 & 8300 & 8285.00000075779 & 14.9999992422055 & 14.9999992422055 & -0.195733225056137 \tabularnewline
13 & 9200 & 9026.77166613274 & -15.7480299875551 & 173.228333867264 & 0.799398072239623 \tabularnewline
14 & 10400 & 10382.545457537 & 17.4545449919918 & 17.4545424630063 & 1.06233520651358 \tabularnewline
15 & 11700 & 11680.2177857896 & 19.7822142103572 & 19.7822142103572 & 1.16430727534313 \tabularnewline
16 & 12200 & 12179.3478260456 & 20.6521739544106 & 20.6521739544104 & 0.435947110233682 \tabularnewline
17 & 10400 & 10382.6401445758 & 17.3598554242295 & 17.3598554242293 & -1.65281124500391 \tabularnewline
18 & 10400 & 10382.6714800544 & 17.3285199455842 & 17.3285199455842 & -0.0157595237464604 \tabularnewline
19 & 9800 & 9783.78378367767 & 16.2162163223349 & 16.2162163223352 & -0.560420526613525 \tabularnewline
20 & 9200 & 9184.8920862088 & 15.1079137911971 & 15.1079137911972 & -0.559411667976525 \tabularnewline
\hline
\end{tabular}
%Source: https://freestatistics.org/blog/index.php?pk=301564&T=1

[TABLE]
[ROW][C]Structural Time Series Model -- Interpolation[/C][/ROW]
[ROW][C]t[/C][C]Observed[/C][C]Level[/C][C]Slope[/C][C]Seasonal[/C][C]Stand. Residuals[/C][/ROW]
[ROW][C]1[/C][C]4400[/C][C]4400[/C][C]0[/C][C]0[/C][C]0[/C][/ROW]
[ROW][C]2[/C][C]4400[/C][C]4400[/C][C]0[/C][C]0[/C][C]0[/C][/ROW]
[ROW][C]3[/C][C]5400[/C][C]5396.01593612222[/C][C]3.98406387777918[/C][C]3.98406387777933[/C][C]0.906822828120423[/C][/ROW]
[ROW][C]4[/C][C]7300[/C][C]7288.49206398415[/C][C]11.5079360158506[/C][C]11.5079360158505[/C][C]1.71936418266014[/C][/ROW]
[ROW][C]5[/C][C]7200[/C][C]7188.93280677782[/C][C]11.067193222176[/C][C]11.0671932221759[/C][C]-0.101119540804379[/C][/ROW]
[ROW][C]6[/C][C]7100[/C][C]7089.37007915609[/C][C]10.6299208439139[/C][C]10.6299208439139[/C][C]-0.100720645630297[/C][/ROW]
[ROW][C]7[/C][C]7000[/C][C]6989.80392194735[/C][C]10.196078052651[/C][C]10.196078052651[/C][C]-0.10032488521032[/C][/ROW]
[ROW][C]8[/C][C]10000[/C][C]9978.1250013312[/C][C]21.8749986688027[/C][C]21.8749986688027[/C][C]2.71132835893561[/C][/ROW]
[ROW][C]9[/C][C]10100[/C][C]10077.8210130239[/C][C]22.178986976097[/C][C]22.178986976097[/C][C]0.0708488426923599[/C][/ROW]
[ROW][C]10[/C][C]9400[/C][C]9380.62015615741[/C][C]19.3798438425911[/C][C]19.3798438425912[/C][C]-0.654923928405836[/C][/ROW]
[ROW][C]11[/C][C]8500[/C][C]8484.16988499762[/C][C]15.8301150023755[/C][C]15.8301150023755[/C][C]-0.83376613392227[/C][/ROW]
[ROW][C]12[/C][C]8300[/C][C]8285.00000075779[/C][C]14.9999992422055[/C][C]14.9999992422055[/C][C]-0.195733225056137[/C][/ROW]
[ROW][C]13[/C][C]9200[/C][C]9026.77166613274[/C][C]-15.7480299875551[/C][C]173.228333867264[/C][C]0.799398072239623[/C][/ROW]
[ROW][C]14[/C][C]10400[/C][C]10382.545457537[/C][C]17.4545449919918[/C][C]17.4545424630063[/C][C]1.06233520651358[/C][/ROW]
[ROW][C]15[/C][C]11700[/C][C]11680.2177857896[/C][C]19.7822142103572[/C][C]19.7822142103572[/C][C]1.16430727534313[/C][/ROW]
[ROW][C]16[/C][C]12200[/C][C]12179.3478260456[/C][C]20.6521739544106[/C][C]20.6521739544104[/C][C]0.435947110233682[/C][/ROW]
[ROW][C]17[/C][C]10400[/C][C]10382.6401445758[/C][C]17.3598554242295[/C][C]17.3598554242293[/C][C]-1.65281124500391[/C][/ROW]
[ROW][C]18[/C][C]10400[/C][C]10382.6714800544[/C][C]17.3285199455842[/C][C]17.3285199455842[/C][C]-0.0157595237464604[/C][/ROW]
[ROW][C]19[/C][C]9800[/C][C]9783.78378367767[/C][C]16.2162163223349[/C][C]16.2162163223352[/C][C]-0.560420526613525[/C][/ROW]
[ROW][C]20[/C][C]9200[/C][C]9184.8920862088[/C][C]15.1079137911971[/C][C]15.1079137911972[/C][C]-0.559411667976525[/C][/ROW]
[/TABLE]
Source: https://freestatistics.org/blog/index.php?pk=301564&T=1

Globally Unique Identifier (entire table): ba.freestatistics.org/blog/index.php?pk=301564&T=1

As an alternative you can also use a QR Code:  

The GUIDs for individual cells are displayed in the table below:

Structural Time Series Model -- Interpolation
tObservedLevelSlopeSeasonalStand. Residuals
144004400000
244004400000
354005396.015936122223.984063877779183.984063877779330.906822828120423
473007288.4920639841511.507936015850611.50793601585051.71936418266014
572007188.9328067778211.06719322217611.0671932221759-0.101119540804379
671007089.3700791560910.629920843913910.6299208439139-0.100720645630297
770006989.8039219473510.19607805265110.196078052651-0.10032488521032
8100009978.125001331221.874998668802721.87499866880272.71132835893561
91010010077.821013023922.17898697609722.1789869760970.0708488426923599
1094009380.6201561574119.379843842591119.3798438425912-0.654923928405836
1185008484.1698849976215.830115002375515.8301150023755-0.83376613392227
1283008285.0000007577914.999999242205514.9999992422055-0.195733225056137
1392009026.77166613274-15.7480299875551173.2283338672640.799398072239623
141040010382.54545753717.454544991991817.45454246300631.06233520651358
151170011680.217785789619.782214210357219.78221421035721.16430727534313
161220012179.347826045620.652173954410620.65217395441040.435947110233682
171040010382.640144575817.359855424229517.3598554242293-1.65281124500391
181040010382.671480054417.328519945584217.3285199455842-0.0157595237464604
1998009783.7837836776716.216216322334916.2162163223352-0.560420526613525
2092009184.892086208815.107913791197115.1079137911972-0.559411667976525


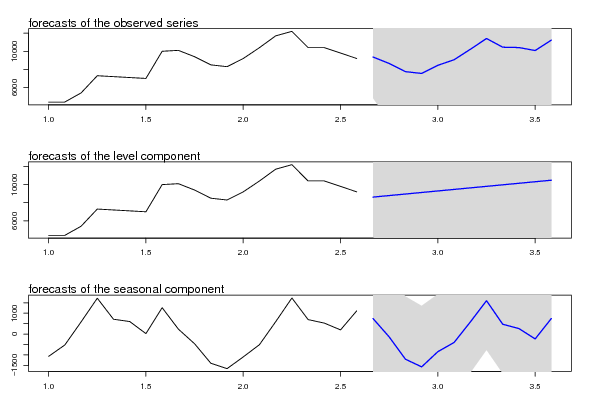
Structural Time Series Model -- Extrapolation
tObservedLevelSeasonal
19368.686945434588620.60800679957748.078938635012
28650.934558685898790.08745443389-139.152895747997
37751.024407988558959.56690206821-1208.54249407965
47551.052154846539129.04634970252-1577.99419485599
58450.998729352329298.52579733684-847.527067984529
69062.389928077579468.00524497116-405.615316893592
710214.76950501979637.48469260548577.284812414239
811410.70423939159806.96414023981603.7400991517
910447.8746980739976.44358787412471.431110198842
1010409.204109773910145.9230355084263.281074265479
1110081.546977204510315.4024831428-233.85550593826
1211233.753371611810484.8819307771748.871440834753

\begin{tabular}{lllllllll}
\hline
Structural Time Series Model -- Extrapolation \tabularnewline
t & Observed & Level & Seasonal \tabularnewline
1 & 9368.68694543458 & 8620.60800679957 & 748.078938635012 \tabularnewline
2 & 8650.93455868589 & 8790.08745443389 & -139.152895747997 \tabularnewline
3 & 7751.02440798855 & 8959.56690206821 & -1208.54249407965 \tabularnewline
4 & 7551.05215484653 & 9129.04634970252 & -1577.99419485599 \tabularnewline
5 & 8450.99872935232 & 9298.52579733684 & -847.527067984529 \tabularnewline
6 & 9062.38992807757 & 9468.00524497116 & -405.615316893592 \tabularnewline
7 & 10214.7695050197 & 9637.48469260548 & 577.284812414239 \tabularnewline
8 & 11410.7042393915 & 9806.9641402398 & 1603.7400991517 \tabularnewline
9 & 10447.874698073 & 9976.44358787412 & 471.431110198842 \tabularnewline
10 & 10409.2041097739 & 10145.9230355084 & 263.281074265479 \tabularnewline
11 & 10081.5469772045 & 10315.4024831428 & -233.85550593826 \tabularnewline
12 & 11233.7533716118 & 10484.8819307771 & 748.871440834753 \tabularnewline
\hline
\end{tabular}
%Source: https://freestatistics.org/blog/index.php?pk=301564&T=2

[TABLE]
[ROW][C]Structural Time Series Model -- Extrapolation[/C][/ROW]
[ROW][C]t[/C][C]Observed[/C][C]Level[/C][C]Seasonal[/C][/ROW]
[ROW][C]1[/C][C]9368.68694543458[/C][C]8620.60800679957[/C][C]748.078938635012[/C][/ROW]
[ROW][C]2[/C][C]8650.93455868589[/C][C]8790.08745443389[/C][C]-139.152895747997[/C][/ROW]
[ROW][C]3[/C][C]7751.02440798855[/C][C]8959.56690206821[/C][C]-1208.54249407965[/C][/ROW]
[ROW][C]4[/C][C]7551.05215484653[/C][C]9129.04634970252[/C][C]-1577.99419485599[/C][/ROW]
[ROW][C]5[/C][C]8450.99872935232[/C][C]9298.52579733684[/C][C]-847.527067984529[/C][/ROW]
[ROW][C]6[/C][C]9062.38992807757[/C][C]9468.00524497116[/C][C]-405.615316893592[/C][/ROW]
[ROW][C]7[/C][C]10214.7695050197[/C][C]9637.48469260548[/C][C]577.284812414239[/C][/ROW]
[ROW][C]8[/C][C]11410.7042393915[/C][C]9806.9641402398[/C][C]1603.7400991517[/C][/ROW]
[ROW][C]9[/C][C]10447.874698073[/C][C]9976.44358787412[/C][C]471.431110198842[/C][/ROW]
[ROW][C]10[/C][C]10409.2041097739[/C][C]10145.9230355084[/C][C]263.281074265479[/C][/ROW]
[ROW][C]11[/C][C]10081.5469772045[/C][C]10315.4024831428[/C][C]-233.85550593826[/C][/ROW]
[ROW][C]12[/C][C]11233.7533716118[/C][C]10484.8819307771[/C][C]748.871440834753[/C][/ROW]
[/TABLE]
Source: https://freestatistics.org/blog/index.php?pk=301564&T=2

Globally Unique Identifier (entire table): ba.freestatistics.org/blog/index.php?pk=301564&T=2

As an alternative you can also use a QR Code:  

The GUIDs for individual cells are displayed in the table below:

Structural Time Series Model -- Extrapolation
tObservedLevelSeasonal
19368.686945434588620.60800679957748.078938635012
28650.934558685898790.08745443389-139.152895747997
37751.024407988558959.56690206821-1208.54249407965
47551.052154846539129.04634970252-1577.99419485599
58450.998729352329298.52579733684-847.527067984529
69062.389928077579468.00524497116-405.615316893592
710214.76950501979637.48469260548577.284812414239
811410.70423939159806.96414023981603.7400991517
910447.8746980739976.44358787412471.431110198842
1010409.204109773910145.9230355084263.281074265479
1110081.546977204510315.4024831428-233.85550593826
1211233.753371611810484.8819307771748.871440834753


Parameters (Session):
par1 = 60 ; par2 = 1 ; par3 = 1 ; par4 = 1 ; par5 = 12 ; par6 = White Noise ; par7 = 0.95 ;
Parameters (R input):
par1 = 12 ; par2 = 12 ; par3 = BFGS ;
R code (references can be found in the software module):
par3 <- 'BFGS'
par2 <- '12'
par1 <- '9'
require('stsm')
require('stsm.class')
require('KFKSDS')
par1 <- as.numeric(par1)
par2 <- as.numeric(par2)
nx <- length(x)
x <- ts(x,frequency=par1)
m <- StructTS(x,type='BSM')
print(m$coef)
print(m$fitted)
print(m$resid)
mylevel <- as.numeric(m$fitted[,'level'])
myslope <- as.numeric(m$fitted[,'slope'])
myseas <- as.numeric(m$fitted[,'sea'])
myresid <- as.numeric(m$resid)
myfit <- mylevel+myseas
mm <- stsm.model(model = 'BSM', y = x, transPars = 'StructTS')
fit2 <- stsmFit(mm, stsm.method = 'maxlik.td.optim', method = par3, KF.args = list(P0cov = TRUE))
(fit2.comps <- tsSmooth(fit2, P0cov = FALSE)$states)
m2 <- set.pars(mm, pmax(fit2$par, .Machine$double.eps))
(ss <- char2numeric(m2))
(pred <- predict(ss, x, n.ahead = par2))
mylagmax <- nx/2
bitmap(file='test2.png')
op <- par(mfrow = c(2,2))
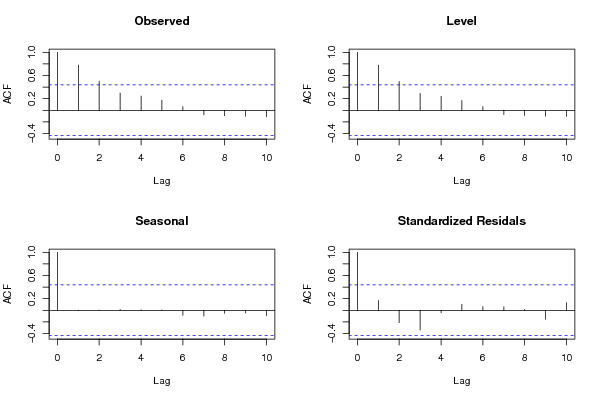
acf(as.numeric(x),lag.max = mylagmax,main='Observed')
acf(mylevel,na.action=na.pass,lag.max = mylagmax,main='Level')
acf(myseas,na.action=na.pass,lag.max = mylagmax,main='Seasonal')
acf(myresid,na.action=na.pass,lag.max = mylagmax,main='Standardized Residals')
par(op)
dev.off()
bitmap(file='test3.png')
op <- par(mfrow = c(2,2))
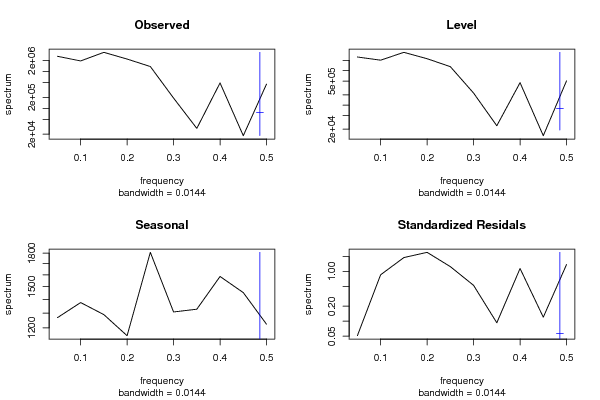
spectrum(as.numeric(x),main='Observed')
spectrum(mylevel,main='Level')
spectrum(myseas,main='Seasonal')
spectrum(myresid,main='Standardized Residals')
par(op)
dev.off()
bitmap(file='test4.png')
op <- par(mfrow = c(2,2))
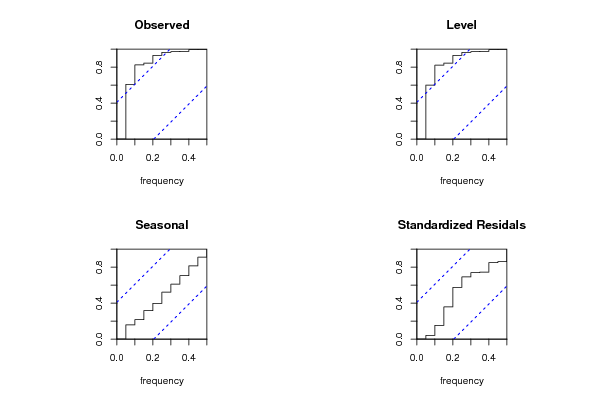
cpgram(as.numeric(x),main='Observed')
cpgram(mylevel,main='Level')
cpgram(myseas,main='Seasonal')
cpgram(myresid,main='Standardized Residals')
par(op)
dev.off()
bitmap(file='test1.png')
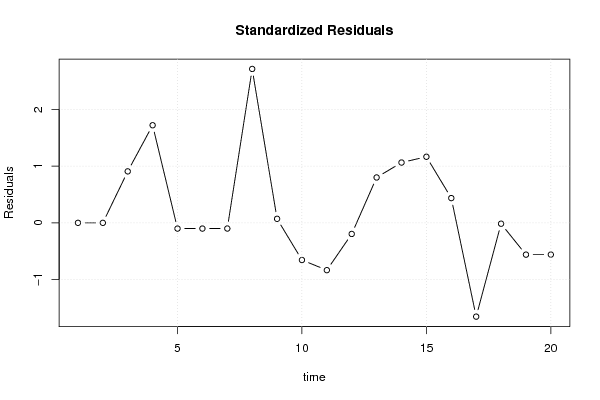
plot(as.numeric(m$resid),main='Standardized Residuals',ylab='Residuals',xlab='time',type='b')
grid()
dev.off()
bitmap(file='test5.png')
op <- par(mfrow = c(2,2))
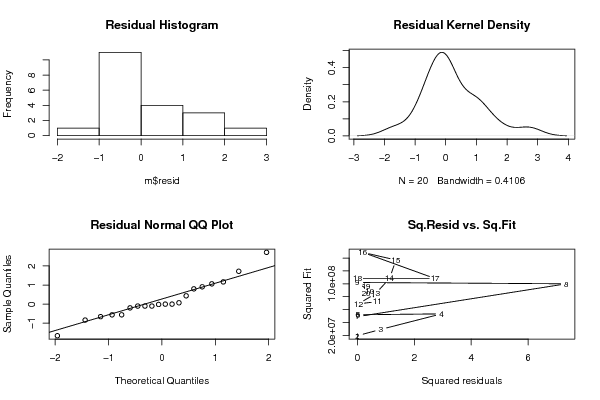
hist(m$resid,main='Residual Histogram')
plot(density(m$resid),main='Residual Kernel Density')
qqnorm(m$resid,main='Residual Normal QQ Plot')
qqline(m$resid)
plot(m$resid^2, myfit^2,main='Sq.Resid vs. Sq.Fit',xlab='Squared residuals',ylab='Squared Fit')
par(op)
dev.off()
bitmap(file='test6.png')
par(mfrow = c(3,1), mar = c(3,3,3,3))
plot(cbind(x, pred$pred), type = 'n', plot.type = 'single', ylab = '')
lines(x)
polygon(c(time(pred$pred), rev(time(pred$pred))), c(pred$pred + 2 * pred$se, rev(pred$pred)), col = 'gray85', border = NA)
polygon(c(time(pred$pred), rev(time(pred$pred))), c(pred$pred - 2 * pred$se, rev(pred$pred)), col = ' gray85', border = NA)
lines(pred$pred, col = 'blue', lwd = 1.5)
mtext(text = 'forecasts of the observed series', side = 3, adj = 0)
plot(cbind(x, pred$a[,1]), type = 'n', plot.type = 'single', ylab = '')
lines(x)
polygon(c(time(pred$a[,1]), rev(time(pred$a[,1]))), c(pred$a[,1] + 2 * sqrt(pred$P[,1]), rev(pred$a[,1])), col = 'gray85', border = NA)
polygon(c(time(pred$a[,1]), rev(time(pred$a[,1]))), c(pred$a[,1] - 2 * sqrt(pred$P[,1]), rev(pred$a[,1])), col = ' gray85', border = NA)
lines(pred$a[,1], col = 'blue', lwd = 1.5)
mtext(text = 'forecasts of the level component', side = 3, adj = 0)
plot(cbind(fit2.comps[,3], pred$a[,3]), type = 'n', plot.type = 'single', ylab = '')
lines(fit2.comps[,3])
polygon(c(time(pred$a[,3]), rev(time(pred$a[,3]))), c(pred$a[,3] + 2 * sqrt(pred$P[,3]), rev(pred$a[,3])), col = 'gray85', border = NA)
polygon(c(time(pred$a[,3]), rev(time(pred$a[,3]))), c(pred$a[,3] - 2 * sqrt(pred$P[,3]), rev(pred$a[,3])), col = ' gray85', border = NA)
lines(pred$a[,3], col = 'blue', lwd = 1.5)
mtext(text = 'forecasts of the seasonal component', side = 3, adj = 0)
dev.off()
load(file='createtable')
a<-table.start()
a<-table.row.start(a)
a<-table.element(a,'Structural Time Series Model -- Interpolation',6,TRUE)
a<-table.row.end(a)
a<-table.row.start(a)
a<-table.element(a,'t',header=TRUE)
a<-table.element(a,'Observed',header=TRUE)
a<-table.element(a,'Level',header=TRUE)
a<-table.element(a,'Slope',header=TRUE)
a<-table.element(a,'Seasonal',header=TRUE)
a<-table.element(a,'Stand. Residuals',header=TRUE)
a<-table.row.end(a)
for (i in 1:nx) {
a<-table.row.start(a)
a<-table.element(a,i,header=TRUE)
a<-table.element(a,x[i])
a<-table.element(a,mylevel[i])
a<-table.element(a,myslope[i])
a<-table.element(a,myseas[i])
a<-table.element(a,myresid[i])
a<-table.row.end(a)
}
a<-table.end(a)
table.save(a,file='mytable.tab')
a<-table.start()
a<-table.row.start(a)
a<-table.element(a,'Structural Time Series Model -- Extrapolation',4,TRUE)
a<-table.row.end(a)
a<-table.row.start(a)
a<-table.element(a,'t',header=TRUE)
a<-table.element(a,'Observed',header=TRUE)
a<-table.element(a,'Level',header=TRUE)
a<-table.element(a,'Seasonal',header=TRUE)
a<-table.row.end(a)
for (i in 1:par2) {
a<-table.row.start(a)
a<-table.element(a,i,header=TRUE)
a<-table.element(a,pred$pred[i])
a<-table.element(a,pred$a[i,1])
a<-table.element(a,pred$a[i,3])
a<-table.row.end(a)
}
a<-table.end(a)
table.save(a,file='mytable1.tab')