Free Statistics

of Irreproducible Research!

Author's title

Author*The author of this computation has been verified*
R Software Modulerwasp_smp.wasp
Title produced by softwareStandard Deviation-Mean Plot
Date of computationTue, 20 Dec 2016 11:30:19 +0100
Cite this page as followsStatistical Computations at FreeStatistics.org, Office for Research Development and Education, URL https://freestatistics.org/blog/index.php?v=date/2016/Dec/20/t1482230026w3ccd62ixt9j1zn.htm/, Retrieved Sun, 28 Apr 2024 10:58:39 +0000
Statistical Computations at FreeStatistics.org, Office for Research Development and Education, URL https://freestatistics.org/blog/index.php?pk=301584, Retrieved Sun, 28 Apr 2024 10:58:39 +0000
QR Codes:

Original text written by user:
IsPrivate?No (this computation is public)
User-defined keywords
Estimated Impact116
Family? (F = Feedback message, R = changed R code, M = changed R Module, P = changed Parameters, D = changed Data)
-       [Standard Deviation-Mean Plot] [Standard Deviatio...] [2016-12-20 10:30:19] [86c9a777e8dbb7ef3face68c75fc8376] [Current]
Feedback Forum

Post a new message
Dataseries X:
150
114
258
282
882
1302
2736
2484
1800
3468
5526
5766
6162
6132
6240
5904
5922
8460
7896
7290
6552
8442
9570
9312
6588
6084
11298
9798
14400
13734
13482
14814
13548
15516
15480
10488
14262
14946
14166
11544
10194
11850
12702
18222
19560
19494
15282
11034
8772
7110
6312
7080
7080
8226
7614
7326
7422
8886
7698
8634
5460
9744
12330
12870
9264
9822
21126
13050
13938
10764
8886
10830
7308
18336
17484
20082
16308
18600
19794
24114
24708
22482
21288
15870
10734
11142
13080
13098
18282
15678
6096
7854
9342
9162
7092
4692
4764
3852
9456
5490
6528
9306
9018
5964
5856
20574
7704
4464
9258
6240
9354
11916
13026
10062
7638
8844
13476
19074
16896
21162
16014
13746
14550
13146
11022
10386


Summary of computational transaction
Raw Input view raw input (R code)
Raw Outputview raw output of R engine
Computing time1 seconds
R ServerBig Analytics Cloud Computing Center

\begin{tabular}{lllllllll}
\hline
Summary of computational transaction \tabularnewline
Raw Input view raw input (R code)  \tabularnewline
Raw Outputview raw output of R engine  \tabularnewline
Computing time1 seconds \tabularnewline
R ServerBig Analytics Cloud Computing Center \tabularnewline
\hline
\end{tabular}
%Source: https://freestatistics.org/blog/index.php?pk=301584&T=0

[TABLE]
[ROW]
Summary of computational transaction[/C][/ROW] [ROW]Raw Input[/C] view raw input (R code) [/C][/ROW] [ROW]Raw Output[/C]view raw output of R engine [/C][/ROW] [ROW]Computing time[/C]1 seconds[/C][/ROW] [ROW]R Server[/C]Big Analytics Cloud Computing Center[/C][/ROW] [/TABLE] Source: https://freestatistics.org/blog/index.php?pk=301584&T=0

Globally Unique Identifier (entire table): ba.freestatistics.org/blog/index.php?pk=301584&T=0

As an alternative you can also use a QR Code:  

The GUIDs for individual cells are displayed in the table below:

Summary of computational transaction
Raw Input view raw input (R code)
Raw Outputview raw output of R engine
Computing time1 seconds
R ServerBig Analytics Cloud Computing Center


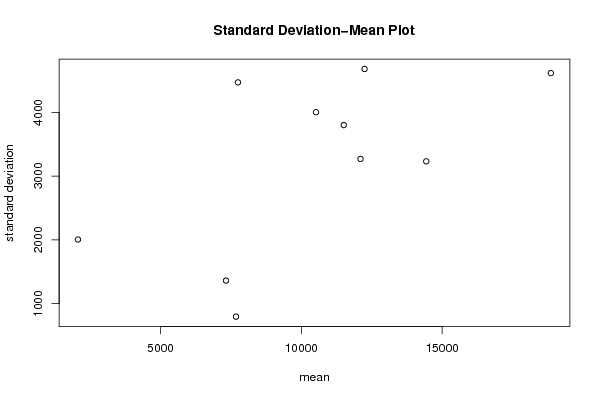
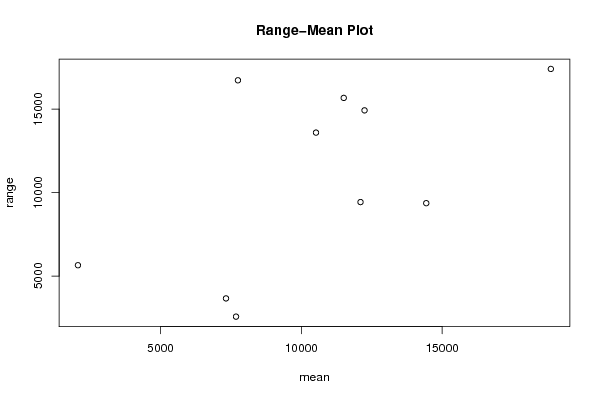
Standard Deviation-Mean Plot
SectionMeanStandard DeviationRange
120642005.446402357165652
27323.51361.468759031283666
312102.53268.876829627079432
4144383231.625878436719366
57680795.8994911419412574
6115073799.2288691259415666
718864.54615.3907054155617400
8105214001.2941997217913590
977484468.9103003671116722
1012245.54679.8436745453214922

\begin{tabular}{lllllllll}
\hline
Standard Deviation-Mean Plot \tabularnewline
Section & Mean & Standard Deviation & Range \tabularnewline
1 & 2064 & 2005.44640235716 & 5652 \tabularnewline
2 & 7323.5 & 1361.46875903128 & 3666 \tabularnewline
3 & 12102.5 & 3268.87682962707 & 9432 \tabularnewline
4 & 14438 & 3231.62587843671 & 9366 \tabularnewline
5 & 7680 & 795.899491141941 & 2574 \tabularnewline
6 & 11507 & 3799.22886912594 & 15666 \tabularnewline
7 & 18864.5 & 4615.39070541556 & 17400 \tabularnewline
8 & 10521 & 4001.29419972179 & 13590 \tabularnewline
9 & 7748 & 4468.91030036711 & 16722 \tabularnewline
10 & 12245.5 & 4679.84367454532 & 14922 \tabularnewline
\hline
\end{tabular}
%Source: https://freestatistics.org/blog/index.php?pk=301584&T=1

[TABLE]
[ROW][C]Standard Deviation-Mean Plot[/C][/ROW]
[ROW][C]Section[/C][C]Mean[/C][C]Standard Deviation[/C][C]Range[/C][/ROW]
[ROW][C]1[/C][C]2064[/C][C]2005.44640235716[/C][C]5652[/C][/ROW]
[ROW][C]2[/C][C]7323.5[/C][C]1361.46875903128[/C][C]3666[/C][/ROW]
[ROW][C]3[/C][C]12102.5[/C][C]3268.87682962707[/C][C]9432[/C][/ROW]
[ROW][C]4[/C][C]14438[/C][C]3231.62587843671[/C][C]9366[/C][/ROW]
[ROW][C]5[/C][C]7680[/C][C]795.899491141941[/C][C]2574[/C][/ROW]
[ROW][C]6[/C][C]11507[/C][C]3799.22886912594[/C][C]15666[/C][/ROW]
[ROW][C]7[/C][C]18864.5[/C][C]4615.39070541556[/C][C]17400[/C][/ROW]
[ROW][C]8[/C][C]10521[/C][C]4001.29419972179[/C][C]13590[/C][/ROW]
[ROW][C]9[/C][C]7748[/C][C]4468.91030036711[/C][C]16722[/C][/ROW]
[ROW][C]10[/C][C]12245.5[/C][C]4679.84367454532[/C][C]14922[/C][/ROW]
[/TABLE]
Source: https://freestatistics.org/blog/index.php?pk=301584&T=1

Globally Unique Identifier (entire table): ba.freestatistics.org/blog/index.php?pk=301584&T=1

As an alternative you can also use a QR Code:  

The GUIDs for individual cells are displayed in the table below:

Standard Deviation-Mean Plot
SectionMeanStandard DeviationRange
120642005.446402357165652
27323.51361.468759031283666
312102.53268.876829627079432
4144383231.625878436719366
57680795.8994911419412574
6115073799.2288691259415666
718864.54615.3907054155617400
8105214001.2941997217913590
977484468.9103003671116722
1012245.54679.8436745453214922


Regression: S.E.(k) = alpha + beta * Mean(k)
alpha1314.28921263077
beta0.182642955418131
S.D.0.0856821072535963
T-STAT2.13163472832847
p-value0.0656257215701723

\begin{tabular}{lllllllll}
\hline
Regression: S.E.(k) = alpha + beta * Mean(k) \tabularnewline
alpha & 1314.28921263077 \tabularnewline
beta & 0.182642955418131 \tabularnewline
S.D. & 0.0856821072535963 \tabularnewline
T-STAT & 2.13163472832847 \tabularnewline
p-value & 0.0656257215701723 \tabularnewline
\hline
\end{tabular}
%Source: https://freestatistics.org/blog/index.php?pk=301584&T=2

[TABLE]
[ROW][C]Regression: S.E.(k) = alpha + beta * Mean(k)[/C][/ROW]
[ROW][C]alpha[/C][C]1314.28921263077[/C][/ROW]
[ROW][C]beta[/C][C]0.182642955418131[/C][/ROW]
[ROW][C]S.D.[/C][C]0.0856821072535963[/C][/ROW]
[ROW][C]T-STAT[/C][C]2.13163472832847[/C][/ROW]
[ROW][C]p-value[/C][C]0.0656257215701723[/C][/ROW]
[/TABLE]
Source: https://freestatistics.org/blog/index.php?pk=301584&T=2

Globally Unique Identifier (entire table): ba.freestatistics.org/blog/index.php?pk=301584&T=2

As an alternative you can also use a QR Code:  

The GUIDs for individual cells are displayed in the table below:

Regression: S.E.(k) = alpha + beta * Mean(k)
alpha1314.28921263077
beta0.182642955418131
S.D.0.0856821072535963
T-STAT2.13163472832847
p-value0.0656257215701723


Regression: ln S.E.(k) = alpha + beta * ln Mean(k)
alpha3.68233551763869
beta0.467554245785758
S.D.0.307486055324651
T-STAT1.52057056796316
p-value0.16685797510127
Lambda0.532445754214242

\begin{tabular}{lllllllll}
\hline
Regression: ln S.E.(k) = alpha + beta * ln Mean(k) \tabularnewline
alpha & 3.68233551763869 \tabularnewline
beta & 0.467554245785758 \tabularnewline
S.D. & 0.307486055324651 \tabularnewline
T-STAT & 1.52057056796316 \tabularnewline
p-value & 0.16685797510127 \tabularnewline
Lambda & 0.532445754214242 \tabularnewline
\hline
\end{tabular}
%Source: https://freestatistics.org/blog/index.php?pk=301584&T=3

[TABLE]
[ROW][C]Regression: ln S.E.(k) = alpha + beta * ln Mean(k)[/C][/ROW]
[ROW][C]alpha[/C][C]3.68233551763869[/C][/ROW]
[ROW][C]beta[/C][C]0.467554245785758[/C][/ROW]
[ROW][C]S.D.[/C][C]0.307486055324651[/C][/ROW]
[ROW][C]T-STAT[/C][C]1.52057056796316[/C][/ROW]
[ROW][C]p-value[/C][C]0.16685797510127[/C][/ROW]
[ROW][C]Lambda[/C][C]0.532445754214242[/C][/ROW]
[/TABLE]
Source: https://freestatistics.org/blog/index.php?pk=301584&T=3

Globally Unique Identifier (entire table): ba.freestatistics.org/blog/index.php?pk=301584&T=3

As an alternative you can also use a QR Code:  

The GUIDs for individual cells are displayed in the table below:

Regression: ln S.E.(k) = alpha + beta * ln Mean(k)
alpha3.68233551763869
beta0.467554245785758
S.D.0.307486055324651
T-STAT1.52057056796316
p-value0.16685797510127
Lambda0.532445754214242


Parameters (Session):
par1 = 12 ;
Parameters (R input):
par1 = 12 ;
R code (references can be found in the software module):
par1 <- as.numeric(par1)
(n <- length(x))
(np <- floor(n / par1))
arr <- array(NA,dim=c(par1,np))
j <- 0
k <- 1
for (i in 1:(np*par1))
{
j = j + 1
arr[j,k] <- x[i]
if (j == par1) {
j = 0
k=k+1
}
}
arr
arr.mean <- array(NA,dim=np)
arr.sd <- array(NA,dim=np)
arr.range <- array(NA,dim=np)
for (j in 1:np)
{
arr.mean[j] <- mean(arr[,j],na.rm=TRUE)
arr.sd[j] <- sd(arr[,j],na.rm=TRUE)
arr.range[j] <- max(arr[,j],na.rm=TRUE) - min(arr[,j],na.rm=TRUE)
}
arr.mean
arr.sd
arr.range
(lm1 <- lm(arr.sd~arr.mean))
(lnlm1 <- lm(log(arr.sd)~log(arr.mean)))
(lm2 <- lm(arr.range~arr.mean))
bitmap(file='test1.png')
plot(arr.mean,arr.sd,main='Standard Deviation-Mean Plot',xlab='mean',ylab='standard deviation')
dev.off()
bitmap(file='test2.png')
plot(arr.mean,arr.range,main='Range-Mean Plot',xlab='mean',ylab='range')
dev.off()
load(file='createtable')
a<-table.start()
a<-table.row.start(a)
a<-table.element(a,'Standard Deviation-Mean Plot',4,TRUE)
a<-table.row.end(a)
a<-table.row.start(a)
a<-table.element(a,'Section',header=TRUE)
a<-table.element(a,'Mean',header=TRUE)
a<-table.element(a,'Standard Deviation',header=TRUE)
a<-table.element(a,'Range',header=TRUE)
a<-table.row.end(a)
for (j in 1:np) {
a<-table.row.start(a)
a<-table.element(a,j,header=TRUE)
a<-table.element(a,arr.mean[j])
a<-table.element(a,arr.sd[j] )
a<-table.element(a,arr.range[j] )
a<-table.row.end(a)
}
a<-table.end(a)
table.save(a,file='mytable.tab')
a<-table.start()
a<-table.row.start(a)
a<-table.element(a,'Regression: S.E.(k) = alpha + beta * Mean(k)',2,TRUE)
a<-table.row.end(a)
a<-table.row.start(a)
a<-table.element(a,'alpha',header=TRUE)
a<-table.element(a,lm1$coefficients[[1]])
a<-table.row.end(a)
a<-table.row.start(a)
a<-table.element(a,'beta',header=TRUE)
a<-table.element(a,lm1$coefficients[[2]])
a<-table.row.end(a)
a<-table.row.start(a)
a<-table.element(a,'S.D.',header=TRUE)
a<-table.element(a,summary(lm1)$coefficients[2,2])
a<-table.row.end(a)
a<-table.row.start(a)
a<-table.element(a,'T-STAT',header=TRUE)
a<-table.element(a,summary(lm1)$coefficients[2,3])
a<-table.row.end(a)
a<-table.row.start(a)
a<-table.element(a,'p-value',header=TRUE)
a<-table.element(a,summary(lm1)$coefficients[2,4])
a<-table.row.end(a)
a<-table.end(a)
table.save(a,file='mytable1.tab')
a<-table.start()
a<-table.row.start(a)
a<-table.element(a,'Regression: ln S.E.(k) = alpha + beta * ln Mean(k)',2,TRUE)
a<-table.row.end(a)
a<-table.row.start(a)
a<-table.element(a,'alpha',header=TRUE)
a<-table.element(a,lnlm1$coefficients[[1]])
a<-table.row.end(a)
a<-table.row.start(a)
a<-table.element(a,'beta',header=TRUE)
a<-table.element(a,lnlm1$coefficients[[2]])
a<-table.row.end(a)
a<-table.row.start(a)
a<-table.element(a,'S.D.',header=TRUE)
a<-table.element(a,summary(lnlm1)$coefficients[2,2])
a<-table.row.end(a)
a<-table.row.start(a)
a<-table.element(a,'T-STAT',header=TRUE)
a<-table.element(a,summary(lnlm1)$coefficients[2,3])
a<-table.row.end(a)
a<-table.row.start(a)
a<-table.element(a,'p-value',header=TRUE)
a<-table.element(a,summary(lnlm1)$coefficients[2,4])
a<-table.row.end(a)
a<-table.row.start(a)
a<-table.element(a,'Lambda',header=TRUE)
a<-table.element(a,1-lnlm1$coefficients[[2]])
a<-table.row.end(a)
a<-table.end(a)
table.save(a,file='mytable2.tab')