Free Statistics

of Irreproducible Research!

Author's title

Author*The author of this computation has been verified*
R Software Modulerwasp_autocorrelation.wasp
Title produced by software(Partial) Autocorrelation Function
Date of computationTue, 20 Dec 2016 11:37:05 +0100
Cite this page as followsStatistical Computations at FreeStatistics.org, Office for Research Development and Education, URL https://freestatistics.org/blog/index.php?v=date/2016/Dec/20/t1482230336twv37l2ic02wxjm.htm/, Retrieved Sun, 28 Apr 2024 17:26:32 +0000
Statistical Computations at FreeStatistics.org, Office for Research Development and Education, URL https://freestatistics.org/blog/index.php?pk=301587, Retrieved Sun, 28 Apr 2024 17:26:32 +0000
QR Codes:

Original text written by user:
IsPrivate?No (this computation is public)
User-defined keywords
Estimated Impact105
Family? (F = Feedback message, R = changed R code, M = changed R Module, P = changed Parameters, D = changed Data)
-       [(Partial) Autocorrelation Function] [autocorrelation ] [2016-12-20 10:37:05] [e8b5e2ae4a4517822f644e6c122e1af0] [Current]
Feedback Forum

Post a new message
Dataseries X:
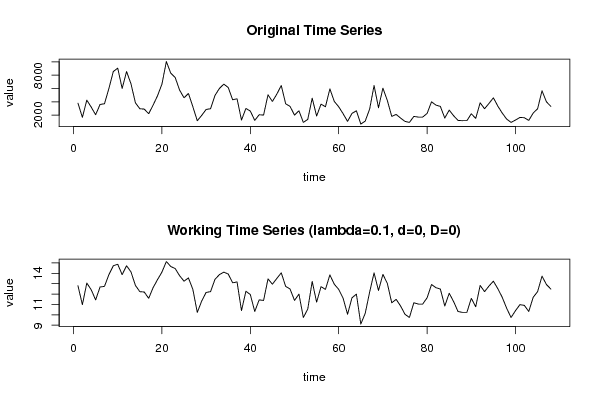
3800
1650
4250
3200
2050
3600
3700
6000
8550
9050
6000
8550
6700
3850
2950
2900
2200
3500
4900
6650
10050
8300
7650
5750
4600
5250
3250
1150
1950
2850
2950
4950
6000
6650
6150
4300
4450
1250
3000
2600
1200
2050
2000
5050
4050
5150
6450
3700
3300
2000
2650
900
1350
4550
1850
3650
3250
5950
4050
3250
2200
1050
2250
2650
650
1100
2900
6450
3100
6050
4200
1800
2100
1550
1050
900
1800
1700
1700
2250
4000
3500
3300
1550
2750
1900
1200
1150
1150
2200
1500
3850
2950
3750
4600
3350
2300
1400
900
1250
1650
1600
1200
2300
2950
5650
4000
3300


Summary of computational transaction
Raw Input view raw input (R code)
Raw Outputview raw output of R engine
Computing time2 seconds
R ServerBig Analytics Cloud Computing Center

\begin{tabular}{lllllllll}
\hline
Summary of computational transaction \tabularnewline
Raw Input view raw input (R code)  \tabularnewline
Raw Outputview raw output of R engine  \tabularnewline
Computing time2 seconds \tabularnewline
R ServerBig Analytics Cloud Computing Center \tabularnewline
\hline
\end{tabular}
%Source: https://freestatistics.org/blog/index.php?pk=301587&T=0

[TABLE]
[ROW]
Summary of computational transaction[/C][/ROW] [ROW]Raw Input[/C] view raw input (R code) [/C][/ROW] [ROW]Raw Output[/C]view raw output of R engine [/C][/ROW] [ROW]Computing time[/C]2 seconds[/C][/ROW] [ROW]R Server[/C]Big Analytics Cloud Computing Center[/C][/ROW] [/TABLE] Source: https://freestatistics.org/blog/index.php?pk=301587&T=0

Globally Unique Identifier (entire table): ba.freestatistics.org/blog/index.php?pk=301587&T=0

As an alternative you can also use a QR Code:  

The GUIDs for individual cells are displayed in the table below:

Summary of computational transaction
Raw Input view raw input (R code)
Raw Outputview raw output of R engine
Computing time2 seconds
R ServerBig Analytics Cloud Computing Center


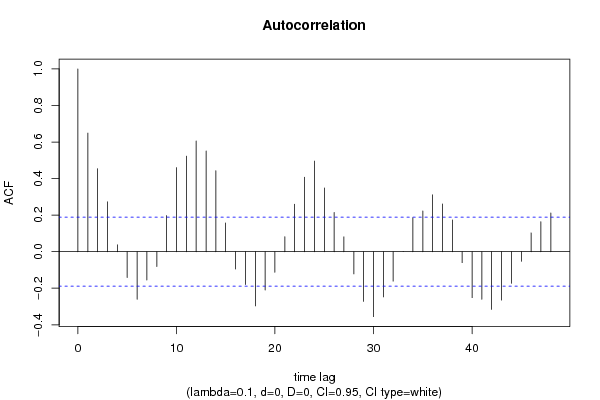
Autocorrelation Function
Time lag kACF(k)T-STATP-value
10.6489546.74410
20.4543014.72124e-06
30.2725982.83290.002752
40.037160.38620.350063
5-0.141565-1.47120.072074
6-0.260466-2.70680.003949
7-0.154923-1.610.055157
8-0.081268-0.84460.200112
90.1975682.05320.021235
100.4602254.78283e-06
110.5227985.43310
120.6059676.29740
130.5508465.72460
140.4430684.60456e-06
150.1571551.63320.052669
16-0.095116-0.98850.162564
17-0.179676-1.86720.03229
18-0.296532-3.08160.001306
19-0.209347-2.17560.015883
20-0.112792-1.17220.121855
210.0816880.84890.198901
220.2592372.69410.004093
230.4069934.22962.5e-05
240.4955255.14961e-06
250.3485983.62270.000223
260.2141932.2260.014047
270.0812080.84390.200286
28-0.121582-1.26350.104562
29-0.272129-2.8280.002792
30-0.355574-3.69520.000173
31-0.247486-2.5720.005736
32-0.161232-1.67560.048357
33-0.000654-0.00680.497295
340.1858291.93120.02804
350.2222262.30940.011411
360.310843.23030.000819
370.2614232.71680.00384
380.1736521.80460.036959
39-0.059952-0.6230.267286
40-0.251393-2.61260.005133
41-0.260483-2.7070.003947
42-0.31596-3.28360.000691
43-0.264979-2.75370.003457
44-0.173155-1.79950.037368
45-0.052657-0.54720.292676
460.102791.06820.143901
470.1642671.70710.045337
480.2120462.20360.014836

\begin{tabular}{lllllllll}
\hline
Autocorrelation Function \tabularnewline
Time lag k & ACF(k) & T-STAT & P-value \tabularnewline
1 & 0.648954 & 6.7441 & 0 \tabularnewline
2 & 0.454301 & 4.7212 & 4e-06 \tabularnewline
3 & 0.272598 & 2.8329 & 0.002752 \tabularnewline
4 & 0.03716 & 0.3862 & 0.350063 \tabularnewline
5 & -0.141565 & -1.4712 & 0.072074 \tabularnewline
6 & -0.260466 & -2.7068 & 0.003949 \tabularnewline
7 & -0.154923 & -1.61 & 0.055157 \tabularnewline
8 & -0.081268 & -0.8446 & 0.200112 \tabularnewline
9 & 0.197568 & 2.0532 & 0.021235 \tabularnewline
10 & 0.460225 & 4.7828 & 3e-06 \tabularnewline
11 & 0.522798 & 5.4331 & 0 \tabularnewline
12 & 0.605967 & 6.2974 & 0 \tabularnewline
13 & 0.550846 & 5.7246 & 0 \tabularnewline
14 & 0.443068 & 4.6045 & 6e-06 \tabularnewline
15 & 0.157155 & 1.6332 & 0.052669 \tabularnewline
16 & -0.095116 & -0.9885 & 0.162564 \tabularnewline
17 & -0.179676 & -1.8672 & 0.03229 \tabularnewline
18 & -0.296532 & -3.0816 & 0.001306 \tabularnewline
19 & -0.209347 & -2.1756 & 0.015883 \tabularnewline
20 & -0.112792 & -1.1722 & 0.121855 \tabularnewline
21 & 0.081688 & 0.8489 & 0.198901 \tabularnewline
22 & 0.259237 & 2.6941 & 0.004093 \tabularnewline
23 & 0.406993 & 4.2296 & 2.5e-05 \tabularnewline
24 & 0.495525 & 5.1496 & 1e-06 \tabularnewline
25 & 0.348598 & 3.6227 & 0.000223 \tabularnewline
26 & 0.214193 & 2.226 & 0.014047 \tabularnewline
27 & 0.081208 & 0.8439 & 0.200286 \tabularnewline
28 & -0.121582 & -1.2635 & 0.104562 \tabularnewline
29 & -0.272129 & -2.828 & 0.002792 \tabularnewline
30 & -0.355574 & -3.6952 & 0.000173 \tabularnewline
31 & -0.247486 & -2.572 & 0.005736 \tabularnewline
32 & -0.161232 & -1.6756 & 0.048357 \tabularnewline
33 & -0.000654 & -0.0068 & 0.497295 \tabularnewline
34 & 0.185829 & 1.9312 & 0.02804 \tabularnewline
35 & 0.222226 & 2.3094 & 0.011411 \tabularnewline
36 & 0.31084 & 3.2303 & 0.000819 \tabularnewline
37 & 0.261423 & 2.7168 & 0.00384 \tabularnewline
38 & 0.173652 & 1.8046 & 0.036959 \tabularnewline
39 & -0.059952 & -0.623 & 0.267286 \tabularnewline
40 & -0.251393 & -2.6126 & 0.005133 \tabularnewline
41 & -0.260483 & -2.707 & 0.003947 \tabularnewline
42 & -0.31596 & -3.2836 & 0.000691 \tabularnewline
43 & -0.264979 & -2.7537 & 0.003457 \tabularnewline
44 & -0.173155 & -1.7995 & 0.037368 \tabularnewline
45 & -0.052657 & -0.5472 & 0.292676 \tabularnewline
46 & 0.10279 & 1.0682 & 0.143901 \tabularnewline
47 & 0.164267 & 1.7071 & 0.045337 \tabularnewline
48 & 0.212046 & 2.2036 & 0.014836 \tabularnewline
\hline
\end{tabular}
%Source: https://freestatistics.org/blog/index.php?pk=301587&T=1

[TABLE]
[ROW][C]Autocorrelation Function[/C][/ROW]
[ROW][C]Time lag k[/C][C]ACF(k)[/C][C]T-STAT[/C][C]P-value[/C][/ROW]
[ROW][C]1[/C][C]0.648954[/C][C]6.7441[/C][C]0[/C][/ROW]
[ROW][C]2[/C][C]0.454301[/C][C]4.7212[/C][C]4e-06[/C][/ROW]
[ROW][C]3[/C][C]0.272598[/C][C]2.8329[/C][C]0.002752[/C][/ROW]
[ROW][C]4[/C][C]0.03716[/C][C]0.3862[/C][C]0.350063[/C][/ROW]
[ROW][C]5[/C][C]-0.141565[/C][C]-1.4712[/C][C]0.072074[/C][/ROW]
[ROW][C]6[/C][C]-0.260466[/C][C]-2.7068[/C][C]0.003949[/C][/ROW]
[ROW][C]7[/C][C]-0.154923[/C][C]-1.61[/C][C]0.055157[/C][/ROW]
[ROW][C]8[/C][C]-0.081268[/C][C]-0.8446[/C][C]0.200112[/C][/ROW]
[ROW][C]9[/C][C]0.197568[/C][C]2.0532[/C][C]0.021235[/C][/ROW]
[ROW][C]10[/C][C]0.460225[/C][C]4.7828[/C][C]3e-06[/C][/ROW]
[ROW][C]11[/C][C]0.522798[/C][C]5.4331[/C][C]0[/C][/ROW]
[ROW][C]12[/C][C]0.605967[/C][C]6.2974[/C][C]0[/C][/ROW]
[ROW][C]13[/C][C]0.550846[/C][C]5.7246[/C][C]0[/C][/ROW]
[ROW][C]14[/C][C]0.443068[/C][C]4.6045[/C][C]6e-06[/C][/ROW]
[ROW][C]15[/C][C]0.157155[/C][C]1.6332[/C][C]0.052669[/C][/ROW]
[ROW][C]16[/C][C]-0.095116[/C][C]-0.9885[/C][C]0.162564[/C][/ROW]
[ROW][C]17[/C][C]-0.179676[/C][C]-1.8672[/C][C]0.03229[/C][/ROW]
[ROW][C]18[/C][C]-0.296532[/C][C]-3.0816[/C][C]0.001306[/C][/ROW]
[ROW][C]19[/C][C]-0.209347[/C][C]-2.1756[/C][C]0.015883[/C][/ROW]
[ROW][C]20[/C][C]-0.112792[/C][C]-1.1722[/C][C]0.121855[/C][/ROW]
[ROW][C]21[/C][C]0.081688[/C][C]0.8489[/C][C]0.198901[/C][/ROW]
[ROW][C]22[/C][C]0.259237[/C][C]2.6941[/C][C]0.004093[/C][/ROW]
[ROW][C]23[/C][C]0.406993[/C][C]4.2296[/C][C]2.5e-05[/C][/ROW]
[ROW][C]24[/C][C]0.495525[/C][C]5.1496[/C][C]1e-06[/C][/ROW]
[ROW][C]25[/C][C]0.348598[/C][C]3.6227[/C][C]0.000223[/C][/ROW]
[ROW][C]26[/C][C]0.214193[/C][C]2.226[/C][C]0.014047[/C][/ROW]
[ROW][C]27[/C][C]0.081208[/C][C]0.8439[/C][C]0.200286[/C][/ROW]
[ROW][C]28[/C][C]-0.121582[/C][C]-1.2635[/C][C]0.104562[/C][/ROW]
[ROW][C]29[/C][C]-0.272129[/C][C]-2.828[/C][C]0.002792[/C][/ROW]
[ROW][C]30[/C][C]-0.355574[/C][C]-3.6952[/C][C]0.000173[/C][/ROW]
[ROW][C]31[/C][C]-0.247486[/C][C]-2.572[/C][C]0.005736[/C][/ROW]
[ROW][C]32[/C][C]-0.161232[/C][C]-1.6756[/C][C]0.048357[/C][/ROW]
[ROW][C]33[/C][C]-0.000654[/C][C]-0.0068[/C][C]0.497295[/C][/ROW]
[ROW][C]34[/C][C]0.185829[/C][C]1.9312[/C][C]0.02804[/C][/ROW]
[ROW][C]35[/C][C]0.222226[/C][C]2.3094[/C][C]0.011411[/C][/ROW]
[ROW][C]36[/C][C]0.31084[/C][C]3.2303[/C][C]0.000819[/C][/ROW]
[ROW][C]37[/C][C]0.261423[/C][C]2.7168[/C][C]0.00384[/C][/ROW]
[ROW][C]38[/C][C]0.173652[/C][C]1.8046[/C][C]0.036959[/C][/ROW]
[ROW][C]39[/C][C]-0.059952[/C][C]-0.623[/C][C]0.267286[/C][/ROW]
[ROW][C]40[/C][C]-0.251393[/C][C]-2.6126[/C][C]0.005133[/C][/ROW]
[ROW][C]41[/C][C]-0.260483[/C][C]-2.707[/C][C]0.003947[/C][/ROW]
[ROW][C]42[/C][C]-0.31596[/C][C]-3.2836[/C][C]0.000691[/C][/ROW]
[ROW][C]43[/C][C]-0.264979[/C][C]-2.7537[/C][C]0.003457[/C][/ROW]
[ROW][C]44[/C][C]-0.173155[/C][C]-1.7995[/C][C]0.037368[/C][/ROW]
[ROW][C]45[/C][C]-0.052657[/C][C]-0.5472[/C][C]0.292676[/C][/ROW]
[ROW][C]46[/C][C]0.10279[/C][C]1.0682[/C][C]0.143901[/C][/ROW]
[ROW][C]47[/C][C]0.164267[/C][C]1.7071[/C][C]0.045337[/C][/ROW]
[ROW][C]48[/C][C]0.212046[/C][C]2.2036[/C][C]0.014836[/C][/ROW]
[/TABLE]
Source: https://freestatistics.org/blog/index.php?pk=301587&T=1

Globally Unique Identifier (entire table): ba.freestatistics.org/blog/index.php?pk=301587&T=1

As an alternative you can also use a QR Code:  

The GUIDs for individual cells are displayed in the table below:

Autocorrelation Function
Time lag kACF(k)T-STATP-value
10.6489546.74410
20.4543014.72124e-06
30.2725982.83290.002752
40.037160.38620.350063
5-0.141565-1.47120.072074
6-0.260466-2.70680.003949
7-0.154923-1.610.055157
8-0.081268-0.84460.200112
90.1975682.05320.021235
100.4602254.78283e-06
110.5227985.43310
120.6059676.29740
130.5508465.72460
140.4430684.60456e-06
150.1571551.63320.052669
16-0.095116-0.98850.162564
17-0.179676-1.86720.03229
18-0.296532-3.08160.001306
19-0.209347-2.17560.015883
20-0.112792-1.17220.121855
210.0816880.84890.198901
220.2592372.69410.004093
230.4069934.22962.5e-05
240.4955255.14961e-06
250.3485983.62270.000223
260.2141932.2260.014047
270.0812080.84390.200286
28-0.121582-1.26350.104562
29-0.272129-2.8280.002792
30-0.355574-3.69520.000173
31-0.247486-2.5720.005736
32-0.161232-1.67560.048357
33-0.000654-0.00680.497295
340.1858291.93120.02804
350.2222262.30940.011411
360.310843.23030.000819
370.2614232.71680.00384
380.1736521.80460.036959
39-0.059952-0.6230.267286
40-0.251393-2.61260.005133
41-0.260483-2.7070.003947
42-0.31596-3.28360.000691
43-0.264979-2.75370.003457
44-0.173155-1.79950.037368
45-0.052657-0.54720.292676
460.102791.06820.143901
470.1642671.70710.045337
480.2120462.20360.014836


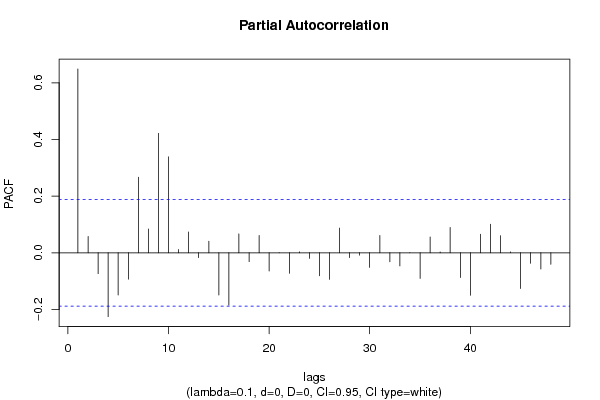
Partial Autocorrelation Function
Time lag kPACF(k)T-STATP-value
10.6489546.74410
20.0572850.59530.276437
3-0.073679-0.76570.222765
4-0.225588-2.34440.010444
5-0.149273-1.55130.061879
6-0.093142-0.9680.167613
70.2665972.77060.003295
80.0840530.87350.192162
90.4216184.38161.4e-05
100.338683.51970.000317
110.0117170.12180.451656
120.0735030.76390.223305
13-0.017117-0.17790.429575
140.0408470.42450.336024
15-0.149103-1.54950.062091
16-0.185018-1.92280.028572
170.0665830.6920.245225
18-0.031377-0.32610.372497
190.0608890.63280.264107
20-0.064196-0.66710.253052
21-0.000409-0.00430.498307
22-0.072472-0.75320.226498
230.0030520.03170.487378
24-0.01997-0.20750.417993
25-0.080921-0.8410.201115
26-0.093931-0.97620.165584
270.0870760.90490.183761
28-0.017116-0.17790.429579
29-0.008346-0.08670.46552
30-0.051599-0.53620.29645
310.0607980.63180.264415
32-0.031698-0.32940.371241
33-0.046484-0.48310.31501
34-0.000402-0.00420.498339
35-0.090618-0.94170.174215
360.0556810.57870.282014
370.0024440.02540.489891
380.0893050.92810.177716
39-0.087107-0.90520.183677
40-0.150143-1.56030.060803
410.0653680.67930.249193
420.1004391.04380.149455
430.0600930.62450.266806
440.0030330.03150.487456
45-0.126401-1.31360.095882
46-0.037237-0.3870.349766
47-0.057545-0.5980.275539
48-0.040534-0.42120.337207

\begin{tabular}{lllllllll}
\hline
Partial Autocorrelation Function \tabularnewline
Time lag k & PACF(k) & T-STAT & P-value \tabularnewline
1 & 0.648954 & 6.7441 & 0 \tabularnewline
2 & 0.057285 & 0.5953 & 0.276437 \tabularnewline
3 & -0.073679 & -0.7657 & 0.222765 \tabularnewline
4 & -0.225588 & -2.3444 & 0.010444 \tabularnewline
5 & -0.149273 & -1.5513 & 0.061879 \tabularnewline
6 & -0.093142 & -0.968 & 0.167613 \tabularnewline
7 & 0.266597 & 2.7706 & 0.003295 \tabularnewline
8 & 0.084053 & 0.8735 & 0.192162 \tabularnewline
9 & 0.421618 & 4.3816 & 1.4e-05 \tabularnewline
10 & 0.33868 & 3.5197 & 0.000317 \tabularnewline
11 & 0.011717 & 0.1218 & 0.451656 \tabularnewline
12 & 0.073503 & 0.7639 & 0.223305 \tabularnewline
13 & -0.017117 & -0.1779 & 0.429575 \tabularnewline
14 & 0.040847 & 0.4245 & 0.336024 \tabularnewline
15 & -0.149103 & -1.5495 & 0.062091 \tabularnewline
16 & -0.185018 & -1.9228 & 0.028572 \tabularnewline
17 & 0.066583 & 0.692 & 0.245225 \tabularnewline
18 & -0.031377 & -0.3261 & 0.372497 \tabularnewline
19 & 0.060889 & 0.6328 & 0.264107 \tabularnewline
20 & -0.064196 & -0.6671 & 0.253052 \tabularnewline
21 & -0.000409 & -0.0043 & 0.498307 \tabularnewline
22 & -0.072472 & -0.7532 & 0.226498 \tabularnewline
23 & 0.003052 & 0.0317 & 0.487378 \tabularnewline
24 & -0.01997 & -0.2075 & 0.417993 \tabularnewline
25 & -0.080921 & -0.841 & 0.201115 \tabularnewline
26 & -0.093931 & -0.9762 & 0.165584 \tabularnewline
27 & 0.087076 & 0.9049 & 0.183761 \tabularnewline
28 & -0.017116 & -0.1779 & 0.429579 \tabularnewline
29 & -0.008346 & -0.0867 & 0.46552 \tabularnewline
30 & -0.051599 & -0.5362 & 0.29645 \tabularnewline
31 & 0.060798 & 0.6318 & 0.264415 \tabularnewline
32 & -0.031698 & -0.3294 & 0.371241 \tabularnewline
33 & -0.046484 & -0.4831 & 0.31501 \tabularnewline
34 & -0.000402 & -0.0042 & 0.498339 \tabularnewline
35 & -0.090618 & -0.9417 & 0.174215 \tabularnewline
36 & 0.055681 & 0.5787 & 0.282014 \tabularnewline
37 & 0.002444 & 0.0254 & 0.489891 \tabularnewline
38 & 0.089305 & 0.9281 & 0.177716 \tabularnewline
39 & -0.087107 & -0.9052 & 0.183677 \tabularnewline
40 & -0.150143 & -1.5603 & 0.060803 \tabularnewline
41 & 0.065368 & 0.6793 & 0.249193 \tabularnewline
42 & 0.100439 & 1.0438 & 0.149455 \tabularnewline
43 & 0.060093 & 0.6245 & 0.266806 \tabularnewline
44 & 0.003033 & 0.0315 & 0.487456 \tabularnewline
45 & -0.126401 & -1.3136 & 0.095882 \tabularnewline
46 & -0.037237 & -0.387 & 0.349766 \tabularnewline
47 & -0.057545 & -0.598 & 0.275539 \tabularnewline
48 & -0.040534 & -0.4212 & 0.337207 \tabularnewline
\hline
\end{tabular}
%Source: https://freestatistics.org/blog/index.php?pk=301587&T=2

[TABLE]
[ROW][C]Partial Autocorrelation Function[/C][/ROW]
[ROW][C]Time lag k[/C][C]PACF(k)[/C][C]T-STAT[/C][C]P-value[/C][/ROW]
[ROW][C]1[/C][C]0.648954[/C][C]6.7441[/C][C]0[/C][/ROW]
[ROW][C]2[/C][C]0.057285[/C][C]0.5953[/C][C]0.276437[/C][/ROW]
[ROW][C]3[/C][C]-0.073679[/C][C]-0.7657[/C][C]0.222765[/C][/ROW]
[ROW][C]4[/C][C]-0.225588[/C][C]-2.3444[/C][C]0.010444[/C][/ROW]
[ROW][C]5[/C][C]-0.149273[/C][C]-1.5513[/C][C]0.061879[/C][/ROW]
[ROW][C]6[/C][C]-0.093142[/C][C]-0.968[/C][C]0.167613[/C][/ROW]
[ROW][C]7[/C][C]0.266597[/C][C]2.7706[/C][C]0.003295[/C][/ROW]
[ROW][C]8[/C][C]0.084053[/C][C]0.8735[/C][C]0.192162[/C][/ROW]
[ROW][C]9[/C][C]0.421618[/C][C]4.3816[/C][C]1.4e-05[/C][/ROW]
[ROW][C]10[/C][C]0.33868[/C][C]3.5197[/C][C]0.000317[/C][/ROW]
[ROW][C]11[/C][C]0.011717[/C][C]0.1218[/C][C]0.451656[/C][/ROW]
[ROW][C]12[/C][C]0.073503[/C][C]0.7639[/C][C]0.223305[/C][/ROW]
[ROW][C]13[/C][C]-0.017117[/C][C]-0.1779[/C][C]0.429575[/C][/ROW]
[ROW][C]14[/C][C]0.040847[/C][C]0.4245[/C][C]0.336024[/C][/ROW]
[ROW][C]15[/C][C]-0.149103[/C][C]-1.5495[/C][C]0.062091[/C][/ROW]
[ROW][C]16[/C][C]-0.185018[/C][C]-1.9228[/C][C]0.028572[/C][/ROW]
[ROW][C]17[/C][C]0.066583[/C][C]0.692[/C][C]0.245225[/C][/ROW]
[ROW][C]18[/C][C]-0.031377[/C][C]-0.3261[/C][C]0.372497[/C][/ROW]
[ROW][C]19[/C][C]0.060889[/C][C]0.6328[/C][C]0.264107[/C][/ROW]
[ROW][C]20[/C][C]-0.064196[/C][C]-0.6671[/C][C]0.253052[/C][/ROW]
[ROW][C]21[/C][C]-0.000409[/C][C]-0.0043[/C][C]0.498307[/C][/ROW]
[ROW][C]22[/C][C]-0.072472[/C][C]-0.7532[/C][C]0.226498[/C][/ROW]
[ROW][C]23[/C][C]0.003052[/C][C]0.0317[/C][C]0.487378[/C][/ROW]
[ROW][C]24[/C][C]-0.01997[/C][C]-0.2075[/C][C]0.417993[/C][/ROW]
[ROW][C]25[/C][C]-0.080921[/C][C]-0.841[/C][C]0.201115[/C][/ROW]
[ROW][C]26[/C][C]-0.093931[/C][C]-0.9762[/C][C]0.165584[/C][/ROW]
[ROW][C]27[/C][C]0.087076[/C][C]0.9049[/C][C]0.183761[/C][/ROW]
[ROW][C]28[/C][C]-0.017116[/C][C]-0.1779[/C][C]0.429579[/C][/ROW]
[ROW][C]29[/C][C]-0.008346[/C][C]-0.0867[/C][C]0.46552[/C][/ROW]
[ROW][C]30[/C][C]-0.051599[/C][C]-0.5362[/C][C]0.29645[/C][/ROW]
[ROW][C]31[/C][C]0.060798[/C][C]0.6318[/C][C]0.264415[/C][/ROW]
[ROW][C]32[/C][C]-0.031698[/C][C]-0.3294[/C][C]0.371241[/C][/ROW]
[ROW][C]33[/C][C]-0.046484[/C][C]-0.4831[/C][C]0.31501[/C][/ROW]
[ROW][C]34[/C][C]-0.000402[/C][C]-0.0042[/C][C]0.498339[/C][/ROW]
[ROW][C]35[/C][C]-0.090618[/C][C]-0.9417[/C][C]0.174215[/C][/ROW]
[ROW][C]36[/C][C]0.055681[/C][C]0.5787[/C][C]0.282014[/C][/ROW]
[ROW][C]37[/C][C]0.002444[/C][C]0.0254[/C][C]0.489891[/C][/ROW]
[ROW][C]38[/C][C]0.089305[/C][C]0.9281[/C][C]0.177716[/C][/ROW]
[ROW][C]39[/C][C]-0.087107[/C][C]-0.9052[/C][C]0.183677[/C][/ROW]
[ROW][C]40[/C][C]-0.150143[/C][C]-1.5603[/C][C]0.060803[/C][/ROW]
[ROW][C]41[/C][C]0.065368[/C][C]0.6793[/C][C]0.249193[/C][/ROW]
[ROW][C]42[/C][C]0.100439[/C][C]1.0438[/C][C]0.149455[/C][/ROW]
[ROW][C]43[/C][C]0.060093[/C][C]0.6245[/C][C]0.266806[/C][/ROW]
[ROW][C]44[/C][C]0.003033[/C][C]0.0315[/C][C]0.487456[/C][/ROW]
[ROW][C]45[/C][C]-0.126401[/C][C]-1.3136[/C][C]0.095882[/C][/ROW]
[ROW][C]46[/C][C]-0.037237[/C][C]-0.387[/C][C]0.349766[/C][/ROW]
[ROW][C]47[/C][C]-0.057545[/C][C]-0.598[/C][C]0.275539[/C][/ROW]
[ROW][C]48[/C][C]-0.040534[/C][C]-0.4212[/C][C]0.337207[/C][/ROW]
[/TABLE]
Source: https://freestatistics.org/blog/index.php?pk=301587&T=2

Globally Unique Identifier (entire table): ba.freestatistics.org/blog/index.php?pk=301587&T=2

As an alternative you can also use a QR Code:  

The GUIDs for individual cells are displayed in the table below:

Partial Autocorrelation Function
Time lag kPACF(k)T-STATP-value
10.6489546.74410
20.0572850.59530.276437
3-0.073679-0.76570.222765
4-0.225588-2.34440.010444
5-0.149273-1.55130.061879
6-0.093142-0.9680.167613
70.2665972.77060.003295
80.0840530.87350.192162
90.4216184.38161.4e-05
100.338683.51970.000317
110.0117170.12180.451656
120.0735030.76390.223305
13-0.017117-0.17790.429575
140.0408470.42450.336024
15-0.149103-1.54950.062091
16-0.185018-1.92280.028572
170.0665830.6920.245225
18-0.031377-0.32610.372497
190.0608890.63280.264107
20-0.064196-0.66710.253052
21-0.000409-0.00430.498307
22-0.072472-0.75320.226498
230.0030520.03170.487378
24-0.01997-0.20750.417993
25-0.080921-0.8410.201115
26-0.093931-0.97620.165584
270.0870760.90490.183761
28-0.017116-0.17790.429579
29-0.008346-0.08670.46552
30-0.051599-0.53620.29645
310.0607980.63180.264415
32-0.031698-0.32940.371241
33-0.046484-0.48310.31501
34-0.000402-0.00420.498339
35-0.090618-0.94170.174215
360.0556810.57870.282014
370.0024440.02540.489891
380.0893050.92810.177716
39-0.087107-0.90520.183677
40-0.150143-1.56030.060803
410.0653680.67930.249193
420.1004391.04380.149455
430.0600930.62450.266806
440.0030330.03150.487456
45-0.126401-1.31360.095882
46-0.037237-0.3870.349766
47-0.057545-0.5980.275539
48-0.040534-0.42120.337207


Parameters (Session):
par1 = Default ; par2 = 0.1 ; par3 = 0 ; par4 = 0 ; par5 = 12 ; par6 = White Noise ; par7 = 0.95 ;
Parameters (R input):
par1 = 48 ; par2 = 0.1 ; par3 = 0 ; par4 = 0 ; par5 = 12 ; par6 = White Noise ; par7 = 0.95 ; par8 = ;
R code (references can be found in the software module):
if (par1 == 'Default') {
par1 = 10*log10(length(x))
} else {
par1 <- as.numeric(par1)
}
par2 <- as.numeric(par2)
par3 <- as.numeric(par3)
par4 <- as.numeric(par4)
par5 <- as.numeric(par5)
if (par6 == 'White Noise') par6 <- 'white' else par6 <- 'ma'
par7 <- as.numeric(par7)
if (par8 != '') par8 <- as.numeric(par8)
x <- na.omit(x)
ox <- x
if (par8 == '') {
if (par2 == 0) {
x <- log(x)
} else {
x <- (x ^ par2 - 1) / par2
}
} else {
x <- log(x,base=par8)
}
if (par3 > 0) x <- diff(x,lag=1,difference=par3)
if (par4 > 0) x <- diff(x,lag=par5,difference=par4)
bitmap(file='picts.png')
op <- par(mfrow=c(2,1))
plot(ox,type='l',main='Original Time Series',xlab='time',ylab='value')
if (par8=='') {
mytitle <- paste('Working Time Series (lambda=',par2,', d=',par3,', D=',par4,')',sep='')
mysub <- paste('(lambda=',par2,', d=',par3,', D=',par4,', CI=', par7, ', CI type=',par6,')',sep='')
} else {
mytitle <- paste('Working Time Series (base=',par8,', d=',par3,', D=',par4,')',sep='')
mysub <- paste('(base=',par8,', d=',par3,', D=',par4,', CI=', par7, ', CI type=',par6,')',sep='')
}
plot(x,type='l', main=mytitle,xlab='time',ylab='value')
par(op)
dev.off()
bitmap(file='pic1.png')
racf <- acf(x, par1, main='Autocorrelation', xlab='time lag', ylab='ACF', ci.type=par6, ci=par7, sub=mysub)
dev.off()
bitmap(file='pic2.png')
rpacf <- pacf(x,par1,main='Partial Autocorrelation',xlab='lags',ylab='PACF',sub=mysub)
dev.off()
(myacf <- c(racf$acf))
(mypacf <- c(rpacf$acf))
lengthx <- length(x)
sqrtn <- sqrt(lengthx)
load(file='createtable')
a<-table.start()
a<-table.row.start(a)
a<-table.element(a,'Autocorrelation Function',4,TRUE)
a<-table.row.end(a)
a<-table.row.start(a)
a<-table.element(a,'Time lag k',header=TRUE)
a<-table.element(a,'ACF(k)',header=TRUE)
a<-table.element(a,'T-STAT',header=TRUE)
a<-table.element(a,'P-value',header=TRUE)
a<-table.row.end(a)
for (i in 2:(par1+1)) {
a<-table.row.start(a)
a<-table.element(a,i-1,header=TRUE)
a<-table.element(a,round(myacf[i],6))
mytstat <- myacf[i]*sqrtn
a<-table.element(a,round(mytstat,4))
a<-table.element(a,round(1-pt(abs(mytstat),lengthx),6))
a<-table.row.end(a)
}
a<-table.end(a)
table.save(a,file='mytable.tab')
a<-table.start()
a<-table.row.start(a)
a<-table.element(a,'Partial Autocorrelation Function',4,TRUE)
a<-table.row.end(a)
a<-table.row.start(a)
a<-table.element(a,'Time lag k',header=TRUE)
a<-table.element(a,'PACF(k)',header=TRUE)
a<-table.element(a,'T-STAT',header=TRUE)
a<-table.element(a,'P-value',header=TRUE)
a<-table.row.end(a)
for (i in 1:par1) {
a<-table.row.start(a)
a<-table.element(a,i,header=TRUE)
a<-table.element(a,round(mypacf[i],6))
mytstat <- mypacf[i]*sqrtn
a<-table.element(a,round(mytstat,4))
a<-table.element(a,round(1-pt(abs(mytstat),lengthx),6))
a<-table.row.end(a)
}
a<-table.end(a)
table.save(a,file='mytable1.tab')