Free Statistics

of Irreproducible Research!

Author's title

Author*The author of this computation has been verified*
R Software Modulerwasp_autocorrelation.wasp
Title produced by software(Partial) Autocorrelation Function
Date of computationTue, 20 Dec 2016 11:40:28 +0100
Cite this page as followsStatistical Computations at FreeStatistics.org, Office for Research Development and Education, URL https://freestatistics.org/blog/index.php?v=date/2016/Dec/20/t1482230468f3sosm3dq89i5na.htm/, Retrieved Sat, 27 Apr 2024 20:58:55 +0000
Statistical Computations at FreeStatistics.org, Office for Research Development and Education, URL https://freestatistics.org/blog/index.php?pk=301588, Retrieved Sat, 27 Apr 2024 20:58:55 +0000
QR Codes:

Original text written by user:
IsPrivate?No (this computation is public)
User-defined keywords
Estimated Impact110
Family? (F = Feedback message, R = changed R code, M = changed R Module, P = changed Parameters, D = changed Data)
-       [(Partial) Autocorrelation Function] [Autocorrelation d...] [2016-12-20 10:40:28] [e8b5e2ae4a4517822f644e6c122e1af0] [Current]
Feedback Forum

Post a new message
Dataseries X:
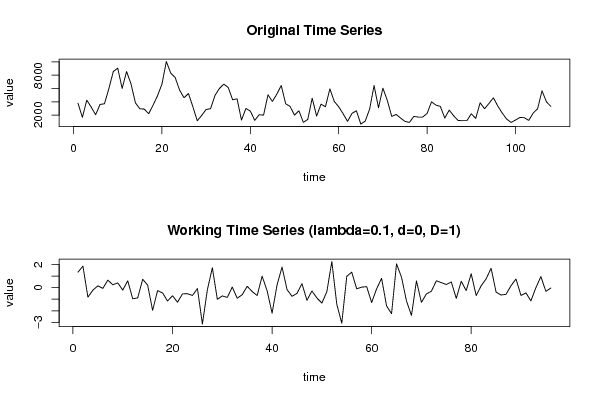
3800
1650
4250
3200
2050
3600
3700
6000
8550
9050
6000
8550
6700
3850
2950
2900
2200
3500
4900
6650
10050
8300
7650
5750
4600
5250
3250
1150
1950
2850
2950
4950
6000
6650
6150
4300
4450
1250
3000
2600
1200
2050
2000
5050
4050
5150
6450
3700
3300
2000
2650
900
1350
4550
1850
3650
3250
5950
4050
3250
2200
1050
2250
2650
650
1100
2900
6450
3100
6050
4200
1800
2100
1550
1050
900
1800
1700
1700
2250
4000
3500
3300
1550
2750
1900
1200
1150
1150
2200
1500
3850
2950
3750
4600
3350
2300
1400
900
1250
1650
1600
1200
2300
2950
5650
4000
3300


Summary of computational transaction
Raw Input view raw input (R code)
Raw Outputview raw output of R engine
Computing time1 seconds
R ServerBig Analytics Cloud Computing Center

\begin{tabular}{lllllllll}
\hline
Summary of computational transaction \tabularnewline
Raw Input view raw input (R code)  \tabularnewline
Raw Outputview raw output of R engine  \tabularnewline
Computing time1 seconds \tabularnewline
R ServerBig Analytics Cloud Computing Center \tabularnewline
\hline
\end{tabular}
%Source: https://freestatistics.org/blog/index.php?pk=301588&T=0

[TABLE]
[ROW]
Summary of computational transaction[/C][/ROW] [ROW]Raw Input[/C] view raw input (R code) [/C][/ROW] [ROW]Raw Output[/C]view raw output of R engine [/C][/ROW] [ROW]Computing time[/C]1 seconds[/C][/ROW] [ROW]R Server[/C]Big Analytics Cloud Computing Center[/C][/ROW] [/TABLE] Source: https://freestatistics.org/blog/index.php?pk=301588&T=0

Globally Unique Identifier (entire table): ba.freestatistics.org/blog/index.php?pk=301588&T=0

As an alternative you can also use a QR Code:  

The GUIDs for individual cells are displayed in the table below:

Summary of computational transaction
Raw Input view raw input (R code)
Raw Outputview raw output of R engine
Computing time1 seconds
R ServerBig Analytics Cloud Computing Center


Autocorrelation Function
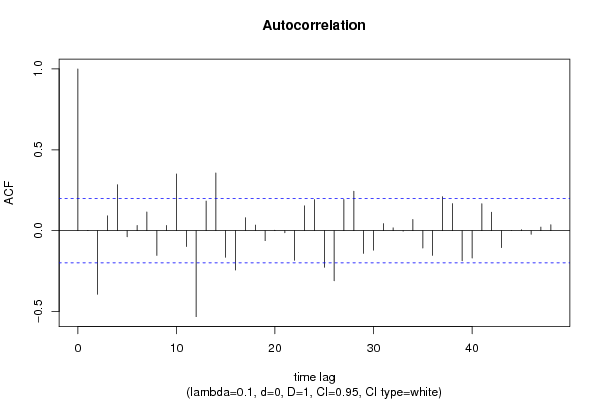
Time lag kACF(k)T-STATP-value
10.0008450.00830.496705
2-0.393115-3.85170.000106
30.0914590.89610.186216
40.2836332.7790.00328
5-0.037809-0.37050.35593
60.0322370.31590.376398
70.1149031.12580.131525
8-0.153176-1.50080.068343
90.0320880.31440.376952
100.3505193.43440.000439
11-0.097793-0.95820.170192
12-0.531895-5.21151e-06
130.1827471.79050.038259
140.3568983.49690.000357
15-0.164205-1.60890.055464
16-0.243104-2.38190.009597
170.0801130.78490.21721
180.0343230.33630.368692
19-0.061784-0.60540.273185
200.0026360.02580.489723
21-0.013292-0.13020.448327
22-0.18328-1.79580.037838
230.1531891.50090.068327
240.1917871.87910.031631
25-0.226388-2.21810.014451
26-0.309898-3.03640.001541
270.1932041.8930.030685
280.2432332.38320.009566
29-0.140711-1.37870.085598
30-0.120423-1.17990.120477
310.0437060.42820.334722
320.0172480.1690.433078
33-0.003067-0.030.488046
340.0694060.680.24906
35-0.10776-1.05580.146848
36-0.152808-1.49720.06881
370.2100592.05820.021143
380.1670191.63640.05251
39-0.18671-1.82940.035224
40-0.169036-1.65620.050473
410.1665721.63210.052971
420.1142321.11920.132915
43-0.104834-1.02720.153463
440.000480.00470.498127
450.0054670.05360.478696
46-0.022146-0.2170.414339
470.0220780.21630.414599
480.0369080.36160.359216

\begin{tabular}{lllllllll}
\hline
Autocorrelation Function \tabularnewline
Time lag k & ACF(k) & T-STAT & P-value \tabularnewline
1 & 0.000845 & 0.0083 & 0.496705 \tabularnewline
2 & -0.393115 & -3.8517 & 0.000106 \tabularnewline
3 & 0.091459 & 0.8961 & 0.186216 \tabularnewline
4 & 0.283633 & 2.779 & 0.00328 \tabularnewline
5 & -0.037809 & -0.3705 & 0.35593 \tabularnewline
6 & 0.032237 & 0.3159 & 0.376398 \tabularnewline
7 & 0.114903 & 1.1258 & 0.131525 \tabularnewline
8 & -0.153176 & -1.5008 & 0.068343 \tabularnewline
9 & 0.032088 & 0.3144 & 0.376952 \tabularnewline
10 & 0.350519 & 3.4344 & 0.000439 \tabularnewline
11 & -0.097793 & -0.9582 & 0.170192 \tabularnewline
12 & -0.531895 & -5.2115 & 1e-06 \tabularnewline
13 & 0.182747 & 1.7905 & 0.038259 \tabularnewline
14 & 0.356898 & 3.4969 & 0.000357 \tabularnewline
15 & -0.164205 & -1.6089 & 0.055464 \tabularnewline
16 & -0.243104 & -2.3819 & 0.009597 \tabularnewline
17 & 0.080113 & 0.7849 & 0.21721 \tabularnewline
18 & 0.034323 & 0.3363 & 0.368692 \tabularnewline
19 & -0.061784 & -0.6054 & 0.273185 \tabularnewline
20 & 0.002636 & 0.0258 & 0.489723 \tabularnewline
21 & -0.013292 & -0.1302 & 0.448327 \tabularnewline
22 & -0.18328 & -1.7958 & 0.037838 \tabularnewline
23 & 0.153189 & 1.5009 & 0.068327 \tabularnewline
24 & 0.191787 & 1.8791 & 0.031631 \tabularnewline
25 & -0.226388 & -2.2181 & 0.014451 \tabularnewline
26 & -0.309898 & -3.0364 & 0.001541 \tabularnewline
27 & 0.193204 & 1.893 & 0.030685 \tabularnewline
28 & 0.243233 & 2.3832 & 0.009566 \tabularnewline
29 & -0.140711 & -1.3787 & 0.085598 \tabularnewline
30 & -0.120423 & -1.1799 & 0.120477 \tabularnewline
31 & 0.043706 & 0.4282 & 0.334722 \tabularnewline
32 & 0.017248 & 0.169 & 0.433078 \tabularnewline
33 & -0.003067 & -0.03 & 0.488046 \tabularnewline
34 & 0.069406 & 0.68 & 0.24906 \tabularnewline
35 & -0.10776 & -1.0558 & 0.146848 \tabularnewline
36 & -0.152808 & -1.4972 & 0.06881 \tabularnewline
37 & 0.210059 & 2.0582 & 0.021143 \tabularnewline
38 & 0.167019 & 1.6364 & 0.05251 \tabularnewline
39 & -0.18671 & -1.8294 & 0.035224 \tabularnewline
40 & -0.169036 & -1.6562 & 0.050473 \tabularnewline
41 & 0.166572 & 1.6321 & 0.052971 \tabularnewline
42 & 0.114232 & 1.1192 & 0.132915 \tabularnewline
43 & -0.104834 & -1.0272 & 0.153463 \tabularnewline
44 & 0.00048 & 0.0047 & 0.498127 \tabularnewline
45 & 0.005467 & 0.0536 & 0.478696 \tabularnewline
46 & -0.022146 & -0.217 & 0.414339 \tabularnewline
47 & 0.022078 & 0.2163 & 0.414599 \tabularnewline
48 & 0.036908 & 0.3616 & 0.359216 \tabularnewline
\hline
\end{tabular}
%Source: https://freestatistics.org/blog/index.php?pk=301588&T=1

[TABLE]
[ROW][C]Autocorrelation Function[/C][/ROW]
[ROW][C]Time lag k[/C][C]ACF(k)[/C][C]T-STAT[/C][C]P-value[/C][/ROW]
[ROW][C]1[/C][C]0.000845[/C][C]0.0083[/C][C]0.496705[/C][/ROW]
[ROW][C]2[/C][C]-0.393115[/C][C]-3.8517[/C][C]0.000106[/C][/ROW]
[ROW][C]3[/C][C]0.091459[/C][C]0.8961[/C][C]0.186216[/C][/ROW]
[ROW][C]4[/C][C]0.283633[/C][C]2.779[/C][C]0.00328[/C][/ROW]
[ROW][C]5[/C][C]-0.037809[/C][C]-0.3705[/C][C]0.35593[/C][/ROW]
[ROW][C]6[/C][C]0.032237[/C][C]0.3159[/C][C]0.376398[/C][/ROW]
[ROW][C]7[/C][C]0.114903[/C][C]1.1258[/C][C]0.131525[/C][/ROW]
[ROW][C]8[/C][C]-0.153176[/C][C]-1.5008[/C][C]0.068343[/C][/ROW]
[ROW][C]9[/C][C]0.032088[/C][C]0.3144[/C][C]0.376952[/C][/ROW]
[ROW][C]10[/C][C]0.350519[/C][C]3.4344[/C][C]0.000439[/C][/ROW]
[ROW][C]11[/C][C]-0.097793[/C][C]-0.9582[/C][C]0.170192[/C][/ROW]
[ROW][C]12[/C][C]-0.531895[/C][C]-5.2115[/C][C]1e-06[/C][/ROW]
[ROW][C]13[/C][C]0.182747[/C][C]1.7905[/C][C]0.038259[/C][/ROW]
[ROW][C]14[/C][C]0.356898[/C][C]3.4969[/C][C]0.000357[/C][/ROW]
[ROW][C]15[/C][C]-0.164205[/C][C]-1.6089[/C][C]0.055464[/C][/ROW]
[ROW][C]16[/C][C]-0.243104[/C][C]-2.3819[/C][C]0.009597[/C][/ROW]
[ROW][C]17[/C][C]0.080113[/C][C]0.7849[/C][C]0.21721[/C][/ROW]
[ROW][C]18[/C][C]0.034323[/C][C]0.3363[/C][C]0.368692[/C][/ROW]
[ROW][C]19[/C][C]-0.061784[/C][C]-0.6054[/C][C]0.273185[/C][/ROW]
[ROW][C]20[/C][C]0.002636[/C][C]0.0258[/C][C]0.489723[/C][/ROW]
[ROW][C]21[/C][C]-0.013292[/C][C]-0.1302[/C][C]0.448327[/C][/ROW]
[ROW][C]22[/C][C]-0.18328[/C][C]-1.7958[/C][C]0.037838[/C][/ROW]
[ROW][C]23[/C][C]0.153189[/C][C]1.5009[/C][C]0.068327[/C][/ROW]
[ROW][C]24[/C][C]0.191787[/C][C]1.8791[/C][C]0.031631[/C][/ROW]
[ROW][C]25[/C][C]-0.226388[/C][C]-2.2181[/C][C]0.014451[/C][/ROW]
[ROW][C]26[/C][C]-0.309898[/C][C]-3.0364[/C][C]0.001541[/C][/ROW]
[ROW][C]27[/C][C]0.193204[/C][C]1.893[/C][C]0.030685[/C][/ROW]
[ROW][C]28[/C][C]0.243233[/C][C]2.3832[/C][C]0.009566[/C][/ROW]
[ROW][C]29[/C][C]-0.140711[/C][C]-1.3787[/C][C]0.085598[/C][/ROW]
[ROW][C]30[/C][C]-0.120423[/C][C]-1.1799[/C][C]0.120477[/C][/ROW]
[ROW][C]31[/C][C]0.043706[/C][C]0.4282[/C][C]0.334722[/C][/ROW]
[ROW][C]32[/C][C]0.017248[/C][C]0.169[/C][C]0.433078[/C][/ROW]
[ROW][C]33[/C][C]-0.003067[/C][C]-0.03[/C][C]0.488046[/C][/ROW]
[ROW][C]34[/C][C]0.069406[/C][C]0.68[/C][C]0.24906[/C][/ROW]
[ROW][C]35[/C][C]-0.10776[/C][C]-1.0558[/C][C]0.146848[/C][/ROW]
[ROW][C]36[/C][C]-0.152808[/C][C]-1.4972[/C][C]0.06881[/C][/ROW]
[ROW][C]37[/C][C]0.210059[/C][C]2.0582[/C][C]0.021143[/C][/ROW]
[ROW][C]38[/C][C]0.167019[/C][C]1.6364[/C][C]0.05251[/C][/ROW]
[ROW][C]39[/C][C]-0.18671[/C][C]-1.8294[/C][C]0.035224[/C][/ROW]
[ROW][C]40[/C][C]-0.169036[/C][C]-1.6562[/C][C]0.050473[/C][/ROW]
[ROW][C]41[/C][C]0.166572[/C][C]1.6321[/C][C]0.052971[/C][/ROW]
[ROW][C]42[/C][C]0.114232[/C][C]1.1192[/C][C]0.132915[/C][/ROW]
[ROW][C]43[/C][C]-0.104834[/C][C]-1.0272[/C][C]0.153463[/C][/ROW]
[ROW][C]44[/C][C]0.00048[/C][C]0.0047[/C][C]0.498127[/C][/ROW]
[ROW][C]45[/C][C]0.005467[/C][C]0.0536[/C][C]0.478696[/C][/ROW]
[ROW][C]46[/C][C]-0.022146[/C][C]-0.217[/C][C]0.414339[/C][/ROW]
[ROW][C]47[/C][C]0.022078[/C][C]0.2163[/C][C]0.414599[/C][/ROW]
[ROW][C]48[/C][C]0.036908[/C][C]0.3616[/C][C]0.359216[/C][/ROW]
[/TABLE]
Source: https://freestatistics.org/blog/index.php?pk=301588&T=1

Globally Unique Identifier (entire table): ba.freestatistics.org/blog/index.php?pk=301588&T=1

As an alternative you can also use a QR Code:  

The GUIDs for individual cells are displayed in the table below:

Autocorrelation Function
Time lag kACF(k)T-STATP-value
10.0008450.00830.496705
2-0.393115-3.85170.000106
30.0914590.89610.186216
40.2836332.7790.00328
5-0.037809-0.37050.35593
60.0322370.31590.376398
70.1149031.12580.131525
8-0.153176-1.50080.068343
90.0320880.31440.376952
100.3505193.43440.000439
11-0.097793-0.95820.170192
12-0.531895-5.21151e-06
130.1827471.79050.038259
140.3568983.49690.000357
15-0.164205-1.60890.055464
16-0.243104-2.38190.009597
170.0801130.78490.21721
180.0343230.33630.368692
19-0.061784-0.60540.273185
200.0026360.02580.489723
21-0.013292-0.13020.448327
22-0.18328-1.79580.037838
230.1531891.50090.068327
240.1917871.87910.031631
25-0.226388-2.21810.014451
26-0.309898-3.03640.001541
270.1932041.8930.030685
280.2432332.38320.009566
29-0.140711-1.37870.085598
30-0.120423-1.17990.120477
310.0437060.42820.334722
320.0172480.1690.433078
33-0.003067-0.030.488046
340.0694060.680.24906
35-0.10776-1.05580.146848
36-0.152808-1.49720.06881
370.2100592.05820.021143
380.1670191.63640.05251
39-0.18671-1.82940.035224
40-0.169036-1.65620.050473
410.1665721.63210.052971
420.1142321.11920.132915
43-0.104834-1.02720.153463
440.000480.00470.498127
450.0054670.05360.478696
46-0.022146-0.2170.414339
470.0220780.21630.414599
480.0369080.36160.359216


Partial Autocorrelation Function
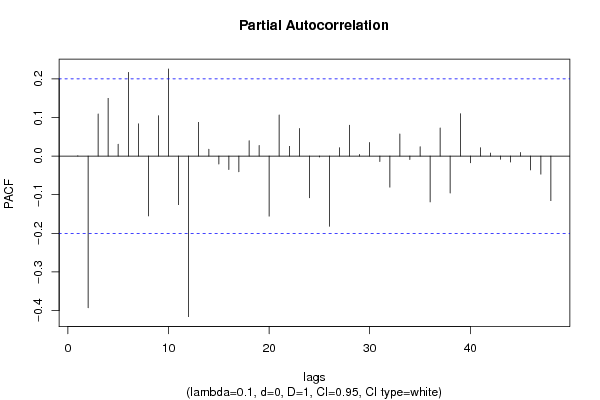
Time lag kPACF(k)T-STATP-value
10.0008450.00830.496705
2-0.393116-3.85170.000106
30.1091181.06910.143846
40.1495331.46510.073078
50.0307140.30090.382058
60.2168912.12510.018073
70.0835360.81850.207555
8-0.155064-1.51930.065986
90.1046751.02560.153828
100.2258282.21270.014646
11-0.125893-1.23350.110201
12-0.416116-4.07714.7e-05
130.0873260.85560.19717
140.0176380.17280.431579
15-0.020659-0.20240.420011
16-0.034905-0.3420.366549
17-0.040631-0.39810.345721
180.0395570.38760.349593
190.027490.26930.394122
20-0.155659-1.52510.065256
210.1063041.04160.150116
220.0252870.24780.402424
230.0713790.69940.243008
24-0.108128-1.05940.146031
25-0.002443-0.02390.490477
26-0.182039-1.78360.038823
270.0218210.21380.415579
280.0798710.78260.217902
290.004150.04070.483825
300.0353040.34590.365085
31-0.014065-0.13780.445342
32-0.080481-0.78850.21616
330.057150.560.288408
34-0.009071-0.08890.464684
350.0243130.23820.406109
36-0.118614-1.16220.124023
370.0729390.71470.238278
38-0.09549-0.93560.175912
390.1098151.0760.142321
40-0.017122-0.16780.433564
410.0218290.21390.415547
420.007750.07590.469815
43-0.008071-0.07910.468567
44-0.015191-0.14880.440995
450.0093090.09120.463758
46-0.035726-0.350.363535
47-0.04678-0.45840.323867
48-0.115537-1.1320.130221

\begin{tabular}{lllllllll}
\hline
Partial Autocorrelation Function \tabularnewline
Time lag k & PACF(k) & T-STAT & P-value \tabularnewline
1 & 0.000845 & 0.0083 & 0.496705 \tabularnewline
2 & -0.393116 & -3.8517 & 0.000106 \tabularnewline
3 & 0.109118 & 1.0691 & 0.143846 \tabularnewline
4 & 0.149533 & 1.4651 & 0.073078 \tabularnewline
5 & 0.030714 & 0.3009 & 0.382058 \tabularnewline
6 & 0.216891 & 2.1251 & 0.018073 \tabularnewline
7 & 0.083536 & 0.8185 & 0.207555 \tabularnewline
8 & -0.155064 & -1.5193 & 0.065986 \tabularnewline
9 & 0.104675 & 1.0256 & 0.153828 \tabularnewline
10 & 0.225828 & 2.2127 & 0.014646 \tabularnewline
11 & -0.125893 & -1.2335 & 0.110201 \tabularnewline
12 & -0.416116 & -4.0771 & 4.7e-05 \tabularnewline
13 & 0.087326 & 0.8556 & 0.19717 \tabularnewline
14 & 0.017638 & 0.1728 & 0.431579 \tabularnewline
15 & -0.020659 & -0.2024 & 0.420011 \tabularnewline
16 & -0.034905 & -0.342 & 0.366549 \tabularnewline
17 & -0.040631 & -0.3981 & 0.345721 \tabularnewline
18 & 0.039557 & 0.3876 & 0.349593 \tabularnewline
19 & 0.02749 & 0.2693 & 0.394122 \tabularnewline
20 & -0.155659 & -1.5251 & 0.065256 \tabularnewline
21 & 0.106304 & 1.0416 & 0.150116 \tabularnewline
22 & 0.025287 & 0.2478 & 0.402424 \tabularnewline
23 & 0.071379 & 0.6994 & 0.243008 \tabularnewline
24 & -0.108128 & -1.0594 & 0.146031 \tabularnewline
25 & -0.002443 & -0.0239 & 0.490477 \tabularnewline
26 & -0.182039 & -1.7836 & 0.038823 \tabularnewline
27 & 0.021821 & 0.2138 & 0.415579 \tabularnewline
28 & 0.079871 & 0.7826 & 0.217902 \tabularnewline
29 & 0.00415 & 0.0407 & 0.483825 \tabularnewline
30 & 0.035304 & 0.3459 & 0.365085 \tabularnewline
31 & -0.014065 & -0.1378 & 0.445342 \tabularnewline
32 & -0.080481 & -0.7885 & 0.21616 \tabularnewline
33 & 0.05715 & 0.56 & 0.288408 \tabularnewline
34 & -0.009071 & -0.0889 & 0.464684 \tabularnewline
35 & 0.024313 & 0.2382 & 0.406109 \tabularnewline
36 & -0.118614 & -1.1622 & 0.124023 \tabularnewline
37 & 0.072939 & 0.7147 & 0.238278 \tabularnewline
38 & -0.09549 & -0.9356 & 0.175912 \tabularnewline
39 & 0.109815 & 1.076 & 0.142321 \tabularnewline
40 & -0.017122 & -0.1678 & 0.433564 \tabularnewline
41 & 0.021829 & 0.2139 & 0.415547 \tabularnewline
42 & 0.00775 & 0.0759 & 0.469815 \tabularnewline
43 & -0.008071 & -0.0791 & 0.468567 \tabularnewline
44 & -0.015191 & -0.1488 & 0.440995 \tabularnewline
45 & 0.009309 & 0.0912 & 0.463758 \tabularnewline
46 & -0.035726 & -0.35 & 0.363535 \tabularnewline
47 & -0.04678 & -0.4584 & 0.323867 \tabularnewline
48 & -0.115537 & -1.132 & 0.130221 \tabularnewline
\hline
\end{tabular}
%Source: https://freestatistics.org/blog/index.php?pk=301588&T=2

[TABLE]
[ROW][C]Partial Autocorrelation Function[/C][/ROW]
[ROW][C]Time lag k[/C][C]PACF(k)[/C][C]T-STAT[/C][C]P-value[/C][/ROW]
[ROW][C]1[/C][C]0.000845[/C][C]0.0083[/C][C]0.496705[/C][/ROW]
[ROW][C]2[/C][C]-0.393116[/C][C]-3.8517[/C][C]0.000106[/C][/ROW]
[ROW][C]3[/C][C]0.109118[/C][C]1.0691[/C][C]0.143846[/C][/ROW]
[ROW][C]4[/C][C]0.149533[/C][C]1.4651[/C][C]0.073078[/C][/ROW]
[ROW][C]5[/C][C]0.030714[/C][C]0.3009[/C][C]0.382058[/C][/ROW]
[ROW][C]6[/C][C]0.216891[/C][C]2.1251[/C][C]0.018073[/C][/ROW]
[ROW][C]7[/C][C]0.083536[/C][C]0.8185[/C][C]0.207555[/C][/ROW]
[ROW][C]8[/C][C]-0.155064[/C][C]-1.5193[/C][C]0.065986[/C][/ROW]
[ROW][C]9[/C][C]0.104675[/C][C]1.0256[/C][C]0.153828[/C][/ROW]
[ROW][C]10[/C][C]0.225828[/C][C]2.2127[/C][C]0.014646[/C][/ROW]
[ROW][C]11[/C][C]-0.125893[/C][C]-1.2335[/C][C]0.110201[/C][/ROW]
[ROW][C]12[/C][C]-0.416116[/C][C]-4.0771[/C][C]4.7e-05[/C][/ROW]
[ROW][C]13[/C][C]0.087326[/C][C]0.8556[/C][C]0.19717[/C][/ROW]
[ROW][C]14[/C][C]0.017638[/C][C]0.1728[/C][C]0.431579[/C][/ROW]
[ROW][C]15[/C][C]-0.020659[/C][C]-0.2024[/C][C]0.420011[/C][/ROW]
[ROW][C]16[/C][C]-0.034905[/C][C]-0.342[/C][C]0.366549[/C][/ROW]
[ROW][C]17[/C][C]-0.040631[/C][C]-0.3981[/C][C]0.345721[/C][/ROW]
[ROW][C]18[/C][C]0.039557[/C][C]0.3876[/C][C]0.349593[/C][/ROW]
[ROW][C]19[/C][C]0.02749[/C][C]0.2693[/C][C]0.394122[/C][/ROW]
[ROW][C]20[/C][C]-0.155659[/C][C]-1.5251[/C][C]0.065256[/C][/ROW]
[ROW][C]21[/C][C]0.106304[/C][C]1.0416[/C][C]0.150116[/C][/ROW]
[ROW][C]22[/C][C]0.025287[/C][C]0.2478[/C][C]0.402424[/C][/ROW]
[ROW][C]23[/C][C]0.071379[/C][C]0.6994[/C][C]0.243008[/C][/ROW]
[ROW][C]24[/C][C]-0.108128[/C][C]-1.0594[/C][C]0.146031[/C][/ROW]
[ROW][C]25[/C][C]-0.002443[/C][C]-0.0239[/C][C]0.490477[/C][/ROW]
[ROW][C]26[/C][C]-0.182039[/C][C]-1.7836[/C][C]0.038823[/C][/ROW]
[ROW][C]27[/C][C]0.021821[/C][C]0.2138[/C][C]0.415579[/C][/ROW]
[ROW][C]28[/C][C]0.079871[/C][C]0.7826[/C][C]0.217902[/C][/ROW]
[ROW][C]29[/C][C]0.00415[/C][C]0.0407[/C][C]0.483825[/C][/ROW]
[ROW][C]30[/C][C]0.035304[/C][C]0.3459[/C][C]0.365085[/C][/ROW]
[ROW][C]31[/C][C]-0.014065[/C][C]-0.1378[/C][C]0.445342[/C][/ROW]
[ROW][C]32[/C][C]-0.080481[/C][C]-0.7885[/C][C]0.21616[/C][/ROW]
[ROW][C]33[/C][C]0.05715[/C][C]0.56[/C][C]0.288408[/C][/ROW]
[ROW][C]34[/C][C]-0.009071[/C][C]-0.0889[/C][C]0.464684[/C][/ROW]
[ROW][C]35[/C][C]0.024313[/C][C]0.2382[/C][C]0.406109[/C][/ROW]
[ROW][C]36[/C][C]-0.118614[/C][C]-1.1622[/C][C]0.124023[/C][/ROW]
[ROW][C]37[/C][C]0.072939[/C][C]0.7147[/C][C]0.238278[/C][/ROW]
[ROW][C]38[/C][C]-0.09549[/C][C]-0.9356[/C][C]0.175912[/C][/ROW]
[ROW][C]39[/C][C]0.109815[/C][C]1.076[/C][C]0.142321[/C][/ROW]
[ROW][C]40[/C][C]-0.017122[/C][C]-0.1678[/C][C]0.433564[/C][/ROW]
[ROW][C]41[/C][C]0.021829[/C][C]0.2139[/C][C]0.415547[/C][/ROW]
[ROW][C]42[/C][C]0.00775[/C][C]0.0759[/C][C]0.469815[/C][/ROW]
[ROW][C]43[/C][C]-0.008071[/C][C]-0.0791[/C][C]0.468567[/C][/ROW]
[ROW][C]44[/C][C]-0.015191[/C][C]-0.1488[/C][C]0.440995[/C][/ROW]
[ROW][C]45[/C][C]0.009309[/C][C]0.0912[/C][C]0.463758[/C][/ROW]
[ROW][C]46[/C][C]-0.035726[/C][C]-0.35[/C][C]0.363535[/C][/ROW]
[ROW][C]47[/C][C]-0.04678[/C][C]-0.4584[/C][C]0.323867[/C][/ROW]
[ROW][C]48[/C][C]-0.115537[/C][C]-1.132[/C][C]0.130221[/C][/ROW]
[/TABLE]
Source: https://freestatistics.org/blog/index.php?pk=301588&T=2

Globally Unique Identifier (entire table): ba.freestatistics.org/blog/index.php?pk=301588&T=2

As an alternative you can also use a QR Code:  

The GUIDs for individual cells are displayed in the table below:

Partial Autocorrelation Function
Time lag kPACF(k)T-STATP-value
10.0008450.00830.496705
2-0.393116-3.85170.000106
30.1091181.06910.143846
40.1495331.46510.073078
50.0307140.30090.382058
60.2168912.12510.018073
70.0835360.81850.207555
8-0.155064-1.51930.065986
90.1046751.02560.153828
100.2258282.21270.014646
11-0.125893-1.23350.110201
12-0.416116-4.07714.7e-05
130.0873260.85560.19717
140.0176380.17280.431579
15-0.020659-0.20240.420011
16-0.034905-0.3420.366549
17-0.040631-0.39810.345721
180.0395570.38760.349593
190.027490.26930.394122
20-0.155659-1.52510.065256
210.1063041.04160.150116
220.0252870.24780.402424
230.0713790.69940.243008
24-0.108128-1.05940.146031
25-0.002443-0.02390.490477
26-0.182039-1.78360.038823
270.0218210.21380.415579
280.0798710.78260.217902
290.004150.04070.483825
300.0353040.34590.365085
31-0.014065-0.13780.445342
32-0.080481-0.78850.21616
330.057150.560.288408
34-0.009071-0.08890.464684
350.0243130.23820.406109
36-0.118614-1.16220.124023
370.0729390.71470.238278
38-0.09549-0.93560.175912
390.1098151.0760.142321
40-0.017122-0.16780.433564
410.0218290.21390.415547
420.007750.07590.469815
43-0.008071-0.07910.468567
44-0.015191-0.14880.440995
450.0093090.09120.463758
46-0.035726-0.350.363535
47-0.04678-0.45840.323867
48-0.115537-1.1320.130221


Parameters (Session):
par1 = Default ; par2 = 0.1 ; par3 = 0 ; par4 = 0 ; par5 = 12 ; par6 = White Noise ; par7 = 0.95 ;
Parameters (R input):
par1 = 48 ; par2 = 0.1 ; par3 = 0 ; par4 = 1 ; par5 = 12 ; par6 = White Noise ; par7 = 0.95 ; par8 = ;
R code (references can be found in the software module):
if (par1 == 'Default') {
par1 = 10*log10(length(x))
} else {
par1 <- as.numeric(par1)
}
par2 <- as.numeric(par2)
par3 <- as.numeric(par3)
par4 <- as.numeric(par4)
par5 <- as.numeric(par5)
if (par6 == 'White Noise') par6 <- 'white' else par6 <- 'ma'
par7 <- as.numeric(par7)
if (par8 != '') par8 <- as.numeric(par8)
x <- na.omit(x)
ox <- x
if (par8 == '') {
if (par2 == 0) {
x <- log(x)
} else {
x <- (x ^ par2 - 1) / par2
}
} else {
x <- log(x,base=par8)
}
if (par3 > 0) x <- diff(x,lag=1,difference=par3)
if (par4 > 0) x <- diff(x,lag=par5,difference=par4)
bitmap(file='picts.png')
op <- par(mfrow=c(2,1))
plot(ox,type='l',main='Original Time Series',xlab='time',ylab='value')
if (par8=='') {
mytitle <- paste('Working Time Series (lambda=',par2,', d=',par3,', D=',par4,')',sep='')
mysub <- paste('(lambda=',par2,', d=',par3,', D=',par4,', CI=', par7, ', CI type=',par6,')',sep='')
} else {
mytitle <- paste('Working Time Series (base=',par8,', d=',par3,', D=',par4,')',sep='')
mysub <- paste('(base=',par8,', d=',par3,', D=',par4,', CI=', par7, ', CI type=',par6,')',sep='')
}
plot(x,type='l', main=mytitle,xlab='time',ylab='value')
par(op)
dev.off()
bitmap(file='pic1.png')
racf <- acf(x, par1, main='Autocorrelation', xlab='time lag', ylab='ACF', ci.type=par6, ci=par7, sub=mysub)
dev.off()
bitmap(file='pic2.png')
rpacf <- pacf(x,par1,main='Partial Autocorrelation',xlab='lags',ylab='PACF',sub=mysub)
dev.off()
(myacf <- c(racf$acf))
(mypacf <- c(rpacf$acf))
lengthx <- length(x)
sqrtn <- sqrt(lengthx)
load(file='createtable')
a<-table.start()
a<-table.row.start(a)
a<-table.element(a,'Autocorrelation Function',4,TRUE)
a<-table.row.end(a)
a<-table.row.start(a)
a<-table.element(a,'Time lag k',header=TRUE)
a<-table.element(a,'ACF(k)',header=TRUE)
a<-table.element(a,'T-STAT',header=TRUE)
a<-table.element(a,'P-value',header=TRUE)
a<-table.row.end(a)
for (i in 2:(par1+1)) {
a<-table.row.start(a)
a<-table.element(a,i-1,header=TRUE)
a<-table.element(a,round(myacf[i],6))
mytstat <- myacf[i]*sqrtn
a<-table.element(a,round(mytstat,4))
a<-table.element(a,round(1-pt(abs(mytstat),lengthx),6))
a<-table.row.end(a)
}
a<-table.end(a)
table.save(a,file='mytable.tab')
a<-table.start()
a<-table.row.start(a)
a<-table.element(a,'Partial Autocorrelation Function',4,TRUE)
a<-table.row.end(a)
a<-table.row.start(a)
a<-table.element(a,'Time lag k',header=TRUE)
a<-table.element(a,'PACF(k)',header=TRUE)
a<-table.element(a,'T-STAT',header=TRUE)
a<-table.element(a,'P-value',header=TRUE)
a<-table.row.end(a)
for (i in 1:par1) {
a<-table.row.start(a)
a<-table.element(a,i,header=TRUE)
a<-table.element(a,round(mypacf[i],6))
mytstat <- mypacf[i]*sqrtn
a<-table.element(a,round(mytstat,4))
a<-table.element(a,round(1-pt(abs(mytstat),lengthx),6))
a<-table.row.end(a)
}
a<-table.end(a)
table.save(a,file='mytable1.tab')