Free Statistics

of Irreproducible Research!

Author's title

Author*The author of this computation has been verified*
R Software Modulerwasp_decompose.wasp
Title produced by softwareClassical Decomposition
Date of computationTue, 20 Dec 2016 11:46:04 +0100
Cite this page as followsStatistical Computations at FreeStatistics.org, Office for Research Development and Education, URL https://freestatistics.org/blog/index.php?v=date/2016/Dec/20/t1482230803ydo8a19lwg99794.htm/, Retrieved Sun, 28 Apr 2024 04:18:32 +0000
Statistical Computations at FreeStatistics.org, Office for Research Development and Education, URL https://freestatistics.org/blog/index.php?pk=301590, Retrieved Sun, 28 Apr 2024 04:18:32 +0000
QR Codes:

Original text written by user:
IsPrivate?No (this computation is public)
User-defined keywords
Estimated Impact73
Family? (F = Feedback message, R = changed R code, M = changed R Module, P = changed Parameters, D = changed Data)
-       [Classical Decomposition] [] [2016-12-20 10:46:04] [2e11ca31a00cf8de75c33c1af2d59434] [Current]
Feedback Forum

Post a new message
Dataseries X:
2298.3
2424.67
2584.65
2639.42
2452.02
2537.49
2726.36
2843.85
2615.11
2778.08
2918.75
3023.41
2733.07
2933.31
3089.19
3256.6
2968.74
3101.7
3277.21
3420.1
3097.55
3286.21
3491.96
3608.53
3259.04
3492.27
3665.64
3808.02
3397.47
3644.83
3812.8
3958.78
3602.73
3845.49
4022.27
4195.29
3867.28
4142.62
4217.79
4487.61
4089.69
4431.36
4629.82
4832.81


Summary of computational transaction
Raw Input view raw input (R code)
Raw Outputview raw output of R engine
Computing time2 seconds
R ServerBig Analytics Cloud Computing Center

\begin{tabular}{lllllllll}
\hline
Summary of computational transaction \tabularnewline
Raw Input view raw input (R code)  \tabularnewline
Raw Outputview raw output of R engine  \tabularnewline
Computing time2 seconds \tabularnewline
R ServerBig Analytics Cloud Computing Center \tabularnewline
\hline
\end{tabular}
%Source: https://freestatistics.org/blog/index.php?pk=301590&T=0

[TABLE]
[ROW]
Summary of computational transaction[/C][/ROW] [ROW]Raw Input[/C] view raw input (R code) [/C][/ROW] [ROW]Raw Output[/C]view raw output of R engine [/C][/ROW] [ROW]Computing time[/C]2 seconds[/C][/ROW] [ROW]R Server[/C]Big Analytics Cloud Computing Center[/C][/ROW] [/TABLE] Source: https://freestatistics.org/blog/index.php?pk=301590&T=0

Globally Unique Identifier (entire table): ba.freestatistics.org/blog/index.php?pk=301590&T=0

As an alternative you can also use a QR Code:  

The GUIDs for individual cells are displayed in the table below:

Summary of computational transaction
Raw Input view raw input (R code)
Raw Outputview raw output of R engine
Computing time2 seconds
R ServerBig Analytics Cloud Computing Center


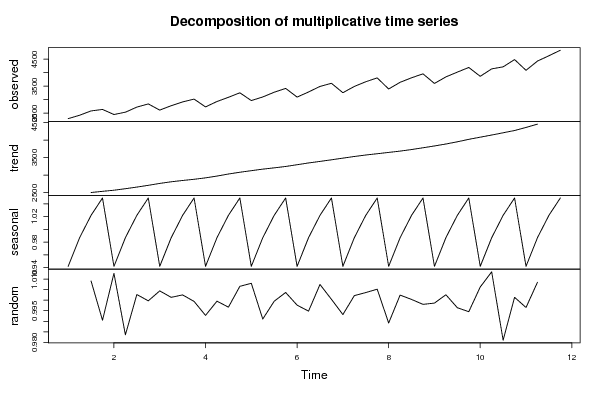
Classical Decomposition by Moving Averages
tObservationsFitTrendSeasonalRandom
12298.3NANA0.941682NA
22424.67NANA0.986822NA
32584.652561.312505.981.022081.00911
42639.422664.782539.291.049420.990485
52452.022421.172571.110.9416821.01274
62537.492579.932614.380.9868220.983552
72726.362719.052660.321.022081.00269
82843.852844.732710.781.049420.999689
92615.112603.652764.90.9416821.0044
102778.082774.352811.390.9868221.00135
112918.752911.482848.581.022081.0025
123023.413025.192882.731.049420.999413
132733.072752.952923.440.9416820.992779
142933.312934.712973.890.9868220.999525
153089.193099.463032.51.022080.996687
163256.63235.363083.011.049421.00656
172968.742945.173127.560.9416821.008
183101.73129.713171.50.9868220.991051
193277.213278.873208.041.022080.999494
203420.13407.673247.21.049421.00365
213097.553104.833297.110.9416820.997656
223286.213303.43347.510.9868220.994797
233491.963466.133391.251.022081.00745
243608.533607.053437.191.049421.00041
253259.043281.443484.660.9416820.993174
263492.273484.773531.310.9868221.00215
273665.643652.453573.551.022081.00361
283808.023788.313609.921.049421.0052
293397.473434.683647.380.9416820.989168
303644.833636.073684.620.9868221.00241
313812.83811.463729.131.022081.00035
323958.783966.663779.871.049420.998015
333602.733607.713831.130.9416820.99862
343845.493835.663886.880.9868221.00256
354022.274036.723949.511.022080.996421
364195.294218.364019.721.049420.99453
373867.283843.294081.30.9416821.00624
384142.624087.74142.280.9868221.01344
394217.794299.514206.631.022080.980994
404487.614481.554270.521.049421.00135
414089.694103.964358.120.9416820.996523
424431.364394.094452.770.9868221.00848
434629.82NANA1.02208NA
444832.81NANA1.04942NA

\begin{tabular}{lllllllll}
\hline
Classical Decomposition by Moving Averages \tabularnewline
t & Observations & Fit & Trend & Seasonal & Random \tabularnewline
1 & 2298.3 & NA & NA & 0.941682 & NA \tabularnewline
2 & 2424.67 & NA & NA & 0.986822 & NA \tabularnewline
3 & 2584.65 & 2561.31 & 2505.98 & 1.02208 & 1.00911 \tabularnewline
4 & 2639.42 & 2664.78 & 2539.29 & 1.04942 & 0.990485 \tabularnewline
5 & 2452.02 & 2421.17 & 2571.11 & 0.941682 & 1.01274 \tabularnewline
6 & 2537.49 & 2579.93 & 2614.38 & 0.986822 & 0.983552 \tabularnewline
7 & 2726.36 & 2719.05 & 2660.32 & 1.02208 & 1.00269 \tabularnewline
8 & 2843.85 & 2844.73 & 2710.78 & 1.04942 & 0.999689 \tabularnewline
9 & 2615.11 & 2603.65 & 2764.9 & 0.941682 & 1.0044 \tabularnewline
10 & 2778.08 & 2774.35 & 2811.39 & 0.986822 & 1.00135 \tabularnewline
11 & 2918.75 & 2911.48 & 2848.58 & 1.02208 & 1.0025 \tabularnewline
12 & 3023.41 & 3025.19 & 2882.73 & 1.04942 & 0.999413 \tabularnewline
13 & 2733.07 & 2752.95 & 2923.44 & 0.941682 & 0.992779 \tabularnewline
14 & 2933.31 & 2934.71 & 2973.89 & 0.986822 & 0.999525 \tabularnewline
15 & 3089.19 & 3099.46 & 3032.5 & 1.02208 & 0.996687 \tabularnewline
16 & 3256.6 & 3235.36 & 3083.01 & 1.04942 & 1.00656 \tabularnewline
17 & 2968.74 & 2945.17 & 3127.56 & 0.941682 & 1.008 \tabularnewline
18 & 3101.7 & 3129.71 & 3171.5 & 0.986822 & 0.991051 \tabularnewline
19 & 3277.21 & 3278.87 & 3208.04 & 1.02208 & 0.999494 \tabularnewline
20 & 3420.1 & 3407.67 & 3247.2 & 1.04942 & 1.00365 \tabularnewline
21 & 3097.55 & 3104.83 & 3297.11 & 0.941682 & 0.997656 \tabularnewline
22 & 3286.21 & 3303.4 & 3347.51 & 0.986822 & 0.994797 \tabularnewline
23 & 3491.96 & 3466.13 & 3391.25 & 1.02208 & 1.00745 \tabularnewline
24 & 3608.53 & 3607.05 & 3437.19 & 1.04942 & 1.00041 \tabularnewline
25 & 3259.04 & 3281.44 & 3484.66 & 0.941682 & 0.993174 \tabularnewline
26 & 3492.27 & 3484.77 & 3531.31 & 0.986822 & 1.00215 \tabularnewline
27 & 3665.64 & 3652.45 & 3573.55 & 1.02208 & 1.00361 \tabularnewline
28 & 3808.02 & 3788.31 & 3609.92 & 1.04942 & 1.0052 \tabularnewline
29 & 3397.47 & 3434.68 & 3647.38 & 0.941682 & 0.989168 \tabularnewline
30 & 3644.83 & 3636.07 & 3684.62 & 0.986822 & 1.00241 \tabularnewline
31 & 3812.8 & 3811.46 & 3729.13 & 1.02208 & 1.00035 \tabularnewline
32 & 3958.78 & 3966.66 & 3779.87 & 1.04942 & 0.998015 \tabularnewline
33 & 3602.73 & 3607.71 & 3831.13 & 0.941682 & 0.99862 \tabularnewline
34 & 3845.49 & 3835.66 & 3886.88 & 0.986822 & 1.00256 \tabularnewline
35 & 4022.27 & 4036.72 & 3949.51 & 1.02208 & 0.996421 \tabularnewline
36 & 4195.29 & 4218.36 & 4019.72 & 1.04942 & 0.99453 \tabularnewline
37 & 3867.28 & 3843.29 & 4081.3 & 0.941682 & 1.00624 \tabularnewline
38 & 4142.62 & 4087.7 & 4142.28 & 0.986822 & 1.01344 \tabularnewline
39 & 4217.79 & 4299.51 & 4206.63 & 1.02208 & 0.980994 \tabularnewline
40 & 4487.61 & 4481.55 & 4270.52 & 1.04942 & 1.00135 \tabularnewline
41 & 4089.69 & 4103.96 & 4358.12 & 0.941682 & 0.996523 \tabularnewline
42 & 4431.36 & 4394.09 & 4452.77 & 0.986822 & 1.00848 \tabularnewline
43 & 4629.82 & NA & NA & 1.02208 & NA \tabularnewline
44 & 4832.81 & NA & NA & 1.04942 & NA \tabularnewline
\hline
\end{tabular}
%Source: https://freestatistics.org/blog/index.php?pk=301590&T=1

[TABLE]
[ROW][C]Classical Decomposition by Moving Averages[/C][/ROW]
[ROW][C]t[/C][C]Observations[/C][C]Fit[/C][C]Trend[/C][C]Seasonal[/C][C]Random[/C][/ROW]
[ROW][C]1[/C][C]2298.3[/C][C]NA[/C][C]NA[/C][C]0.941682[/C][C]NA[/C][/ROW]
[ROW][C]2[/C][C]2424.67[/C][C]NA[/C][C]NA[/C][C]0.986822[/C][C]NA[/C][/ROW]
[ROW][C]3[/C][C]2584.65[/C][C]2561.31[/C][C]2505.98[/C][C]1.02208[/C][C]1.00911[/C][/ROW]
[ROW][C]4[/C][C]2639.42[/C][C]2664.78[/C][C]2539.29[/C][C]1.04942[/C][C]0.990485[/C][/ROW]
[ROW][C]5[/C][C]2452.02[/C][C]2421.17[/C][C]2571.11[/C][C]0.941682[/C][C]1.01274[/C][/ROW]
[ROW][C]6[/C][C]2537.49[/C][C]2579.93[/C][C]2614.38[/C][C]0.986822[/C][C]0.983552[/C][/ROW]
[ROW][C]7[/C][C]2726.36[/C][C]2719.05[/C][C]2660.32[/C][C]1.02208[/C][C]1.00269[/C][/ROW]
[ROW][C]8[/C][C]2843.85[/C][C]2844.73[/C][C]2710.78[/C][C]1.04942[/C][C]0.999689[/C][/ROW]
[ROW][C]9[/C][C]2615.11[/C][C]2603.65[/C][C]2764.9[/C][C]0.941682[/C][C]1.0044[/C][/ROW]
[ROW][C]10[/C][C]2778.08[/C][C]2774.35[/C][C]2811.39[/C][C]0.986822[/C][C]1.00135[/C][/ROW]
[ROW][C]11[/C][C]2918.75[/C][C]2911.48[/C][C]2848.58[/C][C]1.02208[/C][C]1.0025[/C][/ROW]
[ROW][C]12[/C][C]3023.41[/C][C]3025.19[/C][C]2882.73[/C][C]1.04942[/C][C]0.999413[/C][/ROW]
[ROW][C]13[/C][C]2733.07[/C][C]2752.95[/C][C]2923.44[/C][C]0.941682[/C][C]0.992779[/C][/ROW]
[ROW][C]14[/C][C]2933.31[/C][C]2934.71[/C][C]2973.89[/C][C]0.986822[/C][C]0.999525[/C][/ROW]
[ROW][C]15[/C][C]3089.19[/C][C]3099.46[/C][C]3032.5[/C][C]1.02208[/C][C]0.996687[/C][/ROW]
[ROW][C]16[/C][C]3256.6[/C][C]3235.36[/C][C]3083.01[/C][C]1.04942[/C][C]1.00656[/C][/ROW]
[ROW][C]17[/C][C]2968.74[/C][C]2945.17[/C][C]3127.56[/C][C]0.941682[/C][C]1.008[/C][/ROW]
[ROW][C]18[/C][C]3101.7[/C][C]3129.71[/C][C]3171.5[/C][C]0.986822[/C][C]0.991051[/C][/ROW]
[ROW][C]19[/C][C]3277.21[/C][C]3278.87[/C][C]3208.04[/C][C]1.02208[/C][C]0.999494[/C][/ROW]
[ROW][C]20[/C][C]3420.1[/C][C]3407.67[/C][C]3247.2[/C][C]1.04942[/C][C]1.00365[/C][/ROW]
[ROW][C]21[/C][C]3097.55[/C][C]3104.83[/C][C]3297.11[/C][C]0.941682[/C][C]0.997656[/C][/ROW]
[ROW][C]22[/C][C]3286.21[/C][C]3303.4[/C][C]3347.51[/C][C]0.986822[/C][C]0.994797[/C][/ROW]
[ROW][C]23[/C][C]3491.96[/C][C]3466.13[/C][C]3391.25[/C][C]1.02208[/C][C]1.00745[/C][/ROW]
[ROW][C]24[/C][C]3608.53[/C][C]3607.05[/C][C]3437.19[/C][C]1.04942[/C][C]1.00041[/C][/ROW]
[ROW][C]25[/C][C]3259.04[/C][C]3281.44[/C][C]3484.66[/C][C]0.941682[/C][C]0.993174[/C][/ROW]
[ROW][C]26[/C][C]3492.27[/C][C]3484.77[/C][C]3531.31[/C][C]0.986822[/C][C]1.00215[/C][/ROW]
[ROW][C]27[/C][C]3665.64[/C][C]3652.45[/C][C]3573.55[/C][C]1.02208[/C][C]1.00361[/C][/ROW]
[ROW][C]28[/C][C]3808.02[/C][C]3788.31[/C][C]3609.92[/C][C]1.04942[/C][C]1.0052[/C][/ROW]
[ROW][C]29[/C][C]3397.47[/C][C]3434.68[/C][C]3647.38[/C][C]0.941682[/C][C]0.989168[/C][/ROW]
[ROW][C]30[/C][C]3644.83[/C][C]3636.07[/C][C]3684.62[/C][C]0.986822[/C][C]1.00241[/C][/ROW]
[ROW][C]31[/C][C]3812.8[/C][C]3811.46[/C][C]3729.13[/C][C]1.02208[/C][C]1.00035[/C][/ROW]
[ROW][C]32[/C][C]3958.78[/C][C]3966.66[/C][C]3779.87[/C][C]1.04942[/C][C]0.998015[/C][/ROW]
[ROW][C]33[/C][C]3602.73[/C][C]3607.71[/C][C]3831.13[/C][C]0.941682[/C][C]0.99862[/C][/ROW]
[ROW][C]34[/C][C]3845.49[/C][C]3835.66[/C][C]3886.88[/C][C]0.986822[/C][C]1.00256[/C][/ROW]
[ROW][C]35[/C][C]4022.27[/C][C]4036.72[/C][C]3949.51[/C][C]1.02208[/C][C]0.996421[/C][/ROW]
[ROW][C]36[/C][C]4195.29[/C][C]4218.36[/C][C]4019.72[/C][C]1.04942[/C][C]0.99453[/C][/ROW]
[ROW][C]37[/C][C]3867.28[/C][C]3843.29[/C][C]4081.3[/C][C]0.941682[/C][C]1.00624[/C][/ROW]
[ROW][C]38[/C][C]4142.62[/C][C]4087.7[/C][C]4142.28[/C][C]0.986822[/C][C]1.01344[/C][/ROW]
[ROW][C]39[/C][C]4217.79[/C][C]4299.51[/C][C]4206.63[/C][C]1.02208[/C][C]0.980994[/C][/ROW]
[ROW][C]40[/C][C]4487.61[/C][C]4481.55[/C][C]4270.52[/C][C]1.04942[/C][C]1.00135[/C][/ROW]
[ROW][C]41[/C][C]4089.69[/C][C]4103.96[/C][C]4358.12[/C][C]0.941682[/C][C]0.996523[/C][/ROW]
[ROW][C]42[/C][C]4431.36[/C][C]4394.09[/C][C]4452.77[/C][C]0.986822[/C][C]1.00848[/C][/ROW]
[ROW][C]43[/C][C]4629.82[/C][C]NA[/C][C]NA[/C][C]1.02208[/C][C]NA[/C][/ROW]
[ROW][C]44[/C][C]4832.81[/C][C]NA[/C][C]NA[/C][C]1.04942[/C][C]NA[/C][/ROW]
[/TABLE]
Source: https://freestatistics.org/blog/index.php?pk=301590&T=1

Globally Unique Identifier (entire table): ba.freestatistics.org/blog/index.php?pk=301590&T=1

As an alternative you can also use a QR Code:  

The GUIDs for individual cells are displayed in the table below:

Classical Decomposition by Moving Averages
tObservationsFitTrendSeasonalRandom
12298.3NANA0.941682NA
22424.67NANA0.986822NA
32584.652561.312505.981.022081.00911
42639.422664.782539.291.049420.990485
52452.022421.172571.110.9416821.01274
62537.492579.932614.380.9868220.983552
72726.362719.052660.321.022081.00269
82843.852844.732710.781.049420.999689
92615.112603.652764.90.9416821.0044
102778.082774.352811.390.9868221.00135
112918.752911.482848.581.022081.0025
123023.413025.192882.731.049420.999413
132733.072752.952923.440.9416820.992779
142933.312934.712973.890.9868220.999525
153089.193099.463032.51.022080.996687
163256.63235.363083.011.049421.00656
172968.742945.173127.560.9416821.008
183101.73129.713171.50.9868220.991051
193277.213278.873208.041.022080.999494
203420.13407.673247.21.049421.00365
213097.553104.833297.110.9416820.997656
223286.213303.43347.510.9868220.994797
233491.963466.133391.251.022081.00745
243608.533607.053437.191.049421.00041
253259.043281.443484.660.9416820.993174
263492.273484.773531.310.9868221.00215
273665.643652.453573.551.022081.00361
283808.023788.313609.921.049421.0052
293397.473434.683647.380.9416820.989168
303644.833636.073684.620.9868221.00241
313812.83811.463729.131.022081.00035
323958.783966.663779.871.049420.998015
333602.733607.713831.130.9416820.99862
343845.493835.663886.880.9868221.00256
354022.274036.723949.511.022080.996421
364195.294218.364019.721.049420.99453
373867.283843.294081.30.9416821.00624
384142.624087.74142.280.9868221.01344
394217.794299.514206.631.022080.980994
404487.614481.554270.521.049421.00135
414089.694103.964358.120.9416820.996523
424431.364394.094452.770.9868221.00848
434629.82NANA1.02208NA
444832.81NANA1.04942NA


Parameters (Session):
par1 = multiplicative ; par2 = 4 ;
Parameters (R input):
par1 = multiplicative ; par2 = 4 ;
R code (references can be found in the software module):
par2 <- as.numeric(par2)
x <- ts(x,freq=par2)
m <- decompose(x,type=par1)
m$figure
bitmap(file='test1.png')
plot(m)
dev.off()
mylagmax <- length(x)/2
bitmap(file='test2.png')
op <- par(mfrow = c(2,2))
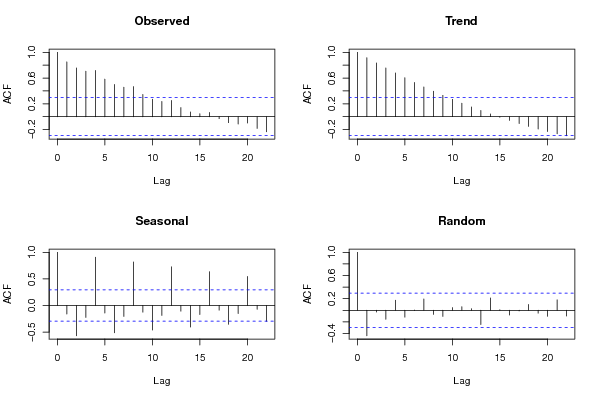
acf(as.numeric(x),lag.max = mylagmax,main='Observed')
acf(as.numeric(m$trend),na.action=na.pass,lag.max = mylagmax,main='Trend')
acf(as.numeric(m$seasonal),na.action=na.pass,lag.max = mylagmax,main='Seasonal')
acf(as.numeric(m$random),na.action=na.pass,lag.max = mylagmax,main='Random')
par(op)
dev.off()
bitmap(file='test3.png')
op <- par(mfrow = c(2,2))
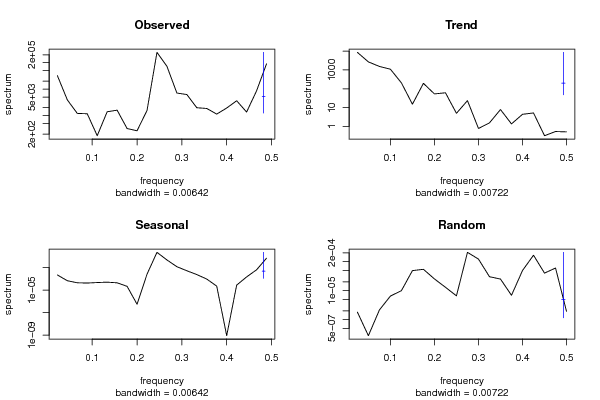
spectrum(as.numeric(x),main='Observed')
spectrum(as.numeric(m$trend[!is.na(m$trend)]),main='Trend')
spectrum(as.numeric(m$seasonal[!is.na(m$seasonal)]),main='Seasonal')
spectrum(as.numeric(m$random[!is.na(m$random)]),main='Random')
par(op)
dev.off()
bitmap(file='test4.png')
op <- par(mfrow = c(2,2))
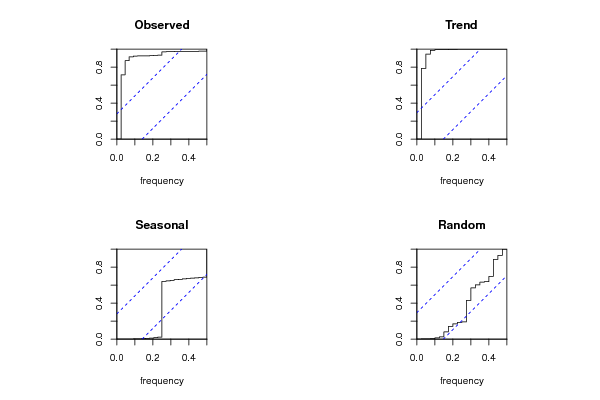
cpgram(as.numeric(x),main='Observed')
cpgram(as.numeric(m$trend[!is.na(m$trend)]),main='Trend')
cpgram(as.numeric(m$seasonal[!is.na(m$seasonal)]),main='Seasonal')
cpgram(as.numeric(m$random[!is.na(m$random)]),main='Random')
par(op)
dev.off()
load(file='createtable')
a<-table.start()
a<-table.row.start(a)
a<-table.element(a,'Classical Decomposition by Moving Averages',6,TRUE)
a<-table.row.end(a)
a<-table.row.start(a)
a<-table.element(a,'t',header=TRUE)
a<-table.element(a,'Observations',header=TRUE)
a<-table.element(a,'Fit',header=TRUE)
a<-table.element(a,'Trend',header=TRUE)
a<-table.element(a,'Seasonal',header=TRUE)
a<-table.element(a,'Random',header=TRUE)
a<-table.row.end(a)
for (i in 1:length(m$trend)) {
a<-table.row.start(a)
a<-table.element(a,i,header=TRUE)
a<-table.element(a,x[i])
if (par1 == 'additive') a<-table.element(a,signif(m$trend[i]+m$seasonal[i],6)) else a<-table.element(a,signif(m$trend[i]*m$seasonal[i],6))
a<-table.element(a,signif(m$trend[i],6))
a<-table.element(a,signif(m$seasonal[i],6))
a<-table.element(a,signif(m$random[i],6))
a<-table.row.end(a)
}
a<-table.end(a)
table.save(a,file='mytable.tab')