Free Statistics

of Irreproducible Research!

Author's title

Author*The author of this computation has been verified*
R Software Modulerwasp_autocorrelation.wasp
Title produced by software(Partial) Autocorrelation Function
Date of computationTue, 20 Dec 2016 12:00:25 +0100
Cite this page as followsStatistical Computations at FreeStatistics.org, Office for Research Development and Education, URL https://freestatistics.org/blog/index.php?v=date/2016/Dec/20/t1482231651ug5vwhcnx3rt17i.htm/, Retrieved Sat, 27 Apr 2024 17:47:08 +0000
Statistical Computations at FreeStatistics.org, Office for Research Development and Education, URL https://freestatistics.org/blog/index.php?pk=301603, Retrieved Sat, 27 Apr 2024 17:47:08 +0000
QR Codes:

Original text written by user:
IsPrivate?No (this computation is public)
User-defined keywords
Estimated Impact69
Family? (F = Feedback message, R = changed R code, M = changed R Module, P = changed Parameters, D = changed Data)
-       [(Partial) Autocorrelation Function] [] [2016-12-20 11:00:25] [b2e25925e4919b0d6985405fcb461c0d] [Current]
Feedback Forum

Post a new message
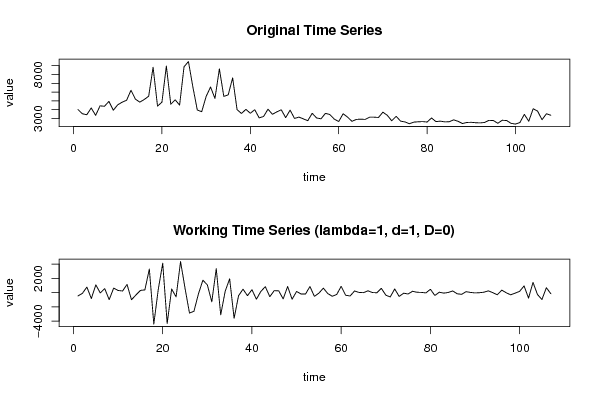
Dataseries X:
4020
3540
3430
4200
3360
4440
4390
4940
3940
4560
4850
5070
6210
5200
4860
5160
5530
8830
4410
4850
8960
4620
5120
4520
8870
9470
6590
3970
3770
5500
6580
5280
8640
5510
5690
7620
4010
3570
4040
3600
4000
3070
3230
4060
3480
3750
3990
3100
3950
3010
3160
2960
2750
3590
3060
2970
3590
3450
2930
2660
3540
3160
2680
2900
2920
2900
3150
3150
3120
3720
3360
2740
3250
2700
2610
2410
2590
2630
2650
2600
3060
2650
2700
2620
2630
2850
2680
2430
2550
2570
2520
2500
2550
2790
2770
2460
2800
2770
2450
2370
2540
3470
2690
4110
3840
2860
3540
3370


Summary of computational transaction
Raw Input view raw input (R code)
Raw Outputview raw output of R engine
Computing time2 seconds
R ServerBig Analytics Cloud Computing Center

\begin{tabular}{lllllllll}
\hline
Summary of computational transaction \tabularnewline
Raw Input view raw input (R code)  \tabularnewline
Raw Outputview raw output of R engine  \tabularnewline
Computing time2 seconds \tabularnewline
R ServerBig Analytics Cloud Computing Center \tabularnewline
\hline
\end{tabular}
%Source: https://freestatistics.org/blog/index.php?pk=301603&T=0

[TABLE]
[ROW]
Summary of computational transaction[/C][/ROW] [ROW]Raw Input[/C] view raw input (R code) [/C][/ROW] [ROW]Raw Output[/C]view raw output of R engine [/C][/ROW] [ROW]Computing time[/C]2 seconds[/C][/ROW] [ROW]R Server[/C]Big Analytics Cloud Computing Center[/C][/ROW] [/TABLE] Source: https://freestatistics.org/blog/index.php?pk=301603&T=0

Globally Unique Identifier (entire table): ba.freestatistics.org/blog/index.php?pk=301603&T=0

As an alternative you can also use a QR Code:  

The GUIDs for individual cells are displayed in the table below:

Summary of computational transaction
Raw Input view raw input (R code)
Raw Outputview raw output of R engine
Computing time2 seconds
R ServerBig Analytics Cloud Computing Center


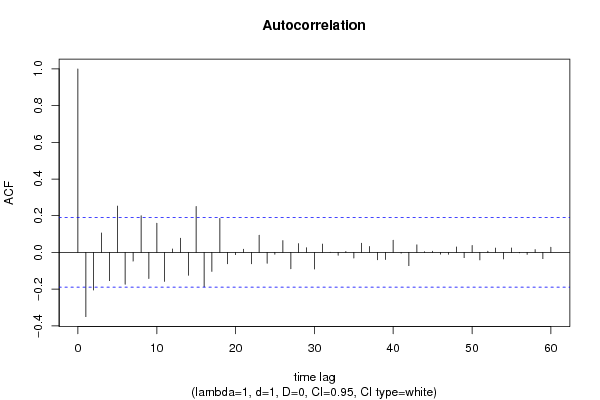
Autocorrelation Function
Time lag kACF(k)T-STATP-value
1-0.35026-3.62310.000223
2-0.205114-2.12170.018085
30.1059811.09630.13771
4-0.153974-1.59270.057087
50.2523172.610.005176
6-0.173477-1.79450.037782
7-0.047439-0.49070.312319
80.1998922.06770.02054
9-0.142068-1.46960.072307
100.1592441.64720.051222
11-0.15808-1.63520.052474
120.0186760.19320.42359
130.0772730.79930.212939
14-0.125033-1.29340.099337
150.2505032.59120.005449
16-0.187712-1.94170.027401
17-0.103633-1.0720.143068
180.184711.91070.029363
19-0.062165-0.6430.260788
20-0.012165-0.12580.450048
210.0176190.18230.427865
22-0.06206-0.64190.26114
230.0933170.96530.16829
24-0.059647-0.6170.269276
25-0.010326-0.10680.45757
260.0642020.66410.254024
27-0.088893-0.91950.179947
280.0480170.49670.310214
290.0257210.26610.395351
30-0.090826-0.93950.174793
310.0451870.46740.320577
320.000440.00460.498189
33-0.015162-0.15680.437835
340.0049550.05130.479609
35-0.030937-0.320.374792
360.0499750.51690.303131
370.0320950.3320.370271
38-0.040134-0.41510.339432
39-0.038403-0.39720.345991
400.0662820.68560.247216
41-0.004082-0.04220.4832
42-0.072349-0.74840.227935
430.0409310.42340.336431
440.0034970.03620.485604
450.0065440.06770.473077
46-0.0094-0.09720.46136
47-0.009794-0.10130.459746
480.0296980.30720.379643
49-0.028502-0.29480.384349
500.037890.39190.347943
51-0.040665-0.42060.337432
520.0064410.06660.473503
530.0232680.24070.405129
54-0.035305-0.36520.357842
550.0239760.2480.4023
56-0.002486-0.02570.489768
57-0.010879-0.11250.455306
580.015260.15790.437436
59-0.034007-0.35180.362852
600.027950.28910.386525

\begin{tabular}{lllllllll}
\hline
Autocorrelation Function \tabularnewline
Time lag k & ACF(k) & T-STAT & P-value \tabularnewline
1 & -0.35026 & -3.6231 & 0.000223 \tabularnewline
2 & -0.205114 & -2.1217 & 0.018085 \tabularnewline
3 & 0.105981 & 1.0963 & 0.13771 \tabularnewline
4 & -0.153974 & -1.5927 & 0.057087 \tabularnewline
5 & 0.252317 & 2.61 & 0.005176 \tabularnewline
6 & -0.173477 & -1.7945 & 0.037782 \tabularnewline
7 & -0.047439 & -0.4907 & 0.312319 \tabularnewline
8 & 0.199892 & 2.0677 & 0.02054 \tabularnewline
9 & -0.142068 & -1.4696 & 0.072307 \tabularnewline
10 & 0.159244 & 1.6472 & 0.051222 \tabularnewline
11 & -0.15808 & -1.6352 & 0.052474 \tabularnewline
12 & 0.018676 & 0.1932 & 0.42359 \tabularnewline
13 & 0.077273 & 0.7993 & 0.212939 \tabularnewline
14 & -0.125033 & -1.2934 & 0.099337 \tabularnewline
15 & 0.250503 & 2.5912 & 0.005449 \tabularnewline
16 & -0.187712 & -1.9417 & 0.027401 \tabularnewline
17 & -0.103633 & -1.072 & 0.143068 \tabularnewline
18 & 0.18471 & 1.9107 & 0.029363 \tabularnewline
19 & -0.062165 & -0.643 & 0.260788 \tabularnewline
20 & -0.012165 & -0.1258 & 0.450048 \tabularnewline
21 & 0.017619 & 0.1823 & 0.427865 \tabularnewline
22 & -0.06206 & -0.6419 & 0.26114 \tabularnewline
23 & 0.093317 & 0.9653 & 0.16829 \tabularnewline
24 & -0.059647 & -0.617 & 0.269276 \tabularnewline
25 & -0.010326 & -0.1068 & 0.45757 \tabularnewline
26 & 0.064202 & 0.6641 & 0.254024 \tabularnewline
27 & -0.088893 & -0.9195 & 0.179947 \tabularnewline
28 & 0.048017 & 0.4967 & 0.310214 \tabularnewline
29 & 0.025721 & 0.2661 & 0.395351 \tabularnewline
30 & -0.090826 & -0.9395 & 0.174793 \tabularnewline
31 & 0.045187 & 0.4674 & 0.320577 \tabularnewline
32 & 0.00044 & 0.0046 & 0.498189 \tabularnewline
33 & -0.015162 & -0.1568 & 0.437835 \tabularnewline
34 & 0.004955 & 0.0513 & 0.479609 \tabularnewline
35 & -0.030937 & -0.32 & 0.374792 \tabularnewline
36 & 0.049975 & 0.5169 & 0.303131 \tabularnewline
37 & 0.032095 & 0.332 & 0.370271 \tabularnewline
38 & -0.040134 & -0.4151 & 0.339432 \tabularnewline
39 & -0.038403 & -0.3972 & 0.345991 \tabularnewline
40 & 0.066282 & 0.6856 & 0.247216 \tabularnewline
41 & -0.004082 & -0.0422 & 0.4832 \tabularnewline
42 & -0.072349 & -0.7484 & 0.227935 \tabularnewline
43 & 0.040931 & 0.4234 & 0.336431 \tabularnewline
44 & 0.003497 & 0.0362 & 0.485604 \tabularnewline
45 & 0.006544 & 0.0677 & 0.473077 \tabularnewline
46 & -0.0094 & -0.0972 & 0.46136 \tabularnewline
47 & -0.009794 & -0.1013 & 0.459746 \tabularnewline
48 & 0.029698 & 0.3072 & 0.379643 \tabularnewline
49 & -0.028502 & -0.2948 & 0.384349 \tabularnewline
50 & 0.03789 & 0.3919 & 0.347943 \tabularnewline
51 & -0.040665 & -0.4206 & 0.337432 \tabularnewline
52 & 0.006441 & 0.0666 & 0.473503 \tabularnewline
53 & 0.023268 & 0.2407 & 0.405129 \tabularnewline
54 & -0.035305 & -0.3652 & 0.357842 \tabularnewline
55 & 0.023976 & 0.248 & 0.4023 \tabularnewline
56 & -0.002486 & -0.0257 & 0.489768 \tabularnewline
57 & -0.010879 & -0.1125 & 0.455306 \tabularnewline
58 & 0.01526 & 0.1579 & 0.437436 \tabularnewline
59 & -0.034007 & -0.3518 & 0.362852 \tabularnewline
60 & 0.02795 & 0.2891 & 0.386525 \tabularnewline
\hline
\end{tabular}
%Source: https://freestatistics.org/blog/index.php?pk=301603&T=1

[TABLE]
[ROW][C]Autocorrelation Function[/C][/ROW]
[ROW][C]Time lag k[/C][C]ACF(k)[/C][C]T-STAT[/C][C]P-value[/C][/ROW]
[ROW][C]1[/C][C]-0.35026[/C][C]-3.6231[/C][C]0.000223[/C][/ROW]
[ROW][C]2[/C][C]-0.205114[/C][C]-2.1217[/C][C]0.018085[/C][/ROW]
[ROW][C]3[/C][C]0.105981[/C][C]1.0963[/C][C]0.13771[/C][/ROW]
[ROW][C]4[/C][C]-0.153974[/C][C]-1.5927[/C][C]0.057087[/C][/ROW]
[ROW][C]5[/C][C]0.252317[/C][C]2.61[/C][C]0.005176[/C][/ROW]
[ROW][C]6[/C][C]-0.173477[/C][C]-1.7945[/C][C]0.037782[/C][/ROW]
[ROW][C]7[/C][C]-0.047439[/C][C]-0.4907[/C][C]0.312319[/C][/ROW]
[ROW][C]8[/C][C]0.199892[/C][C]2.0677[/C][C]0.02054[/C][/ROW]
[ROW][C]9[/C][C]-0.142068[/C][C]-1.4696[/C][C]0.072307[/C][/ROW]
[ROW][C]10[/C][C]0.159244[/C][C]1.6472[/C][C]0.051222[/C][/ROW]
[ROW][C]11[/C][C]-0.15808[/C][C]-1.6352[/C][C]0.052474[/C][/ROW]
[ROW][C]12[/C][C]0.018676[/C][C]0.1932[/C][C]0.42359[/C][/ROW]
[ROW][C]13[/C][C]0.077273[/C][C]0.7993[/C][C]0.212939[/C][/ROW]
[ROW][C]14[/C][C]-0.125033[/C][C]-1.2934[/C][C]0.099337[/C][/ROW]
[ROW][C]15[/C][C]0.250503[/C][C]2.5912[/C][C]0.005449[/C][/ROW]
[ROW][C]16[/C][C]-0.187712[/C][C]-1.9417[/C][C]0.027401[/C][/ROW]
[ROW][C]17[/C][C]-0.103633[/C][C]-1.072[/C][C]0.143068[/C][/ROW]
[ROW][C]18[/C][C]0.18471[/C][C]1.9107[/C][C]0.029363[/C][/ROW]
[ROW][C]19[/C][C]-0.062165[/C][C]-0.643[/C][C]0.260788[/C][/ROW]
[ROW][C]20[/C][C]-0.012165[/C][C]-0.1258[/C][C]0.450048[/C][/ROW]
[ROW][C]21[/C][C]0.017619[/C][C]0.1823[/C][C]0.427865[/C][/ROW]
[ROW][C]22[/C][C]-0.06206[/C][C]-0.6419[/C][C]0.26114[/C][/ROW]
[ROW][C]23[/C][C]0.093317[/C][C]0.9653[/C][C]0.16829[/C][/ROW]
[ROW][C]24[/C][C]-0.059647[/C][C]-0.617[/C][C]0.269276[/C][/ROW]
[ROW][C]25[/C][C]-0.010326[/C][C]-0.1068[/C][C]0.45757[/C][/ROW]
[ROW][C]26[/C][C]0.064202[/C][C]0.6641[/C][C]0.254024[/C][/ROW]
[ROW][C]27[/C][C]-0.088893[/C][C]-0.9195[/C][C]0.179947[/C][/ROW]
[ROW][C]28[/C][C]0.048017[/C][C]0.4967[/C][C]0.310214[/C][/ROW]
[ROW][C]29[/C][C]0.025721[/C][C]0.2661[/C][C]0.395351[/C][/ROW]
[ROW][C]30[/C][C]-0.090826[/C][C]-0.9395[/C][C]0.174793[/C][/ROW]
[ROW][C]31[/C][C]0.045187[/C][C]0.4674[/C][C]0.320577[/C][/ROW]
[ROW][C]32[/C][C]0.00044[/C][C]0.0046[/C][C]0.498189[/C][/ROW]
[ROW][C]33[/C][C]-0.015162[/C][C]-0.1568[/C][C]0.437835[/C][/ROW]
[ROW][C]34[/C][C]0.004955[/C][C]0.0513[/C][C]0.479609[/C][/ROW]
[ROW][C]35[/C][C]-0.030937[/C][C]-0.32[/C][C]0.374792[/C][/ROW]
[ROW][C]36[/C][C]0.049975[/C][C]0.5169[/C][C]0.303131[/C][/ROW]
[ROW][C]37[/C][C]0.032095[/C][C]0.332[/C][C]0.370271[/C][/ROW]
[ROW][C]38[/C][C]-0.040134[/C][C]-0.4151[/C][C]0.339432[/C][/ROW]
[ROW][C]39[/C][C]-0.038403[/C][C]-0.3972[/C][C]0.345991[/C][/ROW]
[ROW][C]40[/C][C]0.066282[/C][C]0.6856[/C][C]0.247216[/C][/ROW]
[ROW][C]41[/C][C]-0.004082[/C][C]-0.0422[/C][C]0.4832[/C][/ROW]
[ROW][C]42[/C][C]-0.072349[/C][C]-0.7484[/C][C]0.227935[/C][/ROW]
[ROW][C]43[/C][C]0.040931[/C][C]0.4234[/C][C]0.336431[/C][/ROW]
[ROW][C]44[/C][C]0.003497[/C][C]0.0362[/C][C]0.485604[/C][/ROW]
[ROW][C]45[/C][C]0.006544[/C][C]0.0677[/C][C]0.473077[/C][/ROW]
[ROW][C]46[/C][C]-0.0094[/C][C]-0.0972[/C][C]0.46136[/C][/ROW]
[ROW][C]47[/C][C]-0.009794[/C][C]-0.1013[/C][C]0.459746[/C][/ROW]
[ROW][C]48[/C][C]0.029698[/C][C]0.3072[/C][C]0.379643[/C][/ROW]
[ROW][C]49[/C][C]-0.028502[/C][C]-0.2948[/C][C]0.384349[/C][/ROW]
[ROW][C]50[/C][C]0.03789[/C][C]0.3919[/C][C]0.347943[/C][/ROW]
[ROW][C]51[/C][C]-0.040665[/C][C]-0.4206[/C][C]0.337432[/C][/ROW]
[ROW][C]52[/C][C]0.006441[/C][C]0.0666[/C][C]0.473503[/C][/ROW]
[ROW][C]53[/C][C]0.023268[/C][C]0.2407[/C][C]0.405129[/C][/ROW]
[ROW][C]54[/C][C]-0.035305[/C][C]-0.3652[/C][C]0.357842[/C][/ROW]
[ROW][C]55[/C][C]0.023976[/C][C]0.248[/C][C]0.4023[/C][/ROW]
[ROW][C]56[/C][C]-0.002486[/C][C]-0.0257[/C][C]0.489768[/C][/ROW]
[ROW][C]57[/C][C]-0.010879[/C][C]-0.1125[/C][C]0.455306[/C][/ROW]
[ROW][C]58[/C][C]0.01526[/C][C]0.1579[/C][C]0.437436[/C][/ROW]
[ROW][C]59[/C][C]-0.034007[/C][C]-0.3518[/C][C]0.362852[/C][/ROW]
[ROW][C]60[/C][C]0.02795[/C][C]0.2891[/C][C]0.386525[/C][/ROW]
[/TABLE]
Source: https://freestatistics.org/blog/index.php?pk=301603&T=1

Globally Unique Identifier (entire table): ba.freestatistics.org/blog/index.php?pk=301603&T=1

As an alternative you can also use a QR Code:  

The GUIDs for individual cells are displayed in the table below:

Autocorrelation Function
Time lag kACF(k)T-STATP-value
1-0.35026-3.62310.000223
2-0.205114-2.12170.018085
30.1059811.09630.13771
4-0.153974-1.59270.057087
50.2523172.610.005176
6-0.173477-1.79450.037782
7-0.047439-0.49070.312319
80.1998922.06770.02054
9-0.142068-1.46960.072307
100.1592441.64720.051222
11-0.15808-1.63520.052474
120.0186760.19320.42359
130.0772730.79930.212939
14-0.125033-1.29340.099337
150.2505032.59120.005449
16-0.187712-1.94170.027401
17-0.103633-1.0720.143068
180.184711.91070.029363
19-0.062165-0.6430.260788
20-0.012165-0.12580.450048
210.0176190.18230.427865
22-0.06206-0.64190.26114
230.0933170.96530.16829
24-0.059647-0.6170.269276
25-0.010326-0.10680.45757
260.0642020.66410.254024
27-0.088893-0.91950.179947
280.0480170.49670.310214
290.0257210.26610.395351
30-0.090826-0.93950.174793
310.0451870.46740.320577
320.000440.00460.498189
33-0.015162-0.15680.437835
340.0049550.05130.479609
35-0.030937-0.320.374792
360.0499750.51690.303131
370.0320950.3320.370271
38-0.040134-0.41510.339432
39-0.038403-0.39720.345991
400.0662820.68560.247216
41-0.004082-0.04220.4832
42-0.072349-0.74840.227935
430.0409310.42340.336431
440.0034970.03620.485604
450.0065440.06770.473077
46-0.0094-0.09720.46136
47-0.009794-0.10130.459746
480.0296980.30720.379643
49-0.028502-0.29480.384349
500.037890.39190.347943
51-0.040665-0.42060.337432
520.0064410.06660.473503
530.0232680.24070.405129
54-0.035305-0.36520.357842
550.0239760.2480.4023
56-0.002486-0.02570.489768
57-0.010879-0.11250.455306
580.015260.15790.437436
59-0.034007-0.35180.362852
600.027950.28910.386525


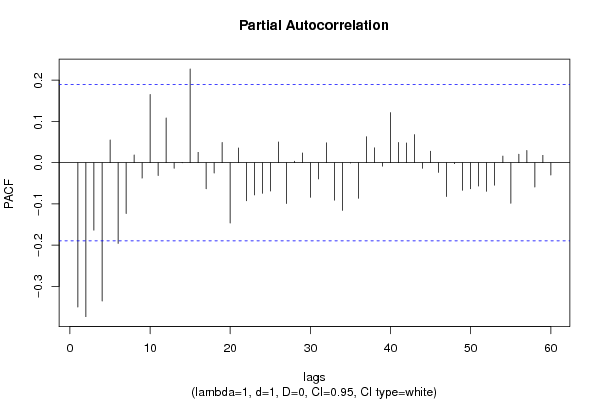
Partial Autocorrelation Function
Time lag kPACF(k)T-STATP-value
1-0.35026-3.62310.000223
2-0.373634-3.86499.5e-05
3-0.16371-1.69340.046642
4-0.335735-3.47290.000372
50.0550450.56940.285144
6-0.195858-2.0260.022628
7-0.123536-1.27790.102031
80.0185810.19220.423975
9-0.037461-0.38750.349578
100.1654191.71110.044979
11-0.031365-0.32440.373119
120.1084671.1220.132189
13-0.013608-0.14080.444162
140.0005740.00590.497636
150.2273962.35220.010246
160.0249880.25850.398267
17-0.063168-0.65340.257444
18-0.025202-0.26070.397414
190.0490880.50780.30633
20-0.146412-1.51450.066423
210.0354590.36680.357251
22-0.092241-0.95420.171079
23-0.078219-0.80910.210124
24-0.074368-0.76930.221714
25-0.068798-0.71160.239115
260.0502780.52010.302042
27-0.099238-1.02650.15348
280.0035660.03690.485323
290.0235780.24390.403891
30-0.084067-0.86960.193235
31-0.03929-0.40640.342622
320.0481020.49760.309904
33-0.09099-0.94120.17436
34-0.115875-1.19860.116662
35-0.000937-0.00970.496141
36-0.086399-0.89370.18674
370.0627120.64870.258961
380.035860.37090.355708
39-0.00838-0.08670.465542
400.1213591.25530.106044
410.0488380.50520.307236
420.0476180.49260.311665
430.0681170.70460.241293
44-0.013601-0.14070.44419
450.0276050.28560.387887
46-0.023515-0.24320.404142
47-0.081979-0.8480.199167
48-0.002407-0.02490.490089
49-0.066868-0.69170.245317
50-0.063122-0.65290.257599
51-0.056608-0.58560.279702
52-0.069257-0.71640.237652
53-0.054559-0.56440.286845
540.0159420.16490.434667
55-0.098386-1.01770.155556
560.0202920.20990.417073
570.0296260.30650.379929
58-0.059188-0.61220.270837
590.0177090.18320.427501
60-0.029955-0.30990.378636

\begin{tabular}{lllllllll}
\hline
Partial Autocorrelation Function \tabularnewline
Time lag k & PACF(k) & T-STAT & P-value \tabularnewline
1 & -0.35026 & -3.6231 & 0.000223 \tabularnewline
2 & -0.373634 & -3.8649 & 9.5e-05 \tabularnewline
3 & -0.16371 & -1.6934 & 0.046642 \tabularnewline
4 & -0.335735 & -3.4729 & 0.000372 \tabularnewline
5 & 0.055045 & 0.5694 & 0.285144 \tabularnewline
6 & -0.195858 & -2.026 & 0.022628 \tabularnewline
7 & -0.123536 & -1.2779 & 0.102031 \tabularnewline
8 & 0.018581 & 0.1922 & 0.423975 \tabularnewline
9 & -0.037461 & -0.3875 & 0.349578 \tabularnewline
10 & 0.165419 & 1.7111 & 0.044979 \tabularnewline
11 & -0.031365 & -0.3244 & 0.373119 \tabularnewline
12 & 0.108467 & 1.122 & 0.132189 \tabularnewline
13 & -0.013608 & -0.1408 & 0.444162 \tabularnewline
14 & 0.000574 & 0.0059 & 0.497636 \tabularnewline
15 & 0.227396 & 2.3522 & 0.010246 \tabularnewline
16 & 0.024988 & 0.2585 & 0.398267 \tabularnewline
17 & -0.063168 & -0.6534 & 0.257444 \tabularnewline
18 & -0.025202 & -0.2607 & 0.397414 \tabularnewline
19 & 0.049088 & 0.5078 & 0.30633 \tabularnewline
20 & -0.146412 & -1.5145 & 0.066423 \tabularnewline
21 & 0.035459 & 0.3668 & 0.357251 \tabularnewline
22 & -0.092241 & -0.9542 & 0.171079 \tabularnewline
23 & -0.078219 & -0.8091 & 0.210124 \tabularnewline
24 & -0.074368 & -0.7693 & 0.221714 \tabularnewline
25 & -0.068798 & -0.7116 & 0.239115 \tabularnewline
26 & 0.050278 & 0.5201 & 0.302042 \tabularnewline
27 & -0.099238 & -1.0265 & 0.15348 \tabularnewline
28 & 0.003566 & 0.0369 & 0.485323 \tabularnewline
29 & 0.023578 & 0.2439 & 0.403891 \tabularnewline
30 & -0.084067 & -0.8696 & 0.193235 \tabularnewline
31 & -0.03929 & -0.4064 & 0.342622 \tabularnewline
32 & 0.048102 & 0.4976 & 0.309904 \tabularnewline
33 & -0.09099 & -0.9412 & 0.17436 \tabularnewline
34 & -0.115875 & -1.1986 & 0.116662 \tabularnewline
35 & -0.000937 & -0.0097 & 0.496141 \tabularnewline
36 & -0.086399 & -0.8937 & 0.18674 \tabularnewline
37 & 0.062712 & 0.6487 & 0.258961 \tabularnewline
38 & 0.03586 & 0.3709 & 0.355708 \tabularnewline
39 & -0.00838 & -0.0867 & 0.465542 \tabularnewline
40 & 0.121359 & 1.2553 & 0.106044 \tabularnewline
41 & 0.048838 & 0.5052 & 0.307236 \tabularnewline
42 & 0.047618 & 0.4926 & 0.311665 \tabularnewline
43 & 0.068117 & 0.7046 & 0.241293 \tabularnewline
44 & -0.013601 & -0.1407 & 0.44419 \tabularnewline
45 & 0.027605 & 0.2856 & 0.387887 \tabularnewline
46 & -0.023515 & -0.2432 & 0.404142 \tabularnewline
47 & -0.081979 & -0.848 & 0.199167 \tabularnewline
48 & -0.002407 & -0.0249 & 0.490089 \tabularnewline
49 & -0.066868 & -0.6917 & 0.245317 \tabularnewline
50 & -0.063122 & -0.6529 & 0.257599 \tabularnewline
51 & -0.056608 & -0.5856 & 0.279702 \tabularnewline
52 & -0.069257 & -0.7164 & 0.237652 \tabularnewline
53 & -0.054559 & -0.5644 & 0.286845 \tabularnewline
54 & 0.015942 & 0.1649 & 0.434667 \tabularnewline
55 & -0.098386 & -1.0177 & 0.155556 \tabularnewline
56 & 0.020292 & 0.2099 & 0.417073 \tabularnewline
57 & 0.029626 & 0.3065 & 0.379929 \tabularnewline
58 & -0.059188 & -0.6122 & 0.270837 \tabularnewline
59 & 0.017709 & 0.1832 & 0.427501 \tabularnewline
60 & -0.029955 & -0.3099 & 0.378636 \tabularnewline
\hline
\end{tabular}
%Source: https://freestatistics.org/blog/index.php?pk=301603&T=2

[TABLE]
[ROW][C]Partial Autocorrelation Function[/C][/ROW]
[ROW][C]Time lag k[/C][C]PACF(k)[/C][C]T-STAT[/C][C]P-value[/C][/ROW]
[ROW][C]1[/C][C]-0.35026[/C][C]-3.6231[/C][C]0.000223[/C][/ROW]
[ROW][C]2[/C][C]-0.373634[/C][C]-3.8649[/C][C]9.5e-05[/C][/ROW]
[ROW][C]3[/C][C]-0.16371[/C][C]-1.6934[/C][C]0.046642[/C][/ROW]
[ROW][C]4[/C][C]-0.335735[/C][C]-3.4729[/C][C]0.000372[/C][/ROW]
[ROW][C]5[/C][C]0.055045[/C][C]0.5694[/C][C]0.285144[/C][/ROW]
[ROW][C]6[/C][C]-0.195858[/C][C]-2.026[/C][C]0.022628[/C][/ROW]
[ROW][C]7[/C][C]-0.123536[/C][C]-1.2779[/C][C]0.102031[/C][/ROW]
[ROW][C]8[/C][C]0.018581[/C][C]0.1922[/C][C]0.423975[/C][/ROW]
[ROW][C]9[/C][C]-0.037461[/C][C]-0.3875[/C][C]0.349578[/C][/ROW]
[ROW][C]10[/C][C]0.165419[/C][C]1.7111[/C][C]0.044979[/C][/ROW]
[ROW][C]11[/C][C]-0.031365[/C][C]-0.3244[/C][C]0.373119[/C][/ROW]
[ROW][C]12[/C][C]0.108467[/C][C]1.122[/C][C]0.132189[/C][/ROW]
[ROW][C]13[/C][C]-0.013608[/C][C]-0.1408[/C][C]0.444162[/C][/ROW]
[ROW][C]14[/C][C]0.000574[/C][C]0.0059[/C][C]0.497636[/C][/ROW]
[ROW][C]15[/C][C]0.227396[/C][C]2.3522[/C][C]0.010246[/C][/ROW]
[ROW][C]16[/C][C]0.024988[/C][C]0.2585[/C][C]0.398267[/C][/ROW]
[ROW][C]17[/C][C]-0.063168[/C][C]-0.6534[/C][C]0.257444[/C][/ROW]
[ROW][C]18[/C][C]-0.025202[/C][C]-0.2607[/C][C]0.397414[/C][/ROW]
[ROW][C]19[/C][C]0.049088[/C][C]0.5078[/C][C]0.30633[/C][/ROW]
[ROW][C]20[/C][C]-0.146412[/C][C]-1.5145[/C][C]0.066423[/C][/ROW]
[ROW][C]21[/C][C]0.035459[/C][C]0.3668[/C][C]0.357251[/C][/ROW]
[ROW][C]22[/C][C]-0.092241[/C][C]-0.9542[/C][C]0.171079[/C][/ROW]
[ROW][C]23[/C][C]-0.078219[/C][C]-0.8091[/C][C]0.210124[/C][/ROW]
[ROW][C]24[/C][C]-0.074368[/C][C]-0.7693[/C][C]0.221714[/C][/ROW]
[ROW][C]25[/C][C]-0.068798[/C][C]-0.7116[/C][C]0.239115[/C][/ROW]
[ROW][C]26[/C][C]0.050278[/C][C]0.5201[/C][C]0.302042[/C][/ROW]
[ROW][C]27[/C][C]-0.099238[/C][C]-1.0265[/C][C]0.15348[/C][/ROW]
[ROW][C]28[/C][C]0.003566[/C][C]0.0369[/C][C]0.485323[/C][/ROW]
[ROW][C]29[/C][C]0.023578[/C][C]0.2439[/C][C]0.403891[/C][/ROW]
[ROW][C]30[/C][C]-0.084067[/C][C]-0.8696[/C][C]0.193235[/C][/ROW]
[ROW][C]31[/C][C]-0.03929[/C][C]-0.4064[/C][C]0.342622[/C][/ROW]
[ROW][C]32[/C][C]0.048102[/C][C]0.4976[/C][C]0.309904[/C][/ROW]
[ROW][C]33[/C][C]-0.09099[/C][C]-0.9412[/C][C]0.17436[/C][/ROW]
[ROW][C]34[/C][C]-0.115875[/C][C]-1.1986[/C][C]0.116662[/C][/ROW]
[ROW][C]35[/C][C]-0.000937[/C][C]-0.0097[/C][C]0.496141[/C][/ROW]
[ROW][C]36[/C][C]-0.086399[/C][C]-0.8937[/C][C]0.18674[/C][/ROW]
[ROW][C]37[/C][C]0.062712[/C][C]0.6487[/C][C]0.258961[/C][/ROW]
[ROW][C]38[/C][C]0.03586[/C][C]0.3709[/C][C]0.355708[/C][/ROW]
[ROW][C]39[/C][C]-0.00838[/C][C]-0.0867[/C][C]0.465542[/C][/ROW]
[ROW][C]40[/C][C]0.121359[/C][C]1.2553[/C][C]0.106044[/C][/ROW]
[ROW][C]41[/C][C]0.048838[/C][C]0.5052[/C][C]0.307236[/C][/ROW]
[ROW][C]42[/C][C]0.047618[/C][C]0.4926[/C][C]0.311665[/C][/ROW]
[ROW][C]43[/C][C]0.068117[/C][C]0.7046[/C][C]0.241293[/C][/ROW]
[ROW][C]44[/C][C]-0.013601[/C][C]-0.1407[/C][C]0.44419[/C][/ROW]
[ROW][C]45[/C][C]0.027605[/C][C]0.2856[/C][C]0.387887[/C][/ROW]
[ROW][C]46[/C][C]-0.023515[/C][C]-0.2432[/C][C]0.404142[/C][/ROW]
[ROW][C]47[/C][C]-0.081979[/C][C]-0.848[/C][C]0.199167[/C][/ROW]
[ROW][C]48[/C][C]-0.002407[/C][C]-0.0249[/C][C]0.490089[/C][/ROW]
[ROW][C]49[/C][C]-0.066868[/C][C]-0.6917[/C][C]0.245317[/C][/ROW]
[ROW][C]50[/C][C]-0.063122[/C][C]-0.6529[/C][C]0.257599[/C][/ROW]
[ROW][C]51[/C][C]-0.056608[/C][C]-0.5856[/C][C]0.279702[/C][/ROW]
[ROW][C]52[/C][C]-0.069257[/C][C]-0.7164[/C][C]0.237652[/C][/ROW]
[ROW][C]53[/C][C]-0.054559[/C][C]-0.5644[/C][C]0.286845[/C][/ROW]
[ROW][C]54[/C][C]0.015942[/C][C]0.1649[/C][C]0.434667[/C][/ROW]
[ROW][C]55[/C][C]-0.098386[/C][C]-1.0177[/C][C]0.155556[/C][/ROW]
[ROW][C]56[/C][C]0.020292[/C][C]0.2099[/C][C]0.417073[/C][/ROW]
[ROW][C]57[/C][C]0.029626[/C][C]0.3065[/C][C]0.379929[/C][/ROW]
[ROW][C]58[/C][C]-0.059188[/C][C]-0.6122[/C][C]0.270837[/C][/ROW]
[ROW][C]59[/C][C]0.017709[/C][C]0.1832[/C][C]0.427501[/C][/ROW]
[ROW][C]60[/C][C]-0.029955[/C][C]-0.3099[/C][C]0.378636[/C][/ROW]
[/TABLE]
Source: https://freestatistics.org/blog/index.php?pk=301603&T=2

Globally Unique Identifier (entire table): ba.freestatistics.org/blog/index.php?pk=301603&T=2

As an alternative you can also use a QR Code:  

The GUIDs for individual cells are displayed in the table below:

Partial Autocorrelation Function
Time lag kPACF(k)T-STATP-value
1-0.35026-3.62310.000223
2-0.373634-3.86499.5e-05
3-0.16371-1.69340.046642
4-0.335735-3.47290.000372
50.0550450.56940.285144
6-0.195858-2.0260.022628
7-0.123536-1.27790.102031
80.0185810.19220.423975
9-0.037461-0.38750.349578
100.1654191.71110.044979
11-0.031365-0.32440.373119
120.1084671.1220.132189
13-0.013608-0.14080.444162
140.0005740.00590.497636
150.2273962.35220.010246
160.0249880.25850.398267
17-0.063168-0.65340.257444
18-0.025202-0.26070.397414
190.0490880.50780.30633
20-0.146412-1.51450.066423
210.0354590.36680.357251
22-0.092241-0.95420.171079
23-0.078219-0.80910.210124
24-0.074368-0.76930.221714
25-0.068798-0.71160.239115
260.0502780.52010.302042
27-0.099238-1.02650.15348
280.0035660.03690.485323
290.0235780.24390.403891
30-0.084067-0.86960.193235
31-0.03929-0.40640.342622
320.0481020.49760.309904
33-0.09099-0.94120.17436
34-0.115875-1.19860.116662
35-0.000937-0.00970.496141
36-0.086399-0.89370.18674
370.0627120.64870.258961
380.035860.37090.355708
39-0.00838-0.08670.465542
400.1213591.25530.106044
410.0488380.50520.307236
420.0476180.49260.311665
430.0681170.70460.241293
44-0.013601-0.14070.44419
450.0276050.28560.387887
46-0.023515-0.24320.404142
47-0.081979-0.8480.199167
48-0.002407-0.02490.490089
49-0.066868-0.69170.245317
50-0.063122-0.65290.257599
51-0.056608-0.58560.279702
52-0.069257-0.71640.237652
53-0.054559-0.56440.286845
540.0159420.16490.434667
55-0.098386-1.01770.155556
560.0202920.20990.417073
570.0296260.30650.379929
58-0.059188-0.61220.270837
590.0177090.18320.427501
60-0.029955-0.30990.378636


Parameters (Session):
par1 = 60 ; par2 = 1 ; par3 = 1 ; par4 = 1 ; par5 = 12 ; par6 = White Noise ; par7 = 0.95 ;
Parameters (R input):
par1 = 60 ; par2 = 1 ; par3 = 1 ; par4 = 0 ; par5 = 12 ; par6 = White Noise ; par7 = 0.95 ; par8 = ;
R code (references can be found in the software module):
par8 <- ''
par7 <- '0.95'
par6 <- 'White Noise'
par5 <- '12'
par4 <- '0'
par3 <- '1'
par2 <- '1'
par1 <- 'Default'
if (par1 == 'Default') {
par1 = 10*log10(length(x))
} else {
par1 <- as.numeric(par1)
}
par2 <- as.numeric(par2)
par3 <- as.numeric(par3)
par4 <- as.numeric(par4)
par5 <- as.numeric(par5)
if (par6 == 'White Noise') par6 <- 'white' else par6 <- 'ma'
par7 <- as.numeric(par7)
if (par8 != '') par8 <- as.numeric(par8)
x <- na.omit(x)
ox <- x
if (par8 == '') {
if (par2 == 0) {
x <- log(x)
} else {
x <- (x ^ par2 - 1) / par2
}
} else {
x <- log(x,base=par8)
}
if (par3 > 0) x <- diff(x,lag=1,difference=par3)
if (par4 > 0) x <- diff(x,lag=par5,difference=par4)
bitmap(file='picts.png')
op <- par(mfrow=c(2,1))
plot(ox,type='l',main='Original Time Series',xlab='time',ylab='value')
if (par8=='') {
mytitle <- paste('Working Time Series (lambda=',par2,', d=',par3,', D=',par4,')',sep='')
mysub <- paste('(lambda=',par2,', d=',par3,', D=',par4,', CI=', par7, ', CI type=',par6,')',sep='')
} else {
mytitle <- paste('Working Time Series (base=',par8,', d=',par3,', D=',par4,')',sep='')
mysub <- paste('(base=',par8,', d=',par3,', D=',par4,', CI=', par7, ', CI type=',par6,')',sep='')
}
plot(x,type='l', main=mytitle,xlab='time',ylab='value')
par(op)
dev.off()
bitmap(file='pic1.png')
racf <- acf(x, par1, main='Autocorrelation', xlab='time lag', ylab='ACF', ci.type=par6, ci=par7, sub=mysub)
dev.off()
bitmap(file='pic2.png')
rpacf <- pacf(x,par1,main='Partial Autocorrelation',xlab='lags',ylab='PACF',sub=mysub)
dev.off()
(myacf <- c(racf$acf))
(mypacf <- c(rpacf$acf))
lengthx <- length(x)
sqrtn <- sqrt(lengthx)
load(file='createtable')
a<-table.start()
a<-table.row.start(a)
a<-table.element(a,'Autocorrelation Function',4,TRUE)
a<-table.row.end(a)
a<-table.row.start(a)
a<-table.element(a,'Time lag k',header=TRUE)
a<-table.element(a,'ACF(k)',header=TRUE)
a<-table.element(a,'T-STAT',header=TRUE)
a<-table.element(a,'P-value',header=TRUE)
a<-table.row.end(a)
for (i in 2:(par1+1)) {
a<-table.row.start(a)
a<-table.element(a,i-1,header=TRUE)
a<-table.element(a,round(myacf[i],6))
mytstat <- myacf[i]*sqrtn
a<-table.element(a,round(mytstat,4))
a<-table.element(a,round(1-pt(abs(mytstat),lengthx),6))
a<-table.row.end(a)
}
a<-table.end(a)
table.save(a,file='mytable.tab')
a<-table.start()
a<-table.row.start(a)
a<-table.element(a,'Partial Autocorrelation Function',4,TRUE)
a<-table.row.end(a)
a<-table.row.start(a)
a<-table.element(a,'Time lag k',header=TRUE)
a<-table.element(a,'PACF(k)',header=TRUE)
a<-table.element(a,'T-STAT',header=TRUE)
a<-table.element(a,'P-value',header=TRUE)
a<-table.row.end(a)
for (i in 1:par1) {
a<-table.row.start(a)
a<-table.element(a,i,header=TRUE)
a<-table.element(a,round(mypacf[i],6))
mytstat <- mypacf[i]*sqrtn
a<-table.element(a,round(mytstat,4))
a<-table.element(a,round(1-pt(abs(mytstat),lengthx),6))
a<-table.row.end(a)
}
a<-table.end(a)
table.save(a,file='mytable1.tab')