Free Statistics

of Irreproducible Research!

Author's title

Author*The author of this computation has been verified*
R Software Modulerwasp_autocorrelation.wasp
Title produced by software(Partial) Autocorrelation Function
Date of computationTue, 20 Dec 2016 12:17:54 +0100
Cite this page as followsStatistical Computations at FreeStatistics.org, Office for Research Development and Education, URL https://freestatistics.org/blog/index.php?v=date/2016/Dec/20/t1482232779bu31si9smw6wydb.htm/, Retrieved Sun, 28 Apr 2024 08:59:27 +0000
Statistical Computations at FreeStatistics.org, Office for Research Development and Education, URL https://freestatistics.org/blog/index.php?pk=301608, Retrieved Sun, 28 Apr 2024 08:59:27 +0000
QR Codes:

Original text written by user:
IsPrivate?No (this computation is public)
User-defined keywords
Estimated Impact61
Family? (F = Feedback message, R = changed R code, M = changed R Module, P = changed Parameters, D = changed Data)
-       [(Partial) Autocorrelation Function] [] [2016-12-20 11:17:54] [b7216e4bc5ee29192acbe9c506cee18c] [Current]
Feedback Forum

Post a new message
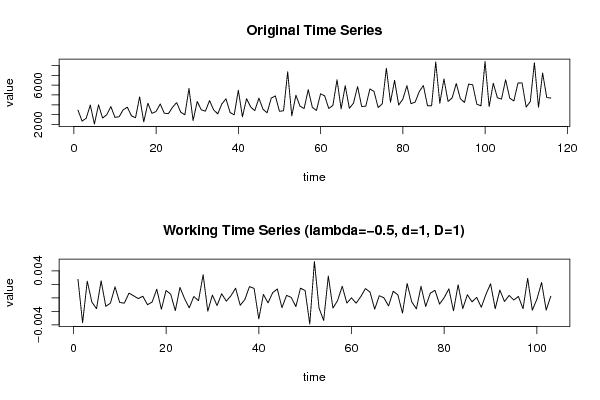
Dataseries X:
3450.3
2328.96
2610.24
3974.04
2025.3
3991.02
2636.88
2980.98
3813.36
2709.42
2772
3482.64
3752.64
2873.16
2667.84
4810.8
2247.54
4156.92
3121.02
3312.54
4081.14
3135.06
3089.64
3744.24
4227.24
3241.26
2976.36
5675.58
2387.64
4329.06
3478.2
3346.56
4428.48
3473.16
3069.78
4091.58
4602.6
3202.2
2973.42
5486.28
2774.76
4621.44
3778.44
3391.38
4680.78
3540.72
3178.02
4682.1
4906.26
3327.78
3390.9
7373.82
2861.46
4976.7
3853.38
3612.78
5544.6
3737.7
3414.9
5128.14
4904.4
3616.74
3939.84
6555.96
3578.1
5948.4
3637.86
4163.4
5864.52
3814.92
3859.2
5619.3
5358.36
3713.82
4092.3
7733.52
4261.5
6494.94
3971.46
4568.16
5953.98
4105.56
4272.78
5347.8
5971.44
3908.46
3888.3
8376.24
4151.16
6636.06
4339.74
4707.72
6176.34
4619.16
4230.42
6114
6042.78
4059.42
3888.3
8422.8
3813.6
6203.34
4715.58
4585.56
6561
4683.9
4385.7
6218.16
6241.86
3764.82
4327.62
8301.06
3731.04
7252.68
4743
4686.06


Summary of computational transaction
Raw Input view raw input (R code)
Raw Outputview raw output of R engine
Computing time2 seconds
R ServerBig Analytics Cloud Computing Center

\begin{tabular}{lllllllll}
\hline
Summary of computational transaction \tabularnewline
Raw Input view raw input (R code)  \tabularnewline
Raw Outputview raw output of R engine  \tabularnewline
Computing time2 seconds \tabularnewline
R ServerBig Analytics Cloud Computing Center \tabularnewline
\hline
\end{tabular}
%Source: https://freestatistics.org/blog/index.php?pk=301608&T=0

[TABLE]
[ROW]
Summary of computational transaction[/C][/ROW] [ROW]Raw Input[/C] view raw input (R code) [/C][/ROW] [ROW]Raw Output[/C]view raw output of R engine [/C][/ROW] [ROW]Computing time[/C]2 seconds[/C][/ROW] [ROW]R Server[/C]Big Analytics Cloud Computing Center[/C][/ROW] [/TABLE] Source: https://freestatistics.org/blog/index.php?pk=301608&T=0

Globally Unique Identifier (entire table): ba.freestatistics.org/blog/index.php?pk=301608&T=0

As an alternative you can also use a QR Code:  

The GUIDs for individual cells are displayed in the table below:

Summary of computational transaction
Raw Input view raw input (R code)
Raw Outputview raw output of R engine
Computing time2 seconds
R ServerBig Analytics Cloud Computing Center


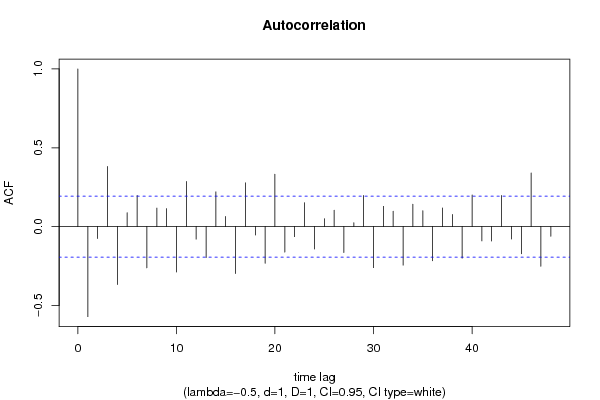
Autocorrelation Function
Time lag kACF(k)T-STATP-value
1-0.571532-5.80040
2-0.075766-0.76890.221843
30.3810683.86749.6e-05
4-0.367311-3.72780.000158
50.0878160.89120.187439
60.19762.00540.02377
7-0.261919-2.65820.004555
80.1170161.18760.118865
90.1137791.15470.125436
10-0.288045-2.92330.002129
110.2862012.90460.00225
12-0.079891-0.81080.209675
13-0.195931-1.98850.024706
140.2200912.23370.013833
150.0641260.65080.25831
16-0.298375-3.02820.001555
170.2773672.8150.002923
18-0.053584-0.54380.293871
19-0.232431-2.35890.010107
200.332063.370.000529
21-0.161985-1.6440.051616
22-0.064009-0.64960.258693
230.1513041.53560.063856
24-0.142181-1.4430.07603
250.0500710.50820.306212
260.1040441.05590.146735
27-0.165098-1.67560.048429
280.0246060.24970.40165
290.1970712.00010.024063
30-0.260599-2.64480.004727
310.1281931.3010.098079
320.0973330.98780.162776
33-0.244754-2.4840.007302
340.1414881.43590.077024
350.0999411.01430.15641
36-0.216917-2.20150.014967
370.1174671.19220.117969
380.0766540.7780.219189
39-0.200511-2.0350.022212
400.2002652.03250.02234
41-0.09084-0.92190.179361
42-0.092044-0.93410.176207
430.1968931.99820.024163
44-0.078648-0.79820.213298
45-0.172695-1.75270.041318
460.3400843.45150.000405
47-0.251799-2.55550.006032
48-0.061624-0.62540.266542

\begin{tabular}{lllllllll}
\hline
Autocorrelation Function \tabularnewline
Time lag k & ACF(k) & T-STAT & P-value \tabularnewline
1 & -0.571532 & -5.8004 & 0 \tabularnewline
2 & -0.075766 & -0.7689 & 0.221843 \tabularnewline
3 & 0.381068 & 3.8674 & 9.6e-05 \tabularnewline
4 & -0.367311 & -3.7278 & 0.000158 \tabularnewline
5 & 0.087816 & 0.8912 & 0.187439 \tabularnewline
6 & 0.1976 & 2.0054 & 0.02377 \tabularnewline
7 & -0.261919 & -2.6582 & 0.004555 \tabularnewline
8 & 0.117016 & 1.1876 & 0.118865 \tabularnewline
9 & 0.113779 & 1.1547 & 0.125436 \tabularnewline
10 & -0.288045 & -2.9233 & 0.002129 \tabularnewline
11 & 0.286201 & 2.9046 & 0.00225 \tabularnewline
12 & -0.079891 & -0.8108 & 0.209675 \tabularnewline
13 & -0.195931 & -1.9885 & 0.024706 \tabularnewline
14 & 0.220091 & 2.2337 & 0.013833 \tabularnewline
15 & 0.064126 & 0.6508 & 0.25831 \tabularnewline
16 & -0.298375 & -3.0282 & 0.001555 \tabularnewline
17 & 0.277367 & 2.815 & 0.002923 \tabularnewline
18 & -0.053584 & -0.5438 & 0.293871 \tabularnewline
19 & -0.232431 & -2.3589 & 0.010107 \tabularnewline
20 & 0.33206 & 3.37 & 0.000529 \tabularnewline
21 & -0.161985 & -1.644 & 0.051616 \tabularnewline
22 & -0.064009 & -0.6496 & 0.258693 \tabularnewline
23 & 0.151304 & 1.5356 & 0.063856 \tabularnewline
24 & -0.142181 & -1.443 & 0.07603 \tabularnewline
25 & 0.050071 & 0.5082 & 0.306212 \tabularnewline
26 & 0.104044 & 1.0559 & 0.146735 \tabularnewline
27 & -0.165098 & -1.6756 & 0.048429 \tabularnewline
28 & 0.024606 & 0.2497 & 0.40165 \tabularnewline
29 & 0.197071 & 2.0001 & 0.024063 \tabularnewline
30 & -0.260599 & -2.6448 & 0.004727 \tabularnewline
31 & 0.128193 & 1.301 & 0.098079 \tabularnewline
32 & 0.097333 & 0.9878 & 0.162776 \tabularnewline
33 & -0.244754 & -2.484 & 0.007302 \tabularnewline
34 & 0.141488 & 1.4359 & 0.077024 \tabularnewline
35 & 0.099941 & 1.0143 & 0.15641 \tabularnewline
36 & -0.216917 & -2.2015 & 0.014967 \tabularnewline
37 & 0.117467 & 1.1922 & 0.117969 \tabularnewline
38 & 0.076654 & 0.778 & 0.219189 \tabularnewline
39 & -0.200511 & -2.035 & 0.022212 \tabularnewline
40 & 0.200265 & 2.0325 & 0.02234 \tabularnewline
41 & -0.09084 & -0.9219 & 0.179361 \tabularnewline
42 & -0.092044 & -0.9341 & 0.176207 \tabularnewline
43 & 0.196893 & 1.9982 & 0.024163 \tabularnewline
44 & -0.078648 & -0.7982 & 0.213298 \tabularnewline
45 & -0.172695 & -1.7527 & 0.041318 \tabularnewline
46 & 0.340084 & 3.4515 & 0.000405 \tabularnewline
47 & -0.251799 & -2.5555 & 0.006032 \tabularnewline
48 & -0.061624 & -0.6254 & 0.266542 \tabularnewline
\hline
\end{tabular}
%Source: https://freestatistics.org/blog/index.php?pk=301608&T=1

[TABLE]
[ROW][C]Autocorrelation Function[/C][/ROW]
[ROW][C]Time lag k[/C][C]ACF(k)[/C][C]T-STAT[/C][C]P-value[/C][/ROW]
[ROW][C]1[/C][C]-0.571532[/C][C]-5.8004[/C][C]0[/C][/ROW]
[ROW][C]2[/C][C]-0.075766[/C][C]-0.7689[/C][C]0.221843[/C][/ROW]
[ROW][C]3[/C][C]0.381068[/C][C]3.8674[/C][C]9.6e-05[/C][/ROW]
[ROW][C]4[/C][C]-0.367311[/C][C]-3.7278[/C][C]0.000158[/C][/ROW]
[ROW][C]5[/C][C]0.087816[/C][C]0.8912[/C][C]0.187439[/C][/ROW]
[ROW][C]6[/C][C]0.1976[/C][C]2.0054[/C][C]0.02377[/C][/ROW]
[ROW][C]7[/C][C]-0.261919[/C][C]-2.6582[/C][C]0.004555[/C][/ROW]
[ROW][C]8[/C][C]0.117016[/C][C]1.1876[/C][C]0.118865[/C][/ROW]
[ROW][C]9[/C][C]0.113779[/C][C]1.1547[/C][C]0.125436[/C][/ROW]
[ROW][C]10[/C][C]-0.288045[/C][C]-2.9233[/C][C]0.002129[/C][/ROW]
[ROW][C]11[/C][C]0.286201[/C][C]2.9046[/C][C]0.00225[/C][/ROW]
[ROW][C]12[/C][C]-0.079891[/C][C]-0.8108[/C][C]0.209675[/C][/ROW]
[ROW][C]13[/C][C]-0.195931[/C][C]-1.9885[/C][C]0.024706[/C][/ROW]
[ROW][C]14[/C][C]0.220091[/C][C]2.2337[/C][C]0.013833[/C][/ROW]
[ROW][C]15[/C][C]0.064126[/C][C]0.6508[/C][C]0.25831[/C][/ROW]
[ROW][C]16[/C][C]-0.298375[/C][C]-3.0282[/C][C]0.001555[/C][/ROW]
[ROW][C]17[/C][C]0.277367[/C][C]2.815[/C][C]0.002923[/C][/ROW]
[ROW][C]18[/C][C]-0.053584[/C][C]-0.5438[/C][C]0.293871[/C][/ROW]
[ROW][C]19[/C][C]-0.232431[/C][C]-2.3589[/C][C]0.010107[/C][/ROW]
[ROW][C]20[/C][C]0.33206[/C][C]3.37[/C][C]0.000529[/C][/ROW]
[ROW][C]21[/C][C]-0.161985[/C][C]-1.644[/C][C]0.051616[/C][/ROW]
[ROW][C]22[/C][C]-0.064009[/C][C]-0.6496[/C][C]0.258693[/C][/ROW]
[ROW][C]23[/C][C]0.151304[/C][C]1.5356[/C][C]0.063856[/C][/ROW]
[ROW][C]24[/C][C]-0.142181[/C][C]-1.443[/C][C]0.07603[/C][/ROW]
[ROW][C]25[/C][C]0.050071[/C][C]0.5082[/C][C]0.306212[/C][/ROW]
[ROW][C]26[/C][C]0.104044[/C][C]1.0559[/C][C]0.146735[/C][/ROW]
[ROW][C]27[/C][C]-0.165098[/C][C]-1.6756[/C][C]0.048429[/C][/ROW]
[ROW][C]28[/C][C]0.024606[/C][C]0.2497[/C][C]0.40165[/C][/ROW]
[ROW][C]29[/C][C]0.197071[/C][C]2.0001[/C][C]0.024063[/C][/ROW]
[ROW][C]30[/C][C]-0.260599[/C][C]-2.6448[/C][C]0.004727[/C][/ROW]
[ROW][C]31[/C][C]0.128193[/C][C]1.301[/C][C]0.098079[/C][/ROW]
[ROW][C]32[/C][C]0.097333[/C][C]0.9878[/C][C]0.162776[/C][/ROW]
[ROW][C]33[/C][C]-0.244754[/C][C]-2.484[/C][C]0.007302[/C][/ROW]
[ROW][C]34[/C][C]0.141488[/C][C]1.4359[/C][C]0.077024[/C][/ROW]
[ROW][C]35[/C][C]0.099941[/C][C]1.0143[/C][C]0.15641[/C][/ROW]
[ROW][C]36[/C][C]-0.216917[/C][C]-2.2015[/C][C]0.014967[/C][/ROW]
[ROW][C]37[/C][C]0.117467[/C][C]1.1922[/C][C]0.117969[/C][/ROW]
[ROW][C]38[/C][C]0.076654[/C][C]0.778[/C][C]0.219189[/C][/ROW]
[ROW][C]39[/C][C]-0.200511[/C][C]-2.035[/C][C]0.022212[/C][/ROW]
[ROW][C]40[/C][C]0.200265[/C][C]2.0325[/C][C]0.02234[/C][/ROW]
[ROW][C]41[/C][C]-0.09084[/C][C]-0.9219[/C][C]0.179361[/C][/ROW]
[ROW][C]42[/C][C]-0.092044[/C][C]-0.9341[/C][C]0.176207[/C][/ROW]
[ROW][C]43[/C][C]0.196893[/C][C]1.9982[/C][C]0.024163[/C][/ROW]
[ROW][C]44[/C][C]-0.078648[/C][C]-0.7982[/C][C]0.213298[/C][/ROW]
[ROW][C]45[/C][C]-0.172695[/C][C]-1.7527[/C][C]0.041318[/C][/ROW]
[ROW][C]46[/C][C]0.340084[/C][C]3.4515[/C][C]0.000405[/C][/ROW]
[ROW][C]47[/C][C]-0.251799[/C][C]-2.5555[/C][C]0.006032[/C][/ROW]
[ROW][C]48[/C][C]-0.061624[/C][C]-0.6254[/C][C]0.266542[/C][/ROW]
[/TABLE]
Source: https://freestatistics.org/blog/index.php?pk=301608&T=1

Globally Unique Identifier (entire table): ba.freestatistics.org/blog/index.php?pk=301608&T=1

As an alternative you can also use a QR Code:  

The GUIDs for individual cells are displayed in the table below:

Autocorrelation Function
Time lag kACF(k)T-STATP-value
1-0.571532-5.80040
2-0.075766-0.76890.221843
30.3810683.86749.6e-05
4-0.367311-3.72780.000158
50.0878160.89120.187439
60.19762.00540.02377
7-0.261919-2.65820.004555
80.1170161.18760.118865
90.1137791.15470.125436
10-0.288045-2.92330.002129
110.2862012.90460.00225
12-0.079891-0.81080.209675
13-0.195931-1.98850.024706
140.2200912.23370.013833
150.0641260.65080.25831
16-0.298375-3.02820.001555
170.2773672.8150.002923
18-0.053584-0.54380.293871
19-0.232431-2.35890.010107
200.332063.370.000529
21-0.161985-1.6440.051616
22-0.064009-0.64960.258693
230.1513041.53560.063856
24-0.142181-1.4430.07603
250.0500710.50820.306212
260.1040441.05590.146735
27-0.165098-1.67560.048429
280.0246060.24970.40165
290.1970712.00010.024063
30-0.260599-2.64480.004727
310.1281931.3010.098079
320.0973330.98780.162776
33-0.244754-2.4840.007302
340.1414881.43590.077024
350.0999411.01430.15641
36-0.216917-2.20150.014967
370.1174671.19220.117969
380.0766540.7780.219189
39-0.200511-2.0350.022212
400.2002652.03250.02234
41-0.09084-0.92190.179361
42-0.092044-0.93410.176207
430.1968931.99820.024163
44-0.078648-0.79820.213298
45-0.172695-1.75270.041318
460.3400843.45150.000405
47-0.251799-2.55550.006032
48-0.061624-0.62540.266542


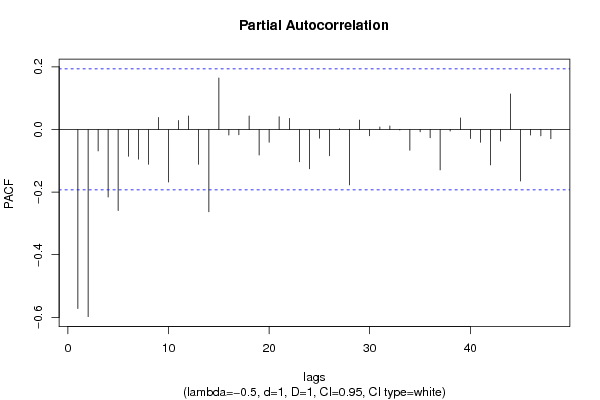
Partial Autocorrelation Function
Time lag kPACF(k)T-STATP-value
1-0.571532-5.80040
2-0.59763-6.06530
3-0.068563-0.69580.244048
4-0.21576-2.18970.0154
5-0.258747-2.6260.004978
6-0.085683-0.86960.193275
7-0.094705-0.96110.169364
8-0.111258-1.12910.130729
90.0382970.38870.349162
10-0.167938-1.70440.045662
110.0288260.29250.385228
120.0429250.43560.332003
13-0.111268-1.12920.130709
14-0.26306-2.66980.004411
150.1643741.66820.049156
16-0.017753-0.18020.428687
17-0.017051-0.1730.431477
180.0427010.43340.332825
19-0.081606-0.82820.204734
20-0.040743-0.41350.340051
210.0404730.41080.341053
220.0352660.35790.360572
23-0.103253-1.04790.148568
24-0.125319-1.27190.103145
25-0.027734-0.28150.389458
26-0.084054-0.85310.197804
270.002390.02430.49035
28-0.177002-1.79640.037683
290.0297270.30170.381744
30-0.019903-0.2020.42016
310.0075920.0770.469367
320.0108740.11040.456172
33-0.001694-0.01720.493157
34-0.066606-0.6760.250285
35-0.007243-0.07350.470774
36-0.026749-0.27150.393284
37-0.129061-1.30980.096584
38-0.004797-0.04870.480634
390.0367660.37310.354909
40-0.029034-0.29470.384422
41-0.041035-0.41650.338971
42-0.113094-1.14780.126859
43-0.037099-0.37650.353656
440.113031.14710.126992
45-0.164569-1.67020.048959
46-0.017799-0.18060.428501
47-0.020458-0.20760.417967
48-0.029625-0.30070.382139

\begin{tabular}{lllllllll}
\hline
Partial Autocorrelation Function \tabularnewline
Time lag k & PACF(k) & T-STAT & P-value \tabularnewline
1 & -0.571532 & -5.8004 & 0 \tabularnewline
2 & -0.59763 & -6.0653 & 0 \tabularnewline
3 & -0.068563 & -0.6958 & 0.244048 \tabularnewline
4 & -0.21576 & -2.1897 & 0.0154 \tabularnewline
5 & -0.258747 & -2.626 & 0.004978 \tabularnewline
6 & -0.085683 & -0.8696 & 0.193275 \tabularnewline
7 & -0.094705 & -0.9611 & 0.169364 \tabularnewline
8 & -0.111258 & -1.1291 & 0.130729 \tabularnewline
9 & 0.038297 & 0.3887 & 0.349162 \tabularnewline
10 & -0.167938 & -1.7044 & 0.045662 \tabularnewline
11 & 0.028826 & 0.2925 & 0.385228 \tabularnewline
12 & 0.042925 & 0.4356 & 0.332003 \tabularnewline
13 & -0.111268 & -1.1292 & 0.130709 \tabularnewline
14 & -0.26306 & -2.6698 & 0.004411 \tabularnewline
15 & 0.164374 & 1.6682 & 0.049156 \tabularnewline
16 & -0.017753 & -0.1802 & 0.428687 \tabularnewline
17 & -0.017051 & -0.173 & 0.431477 \tabularnewline
18 & 0.042701 & 0.4334 & 0.332825 \tabularnewline
19 & -0.081606 & -0.8282 & 0.204734 \tabularnewline
20 & -0.040743 & -0.4135 & 0.340051 \tabularnewline
21 & 0.040473 & 0.4108 & 0.341053 \tabularnewline
22 & 0.035266 & 0.3579 & 0.360572 \tabularnewline
23 & -0.103253 & -1.0479 & 0.148568 \tabularnewline
24 & -0.125319 & -1.2719 & 0.103145 \tabularnewline
25 & -0.027734 & -0.2815 & 0.389458 \tabularnewline
26 & -0.084054 & -0.8531 & 0.197804 \tabularnewline
27 & 0.00239 & 0.0243 & 0.49035 \tabularnewline
28 & -0.177002 & -1.7964 & 0.037683 \tabularnewline
29 & 0.029727 & 0.3017 & 0.381744 \tabularnewline
30 & -0.019903 & -0.202 & 0.42016 \tabularnewline
31 & 0.007592 & 0.077 & 0.469367 \tabularnewline
32 & 0.010874 & 0.1104 & 0.456172 \tabularnewline
33 & -0.001694 & -0.0172 & 0.493157 \tabularnewline
34 & -0.066606 & -0.676 & 0.250285 \tabularnewline
35 & -0.007243 & -0.0735 & 0.470774 \tabularnewline
36 & -0.026749 & -0.2715 & 0.393284 \tabularnewline
37 & -0.129061 & -1.3098 & 0.096584 \tabularnewline
38 & -0.004797 & -0.0487 & 0.480634 \tabularnewline
39 & 0.036766 & 0.3731 & 0.354909 \tabularnewline
40 & -0.029034 & -0.2947 & 0.384422 \tabularnewline
41 & -0.041035 & -0.4165 & 0.338971 \tabularnewline
42 & -0.113094 & -1.1478 & 0.126859 \tabularnewline
43 & -0.037099 & -0.3765 & 0.353656 \tabularnewline
44 & 0.11303 & 1.1471 & 0.126992 \tabularnewline
45 & -0.164569 & -1.6702 & 0.048959 \tabularnewline
46 & -0.017799 & -0.1806 & 0.428501 \tabularnewline
47 & -0.020458 & -0.2076 & 0.417967 \tabularnewline
48 & -0.029625 & -0.3007 & 0.382139 \tabularnewline
\hline
\end{tabular}
%Source: https://freestatistics.org/blog/index.php?pk=301608&T=2

[TABLE]
[ROW][C]Partial Autocorrelation Function[/C][/ROW]
[ROW][C]Time lag k[/C][C]PACF(k)[/C][C]T-STAT[/C][C]P-value[/C][/ROW]
[ROW][C]1[/C][C]-0.571532[/C][C]-5.8004[/C][C]0[/C][/ROW]
[ROW][C]2[/C][C]-0.59763[/C][C]-6.0653[/C][C]0[/C][/ROW]
[ROW][C]3[/C][C]-0.068563[/C][C]-0.6958[/C][C]0.244048[/C][/ROW]
[ROW][C]4[/C][C]-0.21576[/C][C]-2.1897[/C][C]0.0154[/C][/ROW]
[ROW][C]5[/C][C]-0.258747[/C][C]-2.626[/C][C]0.004978[/C][/ROW]
[ROW][C]6[/C][C]-0.085683[/C][C]-0.8696[/C][C]0.193275[/C][/ROW]
[ROW][C]7[/C][C]-0.094705[/C][C]-0.9611[/C][C]0.169364[/C][/ROW]
[ROW][C]8[/C][C]-0.111258[/C][C]-1.1291[/C][C]0.130729[/C][/ROW]
[ROW][C]9[/C][C]0.038297[/C][C]0.3887[/C][C]0.349162[/C][/ROW]
[ROW][C]10[/C][C]-0.167938[/C][C]-1.7044[/C][C]0.045662[/C][/ROW]
[ROW][C]11[/C][C]0.028826[/C][C]0.2925[/C][C]0.385228[/C][/ROW]
[ROW][C]12[/C][C]0.042925[/C][C]0.4356[/C][C]0.332003[/C][/ROW]
[ROW][C]13[/C][C]-0.111268[/C][C]-1.1292[/C][C]0.130709[/C][/ROW]
[ROW][C]14[/C][C]-0.26306[/C][C]-2.6698[/C][C]0.004411[/C][/ROW]
[ROW][C]15[/C][C]0.164374[/C][C]1.6682[/C][C]0.049156[/C][/ROW]
[ROW][C]16[/C][C]-0.017753[/C][C]-0.1802[/C][C]0.428687[/C][/ROW]
[ROW][C]17[/C][C]-0.017051[/C][C]-0.173[/C][C]0.431477[/C][/ROW]
[ROW][C]18[/C][C]0.042701[/C][C]0.4334[/C][C]0.332825[/C][/ROW]
[ROW][C]19[/C][C]-0.081606[/C][C]-0.8282[/C][C]0.204734[/C][/ROW]
[ROW][C]20[/C][C]-0.040743[/C][C]-0.4135[/C][C]0.340051[/C][/ROW]
[ROW][C]21[/C][C]0.040473[/C][C]0.4108[/C][C]0.341053[/C][/ROW]
[ROW][C]22[/C][C]0.035266[/C][C]0.3579[/C][C]0.360572[/C][/ROW]
[ROW][C]23[/C][C]-0.103253[/C][C]-1.0479[/C][C]0.148568[/C][/ROW]
[ROW][C]24[/C][C]-0.125319[/C][C]-1.2719[/C][C]0.103145[/C][/ROW]
[ROW][C]25[/C][C]-0.027734[/C][C]-0.2815[/C][C]0.389458[/C][/ROW]
[ROW][C]26[/C][C]-0.084054[/C][C]-0.8531[/C][C]0.197804[/C][/ROW]
[ROW][C]27[/C][C]0.00239[/C][C]0.0243[/C][C]0.49035[/C][/ROW]
[ROW][C]28[/C][C]-0.177002[/C][C]-1.7964[/C][C]0.037683[/C][/ROW]
[ROW][C]29[/C][C]0.029727[/C][C]0.3017[/C][C]0.381744[/C][/ROW]
[ROW][C]30[/C][C]-0.019903[/C][C]-0.202[/C][C]0.42016[/C][/ROW]
[ROW][C]31[/C][C]0.007592[/C][C]0.077[/C][C]0.469367[/C][/ROW]
[ROW][C]32[/C][C]0.010874[/C][C]0.1104[/C][C]0.456172[/C][/ROW]
[ROW][C]33[/C][C]-0.001694[/C][C]-0.0172[/C][C]0.493157[/C][/ROW]
[ROW][C]34[/C][C]-0.066606[/C][C]-0.676[/C][C]0.250285[/C][/ROW]
[ROW][C]35[/C][C]-0.007243[/C][C]-0.0735[/C][C]0.470774[/C][/ROW]
[ROW][C]36[/C][C]-0.026749[/C][C]-0.2715[/C][C]0.393284[/C][/ROW]
[ROW][C]37[/C][C]-0.129061[/C][C]-1.3098[/C][C]0.096584[/C][/ROW]
[ROW][C]38[/C][C]-0.004797[/C][C]-0.0487[/C][C]0.480634[/C][/ROW]
[ROW][C]39[/C][C]0.036766[/C][C]0.3731[/C][C]0.354909[/C][/ROW]
[ROW][C]40[/C][C]-0.029034[/C][C]-0.2947[/C][C]0.384422[/C][/ROW]
[ROW][C]41[/C][C]-0.041035[/C][C]-0.4165[/C][C]0.338971[/C][/ROW]
[ROW][C]42[/C][C]-0.113094[/C][C]-1.1478[/C][C]0.126859[/C][/ROW]
[ROW][C]43[/C][C]-0.037099[/C][C]-0.3765[/C][C]0.353656[/C][/ROW]
[ROW][C]44[/C][C]0.11303[/C][C]1.1471[/C][C]0.126992[/C][/ROW]
[ROW][C]45[/C][C]-0.164569[/C][C]-1.6702[/C][C]0.048959[/C][/ROW]
[ROW][C]46[/C][C]-0.017799[/C][C]-0.1806[/C][C]0.428501[/C][/ROW]
[ROW][C]47[/C][C]-0.020458[/C][C]-0.2076[/C][C]0.417967[/C][/ROW]
[ROW][C]48[/C][C]-0.029625[/C][C]-0.3007[/C][C]0.382139[/C][/ROW]
[/TABLE]
Source: https://freestatistics.org/blog/index.php?pk=301608&T=2

Globally Unique Identifier (entire table): ba.freestatistics.org/blog/index.php?pk=301608&T=2

As an alternative you can also use a QR Code:  

The GUIDs for individual cells are displayed in the table below:

Partial Autocorrelation Function
Time lag kPACF(k)T-STATP-value
1-0.571532-5.80040
2-0.59763-6.06530
3-0.068563-0.69580.244048
4-0.21576-2.18970.0154
5-0.258747-2.6260.004978
6-0.085683-0.86960.193275
7-0.094705-0.96110.169364
8-0.111258-1.12910.130729
90.0382970.38870.349162
10-0.167938-1.70440.045662
110.0288260.29250.385228
120.0429250.43560.332003
13-0.111268-1.12920.130709
14-0.26306-2.66980.004411
150.1643741.66820.049156
16-0.017753-0.18020.428687
17-0.017051-0.1730.431477
180.0427010.43340.332825
19-0.081606-0.82820.204734
20-0.040743-0.41350.340051
210.0404730.41080.341053
220.0352660.35790.360572
23-0.103253-1.04790.148568
24-0.125319-1.27190.103145
25-0.027734-0.28150.389458
26-0.084054-0.85310.197804
270.002390.02430.49035
28-0.177002-1.79640.037683
290.0297270.30170.381744
30-0.019903-0.2020.42016
310.0075920.0770.469367
320.0108740.11040.456172
33-0.001694-0.01720.493157
34-0.066606-0.6760.250285
35-0.007243-0.07350.470774
36-0.026749-0.27150.393284
37-0.129061-1.30980.096584
38-0.004797-0.04870.480634
390.0367660.37310.354909
40-0.029034-0.29470.384422
41-0.041035-0.41650.338971
42-0.113094-1.14780.126859
43-0.037099-0.37650.353656
440.113031.14710.126992
45-0.164569-1.67020.048959
46-0.017799-0.18060.428501
47-0.020458-0.20760.417967
48-0.029625-0.30070.382139


Parameters (Session):
par1 = 48 ; par2 = -0.5 ; par3 = 1 ; par4 = 1 ; par5 = 12 ; par6 = White Noise ; par7 = 0.95 ;
Parameters (R input):
par1 = 48 ; par2 = -0.5 ; par3 = 1 ; par4 = 1 ; par5 = 12 ; par6 = White Noise ; par7 = 0.95 ; par8 = ;
R code (references can be found in the software module):
par8 <- ''
par7 <- '0.95'
par6 <- 'White Noise'
par5 <- '12'
par4 <- '1'
par3 <- '2'
par2 <- '-0.5'
par1 <- '48'
if (par1 == 'Default') {
par1 = 10*log10(length(x))
} else {
par1 <- as.numeric(par1)
}
par2 <- as.numeric(par2)
par3 <- as.numeric(par3)
par4 <- as.numeric(par4)
par5 <- as.numeric(par5)
if (par6 == 'White Noise') par6 <- 'white' else par6 <- 'ma'
par7 <- as.numeric(par7)
if (par8 != '') par8 <- as.numeric(par8)
x <- na.omit(x)
ox <- x
if (par8 == '') {
if (par2 == 0) {
x <- log(x)
} else {
x <- (x ^ par2 - 1) / par2
}
} else {
x <- log(x,base=par8)
}
if (par3 > 0) x <- diff(x,lag=1,difference=par3)
if (par4 > 0) x <- diff(x,lag=par5,difference=par4)
bitmap(file='picts.png')
op <- par(mfrow=c(2,1))
plot(ox,type='l',main='Original Time Series',xlab='time',ylab='value')
if (par8=='') {
mytitle <- paste('Working Time Series (lambda=',par2,', d=',par3,', D=',par4,')',sep='')
mysub <- paste('(lambda=',par2,', d=',par3,', D=',par4,', CI=', par7, ', CI type=',par6,')',sep='')
} else {
mytitle <- paste('Working Time Series (base=',par8,', d=',par3,', D=',par4,')',sep='')
mysub <- paste('(base=',par8,', d=',par3,', D=',par4,', CI=', par7, ', CI type=',par6,')',sep='')
}
plot(x,type='l', main=mytitle,xlab='time',ylab='value')
par(op)
dev.off()
bitmap(file='pic1.png')
racf <- acf(x, par1, main='Autocorrelation', xlab='time lag', ylab='ACF', ci.type=par6, ci=par7, sub=mysub)
dev.off()
bitmap(file='pic2.png')
rpacf <- pacf(x,par1,main='Partial Autocorrelation',xlab='lags',ylab='PACF',sub=mysub)
dev.off()
(myacf <- c(racf$acf))
(mypacf <- c(rpacf$acf))
lengthx <- length(x)
sqrtn <- sqrt(lengthx)
load(file='createtable')
a<-table.start()
a<-table.row.start(a)
a<-table.element(a,'Autocorrelation Function',4,TRUE)
a<-table.row.end(a)
a<-table.row.start(a)
a<-table.element(a,'Time lag k',header=TRUE)
a<-table.element(a,'ACF(k)',header=TRUE)
a<-table.element(a,'T-STAT',header=TRUE)
a<-table.element(a,'P-value',header=TRUE)
a<-table.row.end(a)
for (i in 2:(par1+1)) {
a<-table.row.start(a)
a<-table.element(a,i-1,header=TRUE)
a<-table.element(a,round(myacf[i],6))
mytstat <- myacf[i]*sqrtn
a<-table.element(a,round(mytstat,4))
a<-table.element(a,round(1-pt(abs(mytstat),lengthx),6))
a<-table.row.end(a)
}
a<-table.end(a)
table.save(a,file='mytable.tab')
a<-table.start()
a<-table.row.start(a)
a<-table.element(a,'Partial Autocorrelation Function',4,TRUE)
a<-table.row.end(a)
a<-table.row.start(a)
a<-table.element(a,'Time lag k',header=TRUE)
a<-table.element(a,'PACF(k)',header=TRUE)
a<-table.element(a,'T-STAT',header=TRUE)
a<-table.element(a,'P-value',header=TRUE)
a<-table.row.end(a)
for (i in 1:par1) {
a<-table.row.start(a)
a<-table.element(a,i,header=TRUE)
a<-table.element(a,round(mypacf[i],6))
mytstat <- mypacf[i]*sqrtn
a<-table.element(a,round(mytstat,4))
a<-table.element(a,round(1-pt(abs(mytstat),lengthx),6))
a<-table.row.end(a)
}
a<-table.end(a)
table.save(a,file='mytable1.tab')