Free Statistics

of Irreproducible Research!

Author's title

Author*The author of this computation has been verified*
R Software Modulerwasp_autocorrelation.wasp
Title produced by software(Partial) Autocorrelation Function
Date of computationTue, 20 Dec 2016 13:12:00 +0100
Cite this page as followsStatistical Computations at FreeStatistics.org, Office for Research Development and Education, URL https://freestatistics.org/blog/index.php?v=date/2016/Dec/20/t1482235968zemsupzduhy49rb.htm/, Retrieved Sun, 28 Apr 2024 17:35:11 +0000
Statistical Computations at FreeStatistics.org, Office for Research Development and Education, URL https://freestatistics.org/blog/index.php?pk=301623, Retrieved Sun, 28 Apr 2024 17:35:11 +0000
QR Codes:

Original text written by user:
IsPrivate?No (this computation is public)
User-defined keywords
Estimated Impact43
Family? (F = Feedback message, R = changed R code, M = changed R Module, P = changed Parameters, D = changed Data)
-       [(Partial) Autocorrelation Function] [] [2016-12-20 12:12:00] [361c8dad91b3f1ef2e651cd04783c23b] [Current]
Feedback Forum

Post a new message
Dataseries X:
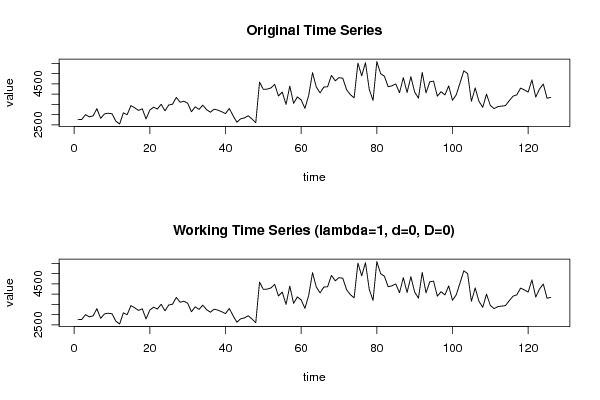
2755
2765
3000
2890
2940
3290
2815
3035
3070
3040
2685
2540
3090
2995
3440
3335
3205
3285
2790
3225
3360
3275
3505
3185
3470
3510
3840
3605
3655
3555
3140
3380
3255
3460
3245
3120
3265
3220
3140
3050
3300
2950
2630
2795
2840
2945
2790
2605
4590
4230
4245
4300
4475
3910
4100
3500
4390
3550
3865
3715
3310
3945
5050
4350
4060
4345
4360
4915
4650
4805
4775
4220
3975
3820
5515
4895
5535
4230
3695
5590
5000
4875
4360
4405
4500
4070
4800
4080
4850
4105
3805
5060
4060
4600
4635
3900
4120
3960
4400
3700
3970
4550
5140
5000
3650
4300
3650
3355
4000
3450
3295
3390
3415
3440
3680
3900
3965
4295
4210
4100
4690
3860
4250
4495
3800
3845


Summary of computational transaction
Raw Input view raw input (R code)
Raw Outputview raw output of R engine
Computing time1 seconds
R ServerBig Analytics Cloud Computing Center

\begin{tabular}{lllllllll}
\hline
Summary of computational transaction \tabularnewline
Raw Input view raw input (R code)  \tabularnewline
Raw Outputview raw output of R engine  \tabularnewline
Computing time1 seconds \tabularnewline
R ServerBig Analytics Cloud Computing Center \tabularnewline
\hline
\end{tabular}
%Source: https://freestatistics.org/blog/index.php?pk=301623&T=0

[TABLE]
[ROW]
Summary of computational transaction[/C][/ROW] [ROW]Raw Input[/C] view raw input (R code) [/C][/ROW] [ROW]Raw Output[/C]view raw output of R engine [/C][/ROW] [ROW]Computing time[/C]1 seconds[/C][/ROW] [ROW]R Server[/C]Big Analytics Cloud Computing Center[/C][/ROW] [/TABLE] Source: https://freestatistics.org/blog/index.php?pk=301623&T=0

Globally Unique Identifier (entire table): ba.freestatistics.org/blog/index.php?pk=301623&T=0

As an alternative you can also use a QR Code:  

The GUIDs for individual cells are displayed in the table below:

Summary of computational transaction
Raw Input view raw input (R code)
Raw Outputview raw output of R engine
Computing time1 seconds
R ServerBig Analytics Cloud Computing Center


Autocorrelation Function
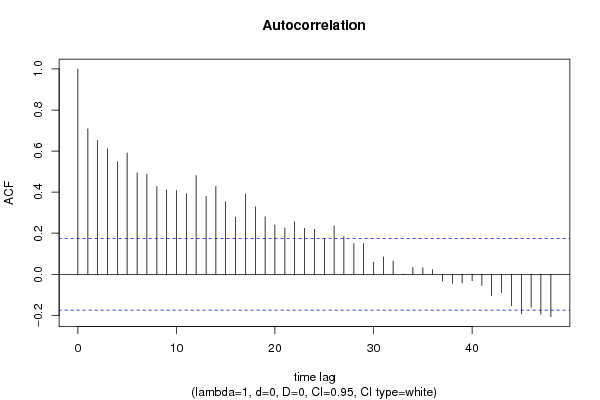
Time lag kACF(k)T-STATP-value
10.7082087.94960
20.6517887.31630
30.6114956.8640
40.5479786.1510
50.590526.62860
60.4939715.54480
70.4872935.46980
80.4272484.79582e-06
90.4101544.6045e-06
100.4072874.57186e-06
110.3927524.40861.1e-05
120.4804895.39350
130.3796514.26162e-05
140.4291914.81772e-06
150.3528883.96126.2e-05
160.2787083.12850.001092
170.3914564.39411.2e-05
180.328813.69090.000166
190.2806253.150.00102
200.2395162.68860.004073
210.2252592.52850.006345
220.255162.86420.00245
230.2237152.51120.006649
240.2195162.46410.007543
250.1747671.96180.025998
260.2349572.63740.004703
270.1841382.06690.020394
280.1499681.68340.047388
290.1488311.67060.048639
300.0583960.65550.256674
310.0842870.94610.17295
320.0643130.72190.235843
33-0.002489-0.02790.488879
340.0334870.37590.353816
350.031610.35480.361659
360.0220120.24710.402621
37-0.03222-0.36170.359101
38-0.044503-0.49950.309132
39-0.042044-0.47190.318891
40-0.030958-0.34750.364398
41-0.054396-0.61060.271286
42-0.104396-1.17180.121736
43-0.088715-0.99580.160623
44-0.153593-1.72410.043573
45-0.192352-2.15910.016367
46-0.161011-1.80730.036547
47-0.195056-2.18950.015201
48-0.206365-2.31640.011074

\begin{tabular}{lllllllll}
\hline
Autocorrelation Function \tabularnewline
Time lag k & ACF(k) & T-STAT & P-value \tabularnewline
1 & 0.708208 & 7.9496 & 0 \tabularnewline
2 & 0.651788 & 7.3163 & 0 \tabularnewline
3 & 0.611495 & 6.864 & 0 \tabularnewline
4 & 0.547978 & 6.151 & 0 \tabularnewline
5 & 0.59052 & 6.6286 & 0 \tabularnewline
6 & 0.493971 & 5.5448 & 0 \tabularnewline
7 & 0.487293 & 5.4698 & 0 \tabularnewline
8 & 0.427248 & 4.7958 & 2e-06 \tabularnewline
9 & 0.410154 & 4.604 & 5e-06 \tabularnewline
10 & 0.407287 & 4.5718 & 6e-06 \tabularnewline
11 & 0.392752 & 4.4086 & 1.1e-05 \tabularnewline
12 & 0.480489 & 5.3935 & 0 \tabularnewline
13 & 0.379651 & 4.2616 & 2e-05 \tabularnewline
14 & 0.429191 & 4.8177 & 2e-06 \tabularnewline
15 & 0.352888 & 3.9612 & 6.2e-05 \tabularnewline
16 & 0.278708 & 3.1285 & 0.001092 \tabularnewline
17 & 0.391456 & 4.3941 & 1.2e-05 \tabularnewline
18 & 0.32881 & 3.6909 & 0.000166 \tabularnewline
19 & 0.280625 & 3.15 & 0.00102 \tabularnewline
20 & 0.239516 & 2.6886 & 0.004073 \tabularnewline
21 & 0.225259 & 2.5285 & 0.006345 \tabularnewline
22 & 0.25516 & 2.8642 & 0.00245 \tabularnewline
23 & 0.223715 & 2.5112 & 0.006649 \tabularnewline
24 & 0.219516 & 2.4641 & 0.007543 \tabularnewline
25 & 0.174767 & 1.9618 & 0.025998 \tabularnewline
26 & 0.234957 & 2.6374 & 0.004703 \tabularnewline
27 & 0.184138 & 2.0669 & 0.020394 \tabularnewline
28 & 0.149968 & 1.6834 & 0.047388 \tabularnewline
29 & 0.148831 & 1.6706 & 0.048639 \tabularnewline
30 & 0.058396 & 0.6555 & 0.256674 \tabularnewline
31 & 0.084287 & 0.9461 & 0.17295 \tabularnewline
32 & 0.064313 & 0.7219 & 0.235843 \tabularnewline
33 & -0.002489 & -0.0279 & 0.488879 \tabularnewline
34 & 0.033487 & 0.3759 & 0.353816 \tabularnewline
35 & 0.03161 & 0.3548 & 0.361659 \tabularnewline
36 & 0.022012 & 0.2471 & 0.402621 \tabularnewline
37 & -0.03222 & -0.3617 & 0.359101 \tabularnewline
38 & -0.044503 & -0.4995 & 0.309132 \tabularnewline
39 & -0.042044 & -0.4719 & 0.318891 \tabularnewline
40 & -0.030958 & -0.3475 & 0.364398 \tabularnewline
41 & -0.054396 & -0.6106 & 0.271286 \tabularnewline
42 & -0.104396 & -1.1718 & 0.121736 \tabularnewline
43 & -0.088715 & -0.9958 & 0.160623 \tabularnewline
44 & -0.153593 & -1.7241 & 0.043573 \tabularnewline
45 & -0.192352 & -2.1591 & 0.016367 \tabularnewline
46 & -0.161011 & -1.8073 & 0.036547 \tabularnewline
47 & -0.195056 & -2.1895 & 0.015201 \tabularnewline
48 & -0.206365 & -2.3164 & 0.011074 \tabularnewline
\hline
\end{tabular}
%Source: https://freestatistics.org/blog/index.php?pk=301623&T=1

[TABLE]
[ROW][C]Autocorrelation Function[/C][/ROW]
[ROW][C]Time lag k[/C][C]ACF(k)[/C][C]T-STAT[/C][C]P-value[/C][/ROW]
[ROW][C]1[/C][C]0.708208[/C][C]7.9496[/C][C]0[/C][/ROW]
[ROW][C]2[/C][C]0.651788[/C][C]7.3163[/C][C]0[/C][/ROW]
[ROW][C]3[/C][C]0.611495[/C][C]6.864[/C][C]0[/C][/ROW]
[ROW][C]4[/C][C]0.547978[/C][C]6.151[/C][C]0[/C][/ROW]
[ROW][C]5[/C][C]0.59052[/C][C]6.6286[/C][C]0[/C][/ROW]
[ROW][C]6[/C][C]0.493971[/C][C]5.5448[/C][C]0[/C][/ROW]
[ROW][C]7[/C][C]0.487293[/C][C]5.4698[/C][C]0[/C][/ROW]
[ROW][C]8[/C][C]0.427248[/C][C]4.7958[/C][C]2e-06[/C][/ROW]
[ROW][C]9[/C][C]0.410154[/C][C]4.604[/C][C]5e-06[/C][/ROW]
[ROW][C]10[/C][C]0.407287[/C][C]4.5718[/C][C]6e-06[/C][/ROW]
[ROW][C]11[/C][C]0.392752[/C][C]4.4086[/C][C]1.1e-05[/C][/ROW]
[ROW][C]12[/C][C]0.480489[/C][C]5.3935[/C][C]0[/C][/ROW]
[ROW][C]13[/C][C]0.379651[/C][C]4.2616[/C][C]2e-05[/C][/ROW]
[ROW][C]14[/C][C]0.429191[/C][C]4.8177[/C][C]2e-06[/C][/ROW]
[ROW][C]15[/C][C]0.352888[/C][C]3.9612[/C][C]6.2e-05[/C][/ROW]
[ROW][C]16[/C][C]0.278708[/C][C]3.1285[/C][C]0.001092[/C][/ROW]
[ROW][C]17[/C][C]0.391456[/C][C]4.3941[/C][C]1.2e-05[/C][/ROW]
[ROW][C]18[/C][C]0.32881[/C][C]3.6909[/C][C]0.000166[/C][/ROW]
[ROW][C]19[/C][C]0.280625[/C][C]3.15[/C][C]0.00102[/C][/ROW]
[ROW][C]20[/C][C]0.239516[/C][C]2.6886[/C][C]0.004073[/C][/ROW]
[ROW][C]21[/C][C]0.225259[/C][C]2.5285[/C][C]0.006345[/C][/ROW]
[ROW][C]22[/C][C]0.25516[/C][C]2.8642[/C][C]0.00245[/C][/ROW]
[ROW][C]23[/C][C]0.223715[/C][C]2.5112[/C][C]0.006649[/C][/ROW]
[ROW][C]24[/C][C]0.219516[/C][C]2.4641[/C][C]0.007543[/C][/ROW]
[ROW][C]25[/C][C]0.174767[/C][C]1.9618[/C][C]0.025998[/C][/ROW]
[ROW][C]26[/C][C]0.234957[/C][C]2.6374[/C][C]0.004703[/C][/ROW]
[ROW][C]27[/C][C]0.184138[/C][C]2.0669[/C][C]0.020394[/C][/ROW]
[ROW][C]28[/C][C]0.149968[/C][C]1.6834[/C][C]0.047388[/C][/ROW]
[ROW][C]29[/C][C]0.148831[/C][C]1.6706[/C][C]0.048639[/C][/ROW]
[ROW][C]30[/C][C]0.058396[/C][C]0.6555[/C][C]0.256674[/C][/ROW]
[ROW][C]31[/C][C]0.084287[/C][C]0.9461[/C][C]0.17295[/C][/ROW]
[ROW][C]32[/C][C]0.064313[/C][C]0.7219[/C][C]0.235843[/C][/ROW]
[ROW][C]33[/C][C]-0.002489[/C][C]-0.0279[/C][C]0.488879[/C][/ROW]
[ROW][C]34[/C][C]0.033487[/C][C]0.3759[/C][C]0.353816[/C][/ROW]
[ROW][C]35[/C][C]0.03161[/C][C]0.3548[/C][C]0.361659[/C][/ROW]
[ROW][C]36[/C][C]0.022012[/C][C]0.2471[/C][C]0.402621[/C][/ROW]
[ROW][C]37[/C][C]-0.03222[/C][C]-0.3617[/C][C]0.359101[/C][/ROW]
[ROW][C]38[/C][C]-0.044503[/C][C]-0.4995[/C][C]0.309132[/C][/ROW]
[ROW][C]39[/C][C]-0.042044[/C][C]-0.4719[/C][C]0.318891[/C][/ROW]
[ROW][C]40[/C][C]-0.030958[/C][C]-0.3475[/C][C]0.364398[/C][/ROW]
[ROW][C]41[/C][C]-0.054396[/C][C]-0.6106[/C][C]0.271286[/C][/ROW]
[ROW][C]42[/C][C]-0.104396[/C][C]-1.1718[/C][C]0.121736[/C][/ROW]
[ROW][C]43[/C][C]-0.088715[/C][C]-0.9958[/C][C]0.160623[/C][/ROW]
[ROW][C]44[/C][C]-0.153593[/C][C]-1.7241[/C][C]0.043573[/C][/ROW]
[ROW][C]45[/C][C]-0.192352[/C][C]-2.1591[/C][C]0.016367[/C][/ROW]
[ROW][C]46[/C][C]-0.161011[/C][C]-1.8073[/C][C]0.036547[/C][/ROW]
[ROW][C]47[/C][C]-0.195056[/C][C]-2.1895[/C][C]0.015201[/C][/ROW]
[ROW][C]48[/C][C]-0.206365[/C][C]-2.3164[/C][C]0.011074[/C][/ROW]
[/TABLE]
Source: https://freestatistics.org/blog/index.php?pk=301623&T=1

Globally Unique Identifier (entire table): ba.freestatistics.org/blog/index.php?pk=301623&T=1

As an alternative you can also use a QR Code:  

The GUIDs for individual cells are displayed in the table below:

Autocorrelation Function
Time lag kACF(k)T-STATP-value
10.7082087.94960
20.6517887.31630
30.6114956.8640
40.5479786.1510
50.590526.62860
60.4939715.54480
70.4872935.46980
80.4272484.79582e-06
90.4101544.6045e-06
100.4072874.57186e-06
110.3927524.40861.1e-05
120.4804895.39350
130.3796514.26162e-05
140.4291914.81772e-06
150.3528883.96126.2e-05
160.2787083.12850.001092
170.3914564.39411.2e-05
180.328813.69090.000166
190.2806253.150.00102
200.2395162.68860.004073
210.2252592.52850.006345
220.255162.86420.00245
230.2237152.51120.006649
240.2195162.46410.007543
250.1747671.96180.025998
260.2349572.63740.004703
270.1841382.06690.020394
280.1499681.68340.047388
290.1488311.67060.048639
300.0583960.65550.256674
310.0842870.94610.17295
320.0643130.72190.235843
33-0.002489-0.02790.488879
340.0334870.37590.353816
350.031610.35480.361659
360.0220120.24710.402621
37-0.03222-0.36170.359101
38-0.044503-0.49950.309132
39-0.042044-0.47190.318891
40-0.030958-0.34750.364398
41-0.054396-0.61060.271286
42-0.104396-1.17180.121736
43-0.088715-0.99580.160623
44-0.153593-1.72410.043573
45-0.192352-2.15910.016367
46-0.161011-1.80730.036547
47-0.195056-2.18950.015201
48-0.206365-2.31640.011074


Partial Autocorrelation Function
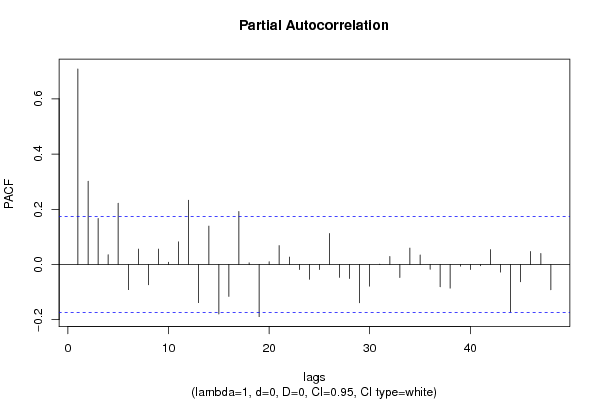
Time lag kPACF(k)T-STATP-value
10.7082087.94960
20.30143.38320.000478
30.1667541.87180.031776
40.0349560.39240.347719
50.2219172.4910.007019
6-0.091209-1.02380.153942
70.0555770.62380.266928
8-0.073225-0.82190.20633
90.0557040.62530.26646
100.0083190.09340.462875
110.0818020.91820.180129
120.2329292.61460.005011
13-0.138379-1.55330.06143
140.1389481.55970.060671
15-0.179724-2.01740.022889
16-0.115573-1.29730.098449
170.1921032.15630.016478
180.005820.06530.474008
19-0.189054-2.12210.017892
200.0099760.1120.455508
210.0683150.76680.222307
220.0266290.29890.382752
23-0.018438-0.2070.418185
24-0.05347-0.60020.274726
25-0.018002-0.20210.420093
260.1122681.26020.104963
27-0.046841-0.52580.299978
28-0.050964-0.57210.284148
29-0.138988-1.56010.060618
30-0.078536-0.88160.189844
310.0011170.01250.49501
320.0286590.32170.37411
33-0.046968-0.52720.299485
340.0591210.66360.254069
350.0342080.3840.350818
36-0.017199-0.19310.42361
37-0.080925-0.90840.182706
38-0.085818-0.96330.16862
39-0.006018-0.06750.473125
40-0.018096-0.20310.419683
41-0.004733-0.05310.478858
420.0536560.60230.274034
43-0.027668-0.31060.378319
44-0.171957-1.93020.027914
45-0.062707-0.70390.2414
460.0469110.52660.299707
470.0398920.44780.327539
48-0.091392-1.02590.153457

\begin{tabular}{lllllllll}
\hline
Partial Autocorrelation Function \tabularnewline
Time lag k & PACF(k) & T-STAT & P-value \tabularnewline
1 & 0.708208 & 7.9496 & 0 \tabularnewline
2 & 0.3014 & 3.3832 & 0.000478 \tabularnewline
3 & 0.166754 & 1.8718 & 0.031776 \tabularnewline
4 & 0.034956 & 0.3924 & 0.347719 \tabularnewline
5 & 0.221917 & 2.491 & 0.007019 \tabularnewline
6 & -0.091209 & -1.0238 & 0.153942 \tabularnewline
7 & 0.055577 & 0.6238 & 0.266928 \tabularnewline
8 & -0.073225 & -0.8219 & 0.20633 \tabularnewline
9 & 0.055704 & 0.6253 & 0.26646 \tabularnewline
10 & 0.008319 & 0.0934 & 0.462875 \tabularnewline
11 & 0.081802 & 0.9182 & 0.180129 \tabularnewline
12 & 0.232929 & 2.6146 & 0.005011 \tabularnewline
13 & -0.138379 & -1.5533 & 0.06143 \tabularnewline
14 & 0.138948 & 1.5597 & 0.060671 \tabularnewline
15 & -0.179724 & -2.0174 & 0.022889 \tabularnewline
16 & -0.115573 & -1.2973 & 0.098449 \tabularnewline
17 & 0.192103 & 2.1563 & 0.016478 \tabularnewline
18 & 0.00582 & 0.0653 & 0.474008 \tabularnewline
19 & -0.189054 & -2.1221 & 0.017892 \tabularnewline
20 & 0.009976 & 0.112 & 0.455508 \tabularnewline
21 & 0.068315 & 0.7668 & 0.222307 \tabularnewline
22 & 0.026629 & 0.2989 & 0.382752 \tabularnewline
23 & -0.018438 & -0.207 & 0.418185 \tabularnewline
24 & -0.05347 & -0.6002 & 0.274726 \tabularnewline
25 & -0.018002 & -0.2021 & 0.420093 \tabularnewline
26 & 0.112268 & 1.2602 & 0.104963 \tabularnewline
27 & -0.046841 & -0.5258 & 0.299978 \tabularnewline
28 & -0.050964 & -0.5721 & 0.284148 \tabularnewline
29 & -0.138988 & -1.5601 & 0.060618 \tabularnewline
30 & -0.078536 & -0.8816 & 0.189844 \tabularnewline
31 & 0.001117 & 0.0125 & 0.49501 \tabularnewline
32 & 0.028659 & 0.3217 & 0.37411 \tabularnewline
33 & -0.046968 & -0.5272 & 0.299485 \tabularnewline
34 & 0.059121 & 0.6636 & 0.254069 \tabularnewline
35 & 0.034208 & 0.384 & 0.350818 \tabularnewline
36 & -0.017199 & -0.1931 & 0.42361 \tabularnewline
37 & -0.080925 & -0.9084 & 0.182706 \tabularnewline
38 & -0.085818 & -0.9633 & 0.16862 \tabularnewline
39 & -0.006018 & -0.0675 & 0.473125 \tabularnewline
40 & -0.018096 & -0.2031 & 0.419683 \tabularnewline
41 & -0.004733 & -0.0531 & 0.478858 \tabularnewline
42 & 0.053656 & 0.6023 & 0.274034 \tabularnewline
43 & -0.027668 & -0.3106 & 0.378319 \tabularnewline
44 & -0.171957 & -1.9302 & 0.027914 \tabularnewline
45 & -0.062707 & -0.7039 & 0.2414 \tabularnewline
46 & 0.046911 & 0.5266 & 0.299707 \tabularnewline
47 & 0.039892 & 0.4478 & 0.327539 \tabularnewline
48 & -0.091392 & -1.0259 & 0.153457 \tabularnewline
\hline
\end{tabular}
%Source: https://freestatistics.org/blog/index.php?pk=301623&T=2

[TABLE]
[ROW][C]Partial Autocorrelation Function[/C][/ROW]
[ROW][C]Time lag k[/C][C]PACF(k)[/C][C]T-STAT[/C][C]P-value[/C][/ROW]
[ROW][C]1[/C][C]0.708208[/C][C]7.9496[/C][C]0[/C][/ROW]
[ROW][C]2[/C][C]0.3014[/C][C]3.3832[/C][C]0.000478[/C][/ROW]
[ROW][C]3[/C][C]0.166754[/C][C]1.8718[/C][C]0.031776[/C][/ROW]
[ROW][C]4[/C][C]0.034956[/C][C]0.3924[/C][C]0.347719[/C][/ROW]
[ROW][C]5[/C][C]0.221917[/C][C]2.491[/C][C]0.007019[/C][/ROW]
[ROW][C]6[/C][C]-0.091209[/C][C]-1.0238[/C][C]0.153942[/C][/ROW]
[ROW][C]7[/C][C]0.055577[/C][C]0.6238[/C][C]0.266928[/C][/ROW]
[ROW][C]8[/C][C]-0.073225[/C][C]-0.8219[/C][C]0.20633[/C][/ROW]
[ROW][C]9[/C][C]0.055704[/C][C]0.6253[/C][C]0.26646[/C][/ROW]
[ROW][C]10[/C][C]0.008319[/C][C]0.0934[/C][C]0.462875[/C][/ROW]
[ROW][C]11[/C][C]0.081802[/C][C]0.9182[/C][C]0.180129[/C][/ROW]
[ROW][C]12[/C][C]0.232929[/C][C]2.6146[/C][C]0.005011[/C][/ROW]
[ROW][C]13[/C][C]-0.138379[/C][C]-1.5533[/C][C]0.06143[/C][/ROW]
[ROW][C]14[/C][C]0.138948[/C][C]1.5597[/C][C]0.060671[/C][/ROW]
[ROW][C]15[/C][C]-0.179724[/C][C]-2.0174[/C][C]0.022889[/C][/ROW]
[ROW][C]16[/C][C]-0.115573[/C][C]-1.2973[/C][C]0.098449[/C][/ROW]
[ROW][C]17[/C][C]0.192103[/C][C]2.1563[/C][C]0.016478[/C][/ROW]
[ROW][C]18[/C][C]0.00582[/C][C]0.0653[/C][C]0.474008[/C][/ROW]
[ROW][C]19[/C][C]-0.189054[/C][C]-2.1221[/C][C]0.017892[/C][/ROW]
[ROW][C]20[/C][C]0.009976[/C][C]0.112[/C][C]0.455508[/C][/ROW]
[ROW][C]21[/C][C]0.068315[/C][C]0.7668[/C][C]0.222307[/C][/ROW]
[ROW][C]22[/C][C]0.026629[/C][C]0.2989[/C][C]0.382752[/C][/ROW]
[ROW][C]23[/C][C]-0.018438[/C][C]-0.207[/C][C]0.418185[/C][/ROW]
[ROW][C]24[/C][C]-0.05347[/C][C]-0.6002[/C][C]0.274726[/C][/ROW]
[ROW][C]25[/C][C]-0.018002[/C][C]-0.2021[/C][C]0.420093[/C][/ROW]
[ROW][C]26[/C][C]0.112268[/C][C]1.2602[/C][C]0.104963[/C][/ROW]
[ROW][C]27[/C][C]-0.046841[/C][C]-0.5258[/C][C]0.299978[/C][/ROW]
[ROW][C]28[/C][C]-0.050964[/C][C]-0.5721[/C][C]0.284148[/C][/ROW]
[ROW][C]29[/C][C]-0.138988[/C][C]-1.5601[/C][C]0.060618[/C][/ROW]
[ROW][C]30[/C][C]-0.078536[/C][C]-0.8816[/C][C]0.189844[/C][/ROW]
[ROW][C]31[/C][C]0.001117[/C][C]0.0125[/C][C]0.49501[/C][/ROW]
[ROW][C]32[/C][C]0.028659[/C][C]0.3217[/C][C]0.37411[/C][/ROW]
[ROW][C]33[/C][C]-0.046968[/C][C]-0.5272[/C][C]0.299485[/C][/ROW]
[ROW][C]34[/C][C]0.059121[/C][C]0.6636[/C][C]0.254069[/C][/ROW]
[ROW][C]35[/C][C]0.034208[/C][C]0.384[/C][C]0.350818[/C][/ROW]
[ROW][C]36[/C][C]-0.017199[/C][C]-0.1931[/C][C]0.42361[/C][/ROW]
[ROW][C]37[/C][C]-0.080925[/C][C]-0.9084[/C][C]0.182706[/C][/ROW]
[ROW][C]38[/C][C]-0.085818[/C][C]-0.9633[/C][C]0.16862[/C][/ROW]
[ROW][C]39[/C][C]-0.006018[/C][C]-0.0675[/C][C]0.473125[/C][/ROW]
[ROW][C]40[/C][C]-0.018096[/C][C]-0.2031[/C][C]0.419683[/C][/ROW]
[ROW][C]41[/C][C]-0.004733[/C][C]-0.0531[/C][C]0.478858[/C][/ROW]
[ROW][C]42[/C][C]0.053656[/C][C]0.6023[/C][C]0.274034[/C][/ROW]
[ROW][C]43[/C][C]-0.027668[/C][C]-0.3106[/C][C]0.378319[/C][/ROW]
[ROW][C]44[/C][C]-0.171957[/C][C]-1.9302[/C][C]0.027914[/C][/ROW]
[ROW][C]45[/C][C]-0.062707[/C][C]-0.7039[/C][C]0.2414[/C][/ROW]
[ROW][C]46[/C][C]0.046911[/C][C]0.5266[/C][C]0.299707[/C][/ROW]
[ROW][C]47[/C][C]0.039892[/C][C]0.4478[/C][C]0.327539[/C][/ROW]
[ROW][C]48[/C][C]-0.091392[/C][C]-1.0259[/C][C]0.153457[/C][/ROW]
[/TABLE]
Source: https://freestatistics.org/blog/index.php?pk=301623&T=2

Globally Unique Identifier (entire table): ba.freestatistics.org/blog/index.php?pk=301623&T=2

As an alternative you can also use a QR Code:  

The GUIDs for individual cells are displayed in the table below:

Partial Autocorrelation Function
Time lag kPACF(k)T-STATP-value
10.7082087.94960
20.30143.38320.000478
30.1667541.87180.031776
40.0349560.39240.347719
50.2219172.4910.007019
6-0.091209-1.02380.153942
70.0555770.62380.266928
8-0.073225-0.82190.20633
90.0557040.62530.26646
100.0083190.09340.462875
110.0818020.91820.180129
120.2329292.61460.005011
13-0.138379-1.55330.06143
140.1389481.55970.060671
15-0.179724-2.01740.022889
16-0.115573-1.29730.098449
170.1921032.15630.016478
180.005820.06530.474008
19-0.189054-2.12210.017892
200.0099760.1120.455508
210.0683150.76680.222307
220.0266290.29890.382752
23-0.018438-0.2070.418185
24-0.05347-0.60020.274726
25-0.018002-0.20210.420093
260.1122681.26020.104963
27-0.046841-0.52580.299978
28-0.050964-0.57210.284148
29-0.138988-1.56010.060618
30-0.078536-0.88160.189844
310.0011170.01250.49501
320.0286590.32170.37411
33-0.046968-0.52720.299485
340.0591210.66360.254069
350.0342080.3840.350818
36-0.017199-0.19310.42361
37-0.080925-0.90840.182706
38-0.085818-0.96330.16862
39-0.006018-0.06750.473125
40-0.018096-0.20310.419683
41-0.004733-0.05310.478858
420.0536560.60230.274034
43-0.027668-0.31060.378319
44-0.171957-1.93020.027914
45-0.062707-0.70390.2414
460.0469110.52660.299707
470.0398920.44780.327539
48-0.091392-1.02590.153457


Parameters (Session):
par1 = 48 ; par2 = 1 ; par3 = 0 ; par4 = 0 ; par5 = 12 ; par6 = White Noise ; par7 = 0.95 ;
Parameters (R input):
par1 = 48 ; par2 = 1 ; par3 = 0 ; par4 = 0 ; par5 = 12 ; par6 = White Noise ; par7 = 0.95 ; par8 = ;
R code (references can be found in the software module):
if (par1 == 'Default') {
par1 = 10*log10(length(x))
} else {
par1 <- as.numeric(par1)
}
par2 <- as.numeric(par2)
par3 <- as.numeric(par3)
par4 <- as.numeric(par4)
par5 <- as.numeric(par5)
if (par6 == 'White Noise') par6 <- 'white' else par6 <- 'ma'
par7 <- as.numeric(par7)
if (par8 != '') par8 <- as.numeric(par8)
x <- na.omit(x)
ox <- x
if (par8 == '') {
if (par2 == 0) {
x <- log(x)
} else {
x <- (x ^ par2 - 1) / par2
}
} else {
x <- log(x,base=par8)
}
if (par3 > 0) x <- diff(x,lag=1,difference=par3)
if (par4 > 0) x <- diff(x,lag=par5,difference=par4)
bitmap(file='picts.png')
op <- par(mfrow=c(2,1))
plot(ox,type='l',main='Original Time Series',xlab='time',ylab='value')
if (par8=='') {
mytitle <- paste('Working Time Series (lambda=',par2,', d=',par3,', D=',par4,')',sep='')
mysub <- paste('(lambda=',par2,', d=',par3,', D=',par4,', CI=', par7, ', CI type=',par6,')',sep='')
} else {
mytitle <- paste('Working Time Series (base=',par8,', d=',par3,', D=',par4,')',sep='')
mysub <- paste('(base=',par8,', d=',par3,', D=',par4,', CI=', par7, ', CI type=',par6,')',sep='')
}
plot(x,type='l', main=mytitle,xlab='time',ylab='value')
par(op)
dev.off()
bitmap(file='pic1.png')
racf <- acf(x, par1, main='Autocorrelation', xlab='time lag', ylab='ACF', ci.type=par6, ci=par7, sub=mysub)
dev.off()
bitmap(file='pic2.png')
rpacf <- pacf(x,par1,main='Partial Autocorrelation',xlab='lags',ylab='PACF',sub=mysub)
dev.off()
(myacf <- c(racf$acf))
(mypacf <- c(rpacf$acf))
lengthx <- length(x)
sqrtn <- sqrt(lengthx)
load(file='createtable')
a<-table.start()
a<-table.row.start(a)
a<-table.element(a,'Autocorrelation Function',4,TRUE)
a<-table.row.end(a)
a<-table.row.start(a)
a<-table.element(a,'Time lag k',header=TRUE)
a<-table.element(a,'ACF(k)',header=TRUE)
a<-table.element(a,'T-STAT',header=TRUE)
a<-table.element(a,'P-value',header=TRUE)
a<-table.row.end(a)
for (i in 2:(par1+1)) {
a<-table.row.start(a)
a<-table.element(a,i-1,header=TRUE)
a<-table.element(a,round(myacf[i],6))
mytstat <- myacf[i]*sqrtn
a<-table.element(a,round(mytstat,4))
a<-table.element(a,round(1-pt(abs(mytstat),lengthx),6))
a<-table.row.end(a)
}
a<-table.end(a)
table.save(a,file='mytable.tab')
a<-table.start()
a<-table.row.start(a)
a<-table.element(a,'Partial Autocorrelation Function',4,TRUE)
a<-table.row.end(a)
a<-table.row.start(a)
a<-table.element(a,'Time lag k',header=TRUE)
a<-table.element(a,'PACF(k)',header=TRUE)
a<-table.element(a,'T-STAT',header=TRUE)
a<-table.element(a,'P-value',header=TRUE)
a<-table.row.end(a)
for (i in 1:par1) {
a<-table.row.start(a)
a<-table.element(a,i,header=TRUE)
a<-table.element(a,round(mypacf[i],6))
mytstat <- mypacf[i]*sqrtn
a<-table.element(a,round(mytstat,4))
a<-table.element(a,round(1-pt(abs(mytstat),lengthx),6))
a<-table.row.end(a)
}
a<-table.end(a)
table.save(a,file='mytable1.tab')