Free Statistics

of Irreproducible Research!

Author's title

Author*The author of this computation has been verified*
R Software Modulerwasp_exponentialsmoothing.wasp
Title produced by softwareExponential Smoothing
Date of computationTue, 20 Dec 2016 14:32:05 +0100
Cite this page as followsStatistical Computations at FreeStatistics.org, Office for Research Development and Education, URL https://freestatistics.org/blog/index.php?v=date/2016/Dec/20/t1482240747yigjv2r2a3g5vph.htm/, Retrieved Sat, 27 Apr 2024 20:49:43 +0000
Statistical Computations at FreeStatistics.org, Office for Research Development and Education, URL https://freestatistics.org/blog/index.php?pk=301658, Retrieved Sat, 27 Apr 2024 20:49:43 +0000
QR Codes:

Original text written by user:
IsPrivate?No (this computation is public)
User-defined keywords
Estimated Impact54
Family? (F = Feedback message, R = changed R code, M = changed R Module, P = changed Parameters, D = changed Data)
-       [Exponential Smoothing] [ES 3] [2016-12-20 13:32:05] [94c1b173d9287822f5e2740a4a602bdd] [Current]
Feedback Forum

Post a new message
Dataseries X:
4450
4400
4650
4800
4800
4750
5200
5050
4900
5300
5500
6050
5200
5350
5450
5900
5800
5950
6750
6500
6500
7100
7100
8400
6900
7400
7650
7850
7750
8000
8950
9100
9100
10050
10450
11900
10000
11250
11250
11650
11550
11800
13050
12350
12200
13450
13450
14450
12500
13350
13600
13200
13450
13600
14450
14000
13600
14700
14450
15250
13750
14450
14300
14600
14700
14600


Summary of computational transaction
Raw Input view raw input (R code)
Raw Outputview raw output of R engine
Computing time1 seconds
R ServerBig Analytics Cloud Computing Center

\begin{tabular}{lllllllll}
\hline
Summary of computational transaction \tabularnewline
Raw Input view raw input (R code)  \tabularnewline
Raw Outputview raw output of R engine  \tabularnewline
Computing time1 seconds \tabularnewline
R ServerBig Analytics Cloud Computing Center \tabularnewline
\hline
\end{tabular}
%Source: https://freestatistics.org/blog/index.php?pk=301658&T=0

[TABLE]
[ROW]
Summary of computational transaction[/C][/ROW] [ROW]Raw Input[/C] view raw input (R code) [/C][/ROW] [ROW]Raw Output[/C]view raw output of R engine [/C][/ROW] [ROW]Computing time[/C]1 seconds[/C][/ROW] [ROW]R Server[/C]Big Analytics Cloud Computing Center[/C][/ROW] [/TABLE] Source: https://freestatistics.org/blog/index.php?pk=301658&T=0

Globally Unique Identifier (entire table): ba.freestatistics.org/blog/index.php?pk=301658&T=0

As an alternative you can also use a QR Code:  

The GUIDs for individual cells are displayed in the table below:

Summary of computational transaction
Raw Input view raw input (R code)
Raw Outputview raw output of R engine
Computing time1 seconds
R ServerBig Analytics Cloud Computing Center


Estimated Parameters of Exponential Smoothing
ParameterValue
alpha0.227127768459855
beta1
gamma0.755773986257052

\begin{tabular}{lllllllll}
\hline
Estimated Parameters of Exponential Smoothing \tabularnewline
Parameter & Value \tabularnewline
alpha & 0.227127768459855 \tabularnewline
beta & 1 \tabularnewline
gamma & 0.755773986257052 \tabularnewline
\hline
\end{tabular}
%Source: https://freestatistics.org/blog/index.php?pk=301658&T=1

[TABLE]
[ROW][C]Estimated Parameters of Exponential Smoothing[/C][/ROW]
[ROW][C]Parameter[/C][C]Value[/C][/ROW]
[ROW][C]alpha[/C][C]0.227127768459855[/C][/ROW]
[ROW][C]beta[/C][C]1[/C][/ROW]
[ROW][C]gamma[/C][C]0.755773986257052[/C][/ROW]
[/TABLE]
Source: https://freestatistics.org/blog/index.php?pk=301658&T=1

Globally Unique Identifier (entire table): ba.freestatistics.org/blog/index.php?pk=301658&T=1

As an alternative you can also use a QR Code:  

The GUIDs for individual cells are displayed in the table below:

Estimated Parameters of Exponential Smoothing
ParameterValue
alpha0.227127768459855
beta1
gamma0.755773986257052


Interpolation Forecasts of Exponential Smoothing
tObservedFittedResiduals
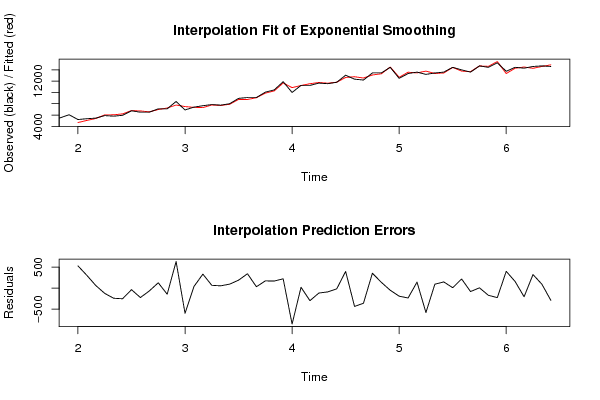
1352004669.7516025641530.248397435896
1453505045.47564227293304.524357727069
1554505387.0140890338462.9859109661638
1659006023.4149634535-123.414963453501
1758006039.44805798351-239.448057983514
1859506201.82484494693-251.824844946926
1967506785.44410483109-35.44410483109
2065006722.65909892011-222.659098920115
2165006564.69697158113-64.6969715811329
2271006971.66795094449128.332049055508
2371007243.29561960357-143.295619603569
2484007766.51602105086633.483978949142
2569007496.85673369521-596.856733695207
2674007360.1973552374139.8026447625898
2776507315.86049353674334.139506463259
2878507781.8915118407168.1084881592851
2977507694.071824841455.9281751585986
3080007903.8192086218896.1807913781167
3189508759.42550587582190.574494124185
3291008756.50897435155343.491025648453
3391009065.8807807080334.119219291968
34100509876.9682401513173.031759848698
351045010279.1598344273170.840165572661
361190011677.8817574889222.118242511056
371000010853.1173209204-853.117320920361
381125011228.923567426921.0764325731161
391125011546.7934322698-296.79343226984
401165011765.3593869077-115.35938690771
411155011638.3141717727-88.3141717726503
421180011815.6107427324-15.6107427323932
431305012652.3704604653397.629539534684
441235012784.2383751383-434.238375138315
451220012558.0484397558-358.048439755828
461345013093.9241558212356.075844178771
471345013310.7036753416139.296324658417
481445014499.3426942123-49.3426942123278
491250012690.3317412145-190.331741214472
501335013583.3160801475-233.316080147541
511360013455.9635208025144.036479197463
521320013778.9878490598-578.987849059762
531345013355.489399232394.5106007676841
541360013451.3545251959148.645474804129
551445014438.685783847211.314216152834
561400013781.0436915215218.956308478468
571360013680.2157677535-80.2157677535251
581470014691.92999807558.07000192452506
591445014619.604453227-169.604453227043
601525015474.2976465219-224.297646521914
611375013349.8597021304400.140297869575
621445014292.6255600563157.374439943709
631430014503.9410684875-203.941068487457
641460014276.0775243934323.922475606611
651470014606.610895148793.3891048512705
661460014889.1417639056-289.141763905649

\begin{tabular}{lllllllll}
\hline
Interpolation Forecasts of Exponential Smoothing \tabularnewline
t & Observed & Fitted & Residuals \tabularnewline
13 & 5200 & 4669.7516025641 & 530.248397435896 \tabularnewline
14 & 5350 & 5045.47564227293 & 304.524357727069 \tabularnewline
15 & 5450 & 5387.01408903384 & 62.9859109661638 \tabularnewline
16 & 5900 & 6023.4149634535 & -123.414963453501 \tabularnewline
17 & 5800 & 6039.44805798351 & -239.448057983514 \tabularnewline
18 & 5950 & 6201.82484494693 & -251.824844946926 \tabularnewline
19 & 6750 & 6785.44410483109 & -35.44410483109 \tabularnewline
20 & 6500 & 6722.65909892011 & -222.659098920115 \tabularnewline
21 & 6500 & 6564.69697158113 & -64.6969715811329 \tabularnewline
22 & 7100 & 6971.66795094449 & 128.332049055508 \tabularnewline
23 & 7100 & 7243.29561960357 & -143.295619603569 \tabularnewline
24 & 8400 & 7766.51602105086 & 633.483978949142 \tabularnewline
25 & 6900 & 7496.85673369521 & -596.856733695207 \tabularnewline
26 & 7400 & 7360.19735523741 & 39.8026447625898 \tabularnewline
27 & 7650 & 7315.86049353674 & 334.139506463259 \tabularnewline
28 & 7850 & 7781.89151184071 & 68.1084881592851 \tabularnewline
29 & 7750 & 7694.0718248414 & 55.9281751585986 \tabularnewline
30 & 8000 & 7903.81920862188 & 96.1807913781167 \tabularnewline
31 & 8950 & 8759.42550587582 & 190.574494124185 \tabularnewline
32 & 9100 & 8756.50897435155 & 343.491025648453 \tabularnewline
33 & 9100 & 9065.88078070803 & 34.119219291968 \tabularnewline
34 & 10050 & 9876.9682401513 & 173.031759848698 \tabularnewline
35 & 10450 & 10279.1598344273 & 170.840165572661 \tabularnewline
36 & 11900 & 11677.8817574889 & 222.118242511056 \tabularnewline
37 & 10000 & 10853.1173209204 & -853.117320920361 \tabularnewline
38 & 11250 & 11228.9235674269 & 21.0764325731161 \tabularnewline
39 & 11250 & 11546.7934322698 & -296.79343226984 \tabularnewline
40 & 11650 & 11765.3593869077 & -115.35938690771 \tabularnewline
41 & 11550 & 11638.3141717727 & -88.3141717726503 \tabularnewline
42 & 11800 & 11815.6107427324 & -15.6107427323932 \tabularnewline
43 & 13050 & 12652.3704604653 & 397.629539534684 \tabularnewline
44 & 12350 & 12784.2383751383 & -434.238375138315 \tabularnewline
45 & 12200 & 12558.0484397558 & -358.048439755828 \tabularnewline
46 & 13450 & 13093.9241558212 & 356.075844178771 \tabularnewline
47 & 13450 & 13310.7036753416 & 139.296324658417 \tabularnewline
48 & 14450 & 14499.3426942123 & -49.3426942123278 \tabularnewline
49 & 12500 & 12690.3317412145 & -190.331741214472 \tabularnewline
50 & 13350 & 13583.3160801475 & -233.316080147541 \tabularnewline
51 & 13600 & 13455.9635208025 & 144.036479197463 \tabularnewline
52 & 13200 & 13778.9878490598 & -578.987849059762 \tabularnewline
53 & 13450 & 13355.4893992323 & 94.5106007676841 \tabularnewline
54 & 13600 & 13451.3545251959 & 148.645474804129 \tabularnewline
55 & 14450 & 14438.6857838472 & 11.314216152834 \tabularnewline
56 & 14000 & 13781.0436915215 & 218.956308478468 \tabularnewline
57 & 13600 & 13680.2157677535 & -80.2157677535251 \tabularnewline
58 & 14700 & 14691.9299980755 & 8.07000192452506 \tabularnewline
59 & 14450 & 14619.604453227 & -169.604453227043 \tabularnewline
60 & 15250 & 15474.2976465219 & -224.297646521914 \tabularnewline
61 & 13750 & 13349.8597021304 & 400.140297869575 \tabularnewline
62 & 14450 & 14292.6255600563 & 157.374439943709 \tabularnewline
63 & 14300 & 14503.9410684875 & -203.941068487457 \tabularnewline
64 & 14600 & 14276.0775243934 & 323.922475606611 \tabularnewline
65 & 14700 & 14606.6108951487 & 93.3891048512705 \tabularnewline
66 & 14600 & 14889.1417639056 & -289.141763905649 \tabularnewline
\hline
\end{tabular}
%Source: https://freestatistics.org/blog/index.php?pk=301658&T=2

[TABLE]
[ROW][C]Interpolation Forecasts of Exponential Smoothing[/C][/ROW]
[ROW][C]t[/C][C]Observed[/C][C]Fitted[/C][C]Residuals[/C][/ROW]
[ROW][C]13[/C][C]5200[/C][C]4669.7516025641[/C][C]530.248397435896[/C][/ROW]
[ROW][C]14[/C][C]5350[/C][C]5045.47564227293[/C][C]304.524357727069[/C][/ROW]
[ROW][C]15[/C][C]5450[/C][C]5387.01408903384[/C][C]62.9859109661638[/C][/ROW]
[ROW][C]16[/C][C]5900[/C][C]6023.4149634535[/C][C]-123.414963453501[/C][/ROW]
[ROW][C]17[/C][C]5800[/C][C]6039.44805798351[/C][C]-239.448057983514[/C][/ROW]
[ROW][C]18[/C][C]5950[/C][C]6201.82484494693[/C][C]-251.824844946926[/C][/ROW]
[ROW][C]19[/C][C]6750[/C][C]6785.44410483109[/C][C]-35.44410483109[/C][/ROW]
[ROW][C]20[/C][C]6500[/C][C]6722.65909892011[/C][C]-222.659098920115[/C][/ROW]
[ROW][C]21[/C][C]6500[/C][C]6564.69697158113[/C][C]-64.6969715811329[/C][/ROW]
[ROW][C]22[/C][C]7100[/C][C]6971.66795094449[/C][C]128.332049055508[/C][/ROW]
[ROW][C]23[/C][C]7100[/C][C]7243.29561960357[/C][C]-143.295619603569[/C][/ROW]
[ROW][C]24[/C][C]8400[/C][C]7766.51602105086[/C][C]633.483978949142[/C][/ROW]
[ROW][C]25[/C][C]6900[/C][C]7496.85673369521[/C][C]-596.856733695207[/C][/ROW]
[ROW][C]26[/C][C]7400[/C][C]7360.19735523741[/C][C]39.8026447625898[/C][/ROW]
[ROW][C]27[/C][C]7650[/C][C]7315.86049353674[/C][C]334.139506463259[/C][/ROW]
[ROW][C]28[/C][C]7850[/C][C]7781.89151184071[/C][C]68.1084881592851[/C][/ROW]
[ROW][C]29[/C][C]7750[/C][C]7694.0718248414[/C][C]55.9281751585986[/C][/ROW]
[ROW][C]30[/C][C]8000[/C][C]7903.81920862188[/C][C]96.1807913781167[/C][/ROW]
[ROW][C]31[/C][C]8950[/C][C]8759.42550587582[/C][C]190.574494124185[/C][/ROW]
[ROW][C]32[/C][C]9100[/C][C]8756.50897435155[/C][C]343.491025648453[/C][/ROW]
[ROW][C]33[/C][C]9100[/C][C]9065.88078070803[/C][C]34.119219291968[/C][/ROW]
[ROW][C]34[/C][C]10050[/C][C]9876.9682401513[/C][C]173.031759848698[/C][/ROW]
[ROW][C]35[/C][C]10450[/C][C]10279.1598344273[/C][C]170.840165572661[/C][/ROW]
[ROW][C]36[/C][C]11900[/C][C]11677.8817574889[/C][C]222.118242511056[/C][/ROW]
[ROW][C]37[/C][C]10000[/C][C]10853.1173209204[/C][C]-853.117320920361[/C][/ROW]
[ROW][C]38[/C][C]11250[/C][C]11228.9235674269[/C][C]21.0764325731161[/C][/ROW]
[ROW][C]39[/C][C]11250[/C][C]11546.7934322698[/C][C]-296.79343226984[/C][/ROW]
[ROW][C]40[/C][C]11650[/C][C]11765.3593869077[/C][C]-115.35938690771[/C][/ROW]
[ROW][C]41[/C][C]11550[/C][C]11638.3141717727[/C][C]-88.3141717726503[/C][/ROW]
[ROW][C]42[/C][C]11800[/C][C]11815.6107427324[/C][C]-15.6107427323932[/C][/ROW]
[ROW][C]43[/C][C]13050[/C][C]12652.3704604653[/C][C]397.629539534684[/C][/ROW]
[ROW][C]44[/C][C]12350[/C][C]12784.2383751383[/C][C]-434.238375138315[/C][/ROW]
[ROW][C]45[/C][C]12200[/C][C]12558.0484397558[/C][C]-358.048439755828[/C][/ROW]
[ROW][C]46[/C][C]13450[/C][C]13093.9241558212[/C][C]356.075844178771[/C][/ROW]
[ROW][C]47[/C][C]13450[/C][C]13310.7036753416[/C][C]139.296324658417[/C][/ROW]
[ROW][C]48[/C][C]14450[/C][C]14499.3426942123[/C][C]-49.3426942123278[/C][/ROW]
[ROW][C]49[/C][C]12500[/C][C]12690.3317412145[/C][C]-190.331741214472[/C][/ROW]
[ROW][C]50[/C][C]13350[/C][C]13583.3160801475[/C][C]-233.316080147541[/C][/ROW]
[ROW][C]51[/C][C]13600[/C][C]13455.9635208025[/C][C]144.036479197463[/C][/ROW]
[ROW][C]52[/C][C]13200[/C][C]13778.9878490598[/C][C]-578.987849059762[/C][/ROW]
[ROW][C]53[/C][C]13450[/C][C]13355.4893992323[/C][C]94.5106007676841[/C][/ROW]
[ROW][C]54[/C][C]13600[/C][C]13451.3545251959[/C][C]148.645474804129[/C][/ROW]
[ROW][C]55[/C][C]14450[/C][C]14438.6857838472[/C][C]11.314216152834[/C][/ROW]
[ROW][C]56[/C][C]14000[/C][C]13781.0436915215[/C][C]218.956308478468[/C][/ROW]
[ROW][C]57[/C][C]13600[/C][C]13680.2157677535[/C][C]-80.2157677535251[/C][/ROW]
[ROW][C]58[/C][C]14700[/C][C]14691.9299980755[/C][C]8.07000192452506[/C][/ROW]
[ROW][C]59[/C][C]14450[/C][C]14619.604453227[/C][C]-169.604453227043[/C][/ROW]
[ROW][C]60[/C][C]15250[/C][C]15474.2976465219[/C][C]-224.297646521914[/C][/ROW]
[ROW][C]61[/C][C]13750[/C][C]13349.8597021304[/C][C]400.140297869575[/C][/ROW]
[ROW][C]62[/C][C]14450[/C][C]14292.6255600563[/C][C]157.374439943709[/C][/ROW]
[ROW][C]63[/C][C]14300[/C][C]14503.9410684875[/C][C]-203.941068487457[/C][/ROW]
[ROW][C]64[/C][C]14600[/C][C]14276.0775243934[/C][C]323.922475606611[/C][/ROW]
[ROW][C]65[/C][C]14700[/C][C]14606.6108951487[/C][C]93.3891048512705[/C][/ROW]
[ROW][C]66[/C][C]14600[/C][C]14889.1417639056[/C][C]-289.141763905649[/C][/ROW]
[/TABLE]
Source: https://freestatistics.org/blog/index.php?pk=301658&T=2

Globally Unique Identifier (entire table): ba.freestatistics.org/blog/index.php?pk=301658&T=2

As an alternative you can also use a QR Code:  

The GUIDs for individual cells are displayed in the table below:

Interpolation Forecasts of Exponential Smoothing
tObservedFittedResiduals
1352004669.7516025641530.248397435896
1453505045.47564227293304.524357727069
1554505387.0140890338462.9859109661638
1659006023.4149634535-123.414963453501
1758006039.44805798351-239.448057983514
1859506201.82484494693-251.824844946926
1967506785.44410483109-35.44410483109
2065006722.65909892011-222.659098920115
2165006564.69697158113-64.6969715811329
2271006971.66795094449128.332049055508
2371007243.29561960357-143.295619603569
2484007766.51602105086633.483978949142
2569007496.85673369521-596.856733695207
2674007360.1973552374139.8026447625898
2776507315.86049353674334.139506463259
2878507781.8915118407168.1084881592851
2977507694.071824841455.9281751585986
3080007903.8192086218896.1807913781167
3189508759.42550587582190.574494124185
3291008756.50897435155343.491025648453
3391009065.8807807080334.119219291968
34100509876.9682401513173.031759848698
351045010279.1598344273170.840165572661
361190011677.8817574889222.118242511056
371000010853.1173209204-853.117320920361
381125011228.923567426921.0764325731161
391125011546.7934322698-296.79343226984
401165011765.3593869077-115.35938690771
411155011638.3141717727-88.3141717726503
421180011815.6107427324-15.6107427323932
431305012652.3704604653397.629539534684
441235012784.2383751383-434.238375138315
451220012558.0484397558-358.048439755828
461345013093.9241558212356.075844178771
471345013310.7036753416139.296324658417
481445014499.3426942123-49.3426942123278
491250012690.3317412145-190.331741214472
501335013583.3160801475-233.316080147541
511360013455.9635208025144.036479197463
521320013778.9878490598-578.987849059762
531345013355.489399232394.5106007676841
541360013451.3545251959148.645474804129
551445014438.685783847211.314216152834
561400013781.0436915215218.956308478468
571360013680.2157677535-80.2157677535251
581470014691.92999807558.07000192452506
591445014619.604453227-169.604453227043
601525015474.2976465219-224.297646521914
611375013349.8597021304400.140297869575
621445014292.6255600563157.374439943709
631430014503.9410684875-203.941068487457
641460014276.0775243934323.922475606611
651470014606.610895148793.3891048512705
661460014889.1417639056-289.141763905649


Extrapolation Forecasts of Exponential Smoothing
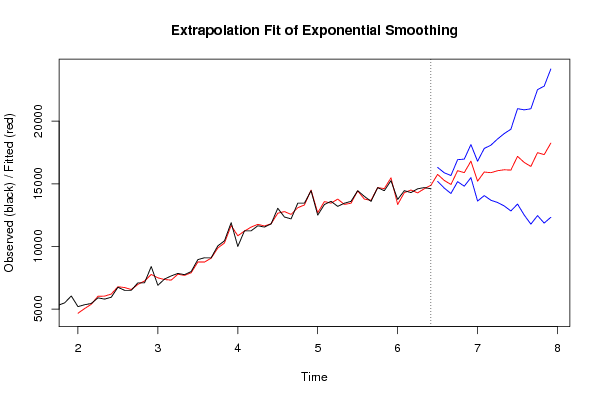
tForecast95% Lower Bound95% Upper Bound
6715752.687640224415197.426280933216307.9489995156
6815267.05896359914657.193875313815876.9240518843
6914945.313479241714227.622051342215663.0049071413
7016048.600272278715171.353453629916925.8470909275
7115890.61040264414810.245401475516970.9754038124
7216810.351366840515491.347661449618129.3550722314
7315211.019617770813623.8464002316798.1928353116
7415939.633254330814058.930512514717820.335996147
7515886.944469732513690.275891859118083.613047606
7616042.846455675113509.89184481118575.8010665393
7716120.688774712213232.71862484719008.6589245773
7816092.893581732412832.418073029219353.3690904355
7917191.004122513413384.778644593120997.2296004337
8016705.375445888112509.574618948720901.1762728274
8116383.629961530811781.088970553420986.1709525082
8217486.916754567812461.473540679922512.3599684556
8317328.92688493311865.261222496322792.5925473697
8418248.667849129512332.175423489424165.1602747697

\begin{tabular}{lllllllll}
\hline
Extrapolation Forecasts of Exponential Smoothing \tabularnewline
t & Forecast & 95% Lower Bound & 95% Upper Bound \tabularnewline
67 & 15752.6876402244 & 15197.4262809332 & 16307.9489995156 \tabularnewline
68 & 15267.058963599 & 14657.1938753138 & 15876.9240518843 \tabularnewline
69 & 14945.3134792417 & 14227.6220513422 & 15663.0049071413 \tabularnewline
70 & 16048.6002722787 & 15171.3534536299 & 16925.8470909275 \tabularnewline
71 & 15890.610402644 & 14810.2454014755 & 16970.9754038124 \tabularnewline
72 & 16810.3513668405 & 15491.3476614496 & 18129.3550722314 \tabularnewline
73 & 15211.0196177708 & 13623.84640023 & 16798.1928353116 \tabularnewline
74 & 15939.6332543308 & 14058.9305125147 & 17820.335996147 \tabularnewline
75 & 15886.9444697325 & 13690.2758918591 & 18083.613047606 \tabularnewline
76 & 16042.8464556751 & 13509.891844811 & 18575.8010665393 \tabularnewline
77 & 16120.6887747122 & 13232.718624847 & 19008.6589245773 \tabularnewline
78 & 16092.8935817324 & 12832.4180730292 & 19353.3690904355 \tabularnewline
79 & 17191.0041225134 & 13384.7786445931 & 20997.2296004337 \tabularnewline
80 & 16705.3754458881 & 12509.5746189487 & 20901.1762728274 \tabularnewline
81 & 16383.6299615308 & 11781.0889705534 & 20986.1709525082 \tabularnewline
82 & 17486.9167545678 & 12461.4735406799 & 22512.3599684556 \tabularnewline
83 & 17328.926884933 & 11865.2612224963 & 22792.5925473697 \tabularnewline
84 & 18248.6678491295 & 12332.1754234894 & 24165.1602747697 \tabularnewline
\hline
\end{tabular}
%Source: https://freestatistics.org/blog/index.php?pk=301658&T=3

[TABLE]
[ROW][C]Extrapolation Forecasts of Exponential Smoothing[/C][/ROW]
[ROW][C]t[/C][C]Forecast[/C][C]95% Lower Bound[/C][C]95% Upper Bound[/C][/ROW]
[ROW][C]67[/C][C]15752.6876402244[/C][C]15197.4262809332[/C][C]16307.9489995156[/C][/ROW]
[ROW][C]68[/C][C]15267.058963599[/C][C]14657.1938753138[/C][C]15876.9240518843[/C][/ROW]
[ROW][C]69[/C][C]14945.3134792417[/C][C]14227.6220513422[/C][C]15663.0049071413[/C][/ROW]
[ROW][C]70[/C][C]16048.6002722787[/C][C]15171.3534536299[/C][C]16925.8470909275[/C][/ROW]
[ROW][C]71[/C][C]15890.610402644[/C][C]14810.2454014755[/C][C]16970.9754038124[/C][/ROW]
[ROW][C]72[/C][C]16810.3513668405[/C][C]15491.3476614496[/C][C]18129.3550722314[/C][/ROW]
[ROW][C]73[/C][C]15211.0196177708[/C][C]13623.84640023[/C][C]16798.1928353116[/C][/ROW]
[ROW][C]74[/C][C]15939.6332543308[/C][C]14058.9305125147[/C][C]17820.335996147[/C][/ROW]
[ROW][C]75[/C][C]15886.9444697325[/C][C]13690.2758918591[/C][C]18083.613047606[/C][/ROW]
[ROW][C]76[/C][C]16042.8464556751[/C][C]13509.891844811[/C][C]18575.8010665393[/C][/ROW]
[ROW][C]77[/C][C]16120.6887747122[/C][C]13232.718624847[/C][C]19008.6589245773[/C][/ROW]
[ROW][C]78[/C][C]16092.8935817324[/C][C]12832.4180730292[/C][C]19353.3690904355[/C][/ROW]
[ROW][C]79[/C][C]17191.0041225134[/C][C]13384.7786445931[/C][C]20997.2296004337[/C][/ROW]
[ROW][C]80[/C][C]16705.3754458881[/C][C]12509.5746189487[/C][C]20901.1762728274[/C][/ROW]
[ROW][C]81[/C][C]16383.6299615308[/C][C]11781.0889705534[/C][C]20986.1709525082[/C][/ROW]
[ROW][C]82[/C][C]17486.9167545678[/C][C]12461.4735406799[/C][C]22512.3599684556[/C][/ROW]
[ROW][C]83[/C][C]17328.926884933[/C][C]11865.2612224963[/C][C]22792.5925473697[/C][/ROW]
[ROW][C]84[/C][C]18248.6678491295[/C][C]12332.1754234894[/C][C]24165.1602747697[/C][/ROW]
[/TABLE]
Source: https://freestatistics.org/blog/index.php?pk=301658&T=3

Globally Unique Identifier (entire table): ba.freestatistics.org/blog/index.php?pk=301658&T=3

As an alternative you can also use a QR Code:  

The GUIDs for individual cells are displayed in the table below:

Extrapolation Forecasts of Exponential Smoothing
tForecast95% Lower Bound95% Upper Bound
6715752.687640224415197.426280933216307.9489995156
6815267.05896359914657.193875313815876.9240518843
6914945.313479241714227.622051342215663.0049071413
7016048.600272278715171.353453629916925.8470909275
7115890.61040264414810.245401475516970.9754038124
7216810.351366840515491.347661449618129.3550722314
7315211.019617770813623.8464002316798.1928353116
7415939.633254330814058.930512514717820.335996147
7515886.944469732513690.275891859118083.613047606
7616042.846455675113509.89184481118575.8010665393
7716120.688774712213232.71862484719008.6589245773
7816092.893581732412832.418073029219353.3690904355
7917191.004122513413384.778644593120997.2296004337
8016705.375445888112509.574618948720901.1762728274
8116383.629961530811781.088970553420986.1709525082
8217486.916754567812461.473540679922512.3599684556
8317328.92688493311865.261222496322792.5925473697
8418248.667849129512332.175423489424165.1602747697


Parameters (Session):
par2 = grey ; par3 = FALSE ; par4 = Unknown ;
Parameters (R input):
par1 = 12 ; par2 = Triple ; par3 = additive ; par4 = 18 ;
R code (references can be found in the software module):
par4 <- '12'
par3 <- 'additive'
par2 <- 'Triple'
par1 <- '12'
par1 <- as.numeric(par1)
par4 <- as.numeric(par4)
if (par2 == 'Single') K <- 1
if (par2 == 'Double') K <- 2
if (par2 == 'Triple') K <- par1
nx <- length(x)
nxmK <- nx - K
x <- ts(x, frequency = par1)
if (par2 == 'Single') fit <- HoltWinters(x, gamma=F, beta=F)
if (par2 == 'Double') fit <- HoltWinters(x, gamma=F)
if (par2 == 'Triple') fit <- HoltWinters(x, seasonal=par3)
fit
myresid <- x - fit$fitted[,'xhat']
bitmap(file='test1.png')
op <- par(mfrow=c(2,1))
plot(fit,ylab='Observed (black) / Fitted (red)',main='Interpolation Fit of Exponential Smoothing')
plot(myresid,ylab='Residuals',main='Interpolation Prediction Errors')
par(op)
dev.off()
bitmap(file='test2.png')
p <- predict(fit, par4, prediction.interval=TRUE)
np <- length(p[,1])
plot(fit,p,ylab='Observed (black) / Fitted (red)',main='Extrapolation Fit of Exponential Smoothing')
dev.off()
bitmap(file='test3.png')
op <- par(mfrow = c(2,2))
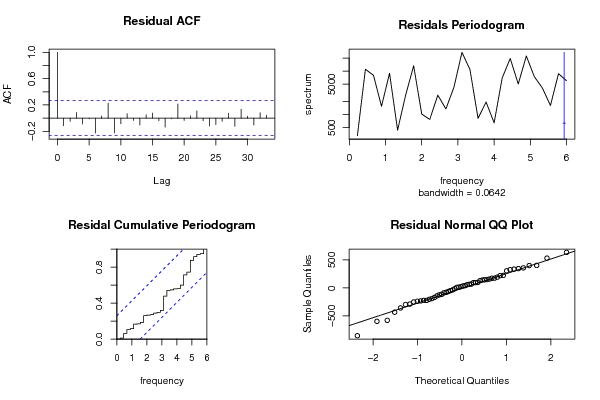
acf(as.numeric(myresid),lag.max = nx/2,main='Residual ACF')
spectrum(myresid,main='Residals Periodogram')
cpgram(myresid,main='Residal Cumulative Periodogram')
qqnorm(myresid,main='Residual Normal QQ Plot')
qqline(myresid)
par(op)
dev.off()
load(file='createtable')
a<-table.start()
a<-table.row.start(a)
a<-table.element(a,'Estimated Parameters of Exponential Smoothing',2,TRUE)
a<-table.row.end(a)
a<-table.row.start(a)
a<-table.element(a,'Parameter',header=TRUE)
a<-table.element(a,'Value',header=TRUE)
a<-table.row.end(a)
a<-table.row.start(a)
a<-table.element(a,'alpha',header=TRUE)
a<-table.element(a,fit$alpha)
a<-table.row.end(a)
a<-table.row.start(a)
a<-table.element(a,'beta',header=TRUE)
a<-table.element(a,fit$beta)
a<-table.row.end(a)
a<-table.row.start(a)
a<-table.element(a,'gamma',header=TRUE)
a<-table.element(a,fit$gamma)
a<-table.row.end(a)
a<-table.end(a)
table.save(a,file='mytable.tab')
a<-table.start()
a<-table.row.start(a)
a<-table.element(a,'Interpolation Forecasts of Exponential Smoothing',4,TRUE)
a<-table.row.end(a)
a<-table.row.start(a)
a<-table.element(a,'t',header=TRUE)
a<-table.element(a,'Observed',header=TRUE)
a<-table.element(a,'Fitted',header=TRUE)
a<-table.element(a,'Residuals',header=TRUE)
a<-table.row.end(a)
for (i in 1:nxmK) {
a<-table.row.start(a)
a<-table.element(a,i+K,header=TRUE)
a<-table.element(a,x[i+K])
a<-table.element(a,fit$fitted[i,'xhat'])
a<-table.element(a,myresid[i])
a<-table.row.end(a)
}
a<-table.end(a)
table.save(a,file='mytable1.tab')
a<-table.start()
a<-table.row.start(a)
a<-table.element(a,'Extrapolation Forecasts of Exponential Smoothing',4,TRUE)
a<-table.row.end(a)
a<-table.row.start(a)
a<-table.element(a,'t',header=TRUE)
a<-table.element(a,'Forecast',header=TRUE)
a<-table.element(a,'95% Lower Bound',header=TRUE)
a<-table.element(a,'95% Upper Bound',header=TRUE)
a<-table.row.end(a)
for (i in 1:np) {
a<-table.row.start(a)
a<-table.element(a,nx+i,header=TRUE)
a<-table.element(a,p[i,'fit'])
a<-table.element(a,p[i,'lwr'])
a<-table.element(a,p[i,'upr'])
a<-table.row.end(a)
}
a<-table.end(a)
table.save(a,file='mytable2.tab')