Free Statistics

of Irreproducible Research!

Author's title

Author*The author of this computation has been verified*
R Software Modulerwasp_arimabackwardselection.wasp
Title produced by softwareARIMA Backward Selection
Date of computationTue, 20 Dec 2016 14:55:00 +0100
Cite this page as followsStatistical Computations at FreeStatistics.org, Office for Research Development and Education, URL https://freestatistics.org/blog/index.php?v=date/2016/Dec/20/t1482242207eq9d12ivs7px057.htm/, Retrieved Sun, 28 Apr 2024 08:09:01 +0000
Statistical Computations at FreeStatistics.org, Office for Research Development and Education, URL https://freestatistics.org/blog/index.php?pk=301675, Retrieved Sun, 28 Apr 2024 08:09:01 +0000
QR Codes:

Original text written by user:
IsPrivate?No (this computation is public)
User-defined keywords
Estimated Impact60
Family? (F = Feedback message, R = changed R code, M = changed R Module, P = changed Parameters, D = changed Data)
-       [ARIMA Backward Selection] [] [2016-12-20 13:55:00] [361c8dad91b3f1ef2e651cd04783c23b] [Current]
Feedback Forum

Post a new message
Dataseries X:
2755
2765
3000
2890
2940
3290
2815
3035
3070
3040
2685
2540
3090
2995
3440
3335
3205
3285
2790
3225
3360
3275
3505
3185
3470
3510
3840
3605
3655
3555
3140
3380
3255
3460
3245
3120
3265
3220
3140
3050
3300
2950
2630
2795
2840
2945
2790
2605
4590
4230
4245
4300
4475
3910
4100
3500
4390
3550
3865
3715
3310
3945
5050
4350
4060
4345
4360
4915
4650
4805
4775
4220
3975
3820
5515
4895
5535
4230
3695
5590
5000
4875
4360
4405
4500
4070
4800
4080
4850
4105
3805
5060
4060
4600
4635
3900
4120
3960
4400
3700
3970
4550
5140
5000
3650
4300
3650
3355
4000
3450
3295
3390
3415
3440
3680
3900
3965
4295
4210
4100
4690
3860
4250
4495
3800
3845


Summary of computational transaction
Raw Input view raw input (R code)
Raw Outputview raw output of R engine
Computing time2 seconds
R ServerBig Analytics Cloud Computing Center

\begin{tabular}{lllllllll}
\hline
Summary of computational transaction \tabularnewline
Raw Input view raw input (R code)  \tabularnewline
Raw Outputview raw output of R engine  \tabularnewline
Computing time2 seconds \tabularnewline
R ServerBig Analytics Cloud Computing Center \tabularnewline
\hline
\end{tabular}
%Source: https://freestatistics.org/blog/index.php?pk=301675&T=0

[TABLE]
[ROW]
Summary of computational transaction[/C][/ROW] [ROW]Raw Input[/C] view raw input (R code) [/C][/ROW] [ROW]Raw Output[/C]view raw output of R engine [/C][/ROW] [ROW]Computing time[/C]2 seconds[/C][/ROW] [ROW]R Server[/C]Big Analytics Cloud Computing Center[/C][/ROW] [/TABLE] Source: https://freestatistics.org/blog/index.php?pk=301675&T=0

Globally Unique Identifier (entire table): ba.freestatistics.org/blog/index.php?pk=301675&T=0

As an alternative you can also use a QR Code:  

The GUIDs for individual cells are displayed in the table below:

Summary of computational transaction
Raw Input view raw input (R code)
Raw Outputview raw output of R engine
Computing time2 seconds
R ServerBig Analytics Cloud Computing Center


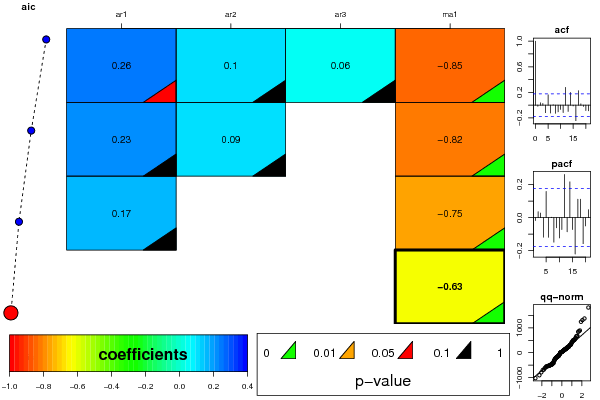
ARIMA Parameter Estimation and Backward Selection
Iterationar1ar2ar3ma1
Estimates ( 1 )0.25760.10470.0558-0.8505
(p-val)(0.0584 )(0.3528 )(0.5961 )(0 )
Estimates ( 2 )0.23070.09440-0.8195
(p-val)(0.1018 )(0.4239 )(NA )(0 )
Estimates ( 3 )0.168100-0.7488
(p-val)(0.2746 )(NA )(NA )(0 )
Estimates ( 4 )000-0.6292
(p-val)(NA )(NA )(NA )(0 )
Estimates ( 5 )NANANANA
(p-val)(NA )(NA )(NA )(NA )
Estimates ( 6 )NANANANA
(p-val)(NA )(NA )(NA )(NA )
Estimates ( 7 )NANANANA
(p-val)(NA )(NA )(NA )(NA )

\begin{tabular}{lllllllll}
\hline
ARIMA Parameter Estimation and Backward Selection \tabularnewline
Iteration & ar1 & ar2 & ar3 & ma1 \tabularnewline
Estimates ( 1 ) & 0.2576 & 0.1047 & 0.0558 & -0.8505 \tabularnewline
(p-val) & (0.0584 ) & (0.3528 ) & (0.5961 ) & (0 ) \tabularnewline
Estimates ( 2 ) & 0.2307 & 0.0944 & 0 & -0.8195 \tabularnewline
(p-val) & (0.1018 ) & (0.4239 ) & (NA ) & (0 ) \tabularnewline
Estimates ( 3 ) & 0.1681 & 0 & 0 & -0.7488 \tabularnewline
(p-val) & (0.2746 ) & (NA ) & (NA ) & (0 ) \tabularnewline
Estimates ( 4 ) & 0 & 0 & 0 & -0.6292 \tabularnewline
(p-val) & (NA ) & (NA ) & (NA ) & (0 ) \tabularnewline
Estimates ( 5 ) & NA & NA & NA & NA \tabularnewline
(p-val) & (NA ) & (NA ) & (NA ) & (NA ) \tabularnewline
Estimates ( 6 ) & NA & NA & NA & NA \tabularnewline
(p-val) & (NA ) & (NA ) & (NA ) & (NA ) \tabularnewline
Estimates ( 7 ) & NA & NA & NA & NA \tabularnewline
(p-val) & (NA ) & (NA ) & (NA ) & (NA ) \tabularnewline
\hline
\end{tabular}
%Source: https://freestatistics.org/blog/index.php?pk=301675&T=1

[TABLE]
[ROW][C]ARIMA Parameter Estimation and Backward Selection[/C][/ROW]
[ROW][C]Iteration[/C][C]ar1[/C][C]ar2[/C][C]ar3[/C][C]ma1[/C][/ROW]
[ROW][C]Estimates ( 1 )[/C][C]0.2576[/C][C]0.1047[/C][C]0.0558[/C][C]-0.8505[/C][/ROW]
[ROW][C](p-val)[/C][C](0.0584 )[/C][C](0.3528 )[/C][C](0.5961 )[/C][C](0 )[/C][/ROW]
[ROW][C]Estimates ( 2 )[/C][C]0.2307[/C][C]0.0944[/C][C]0[/C][C]-0.8195[/C][/ROW]
[ROW][C](p-val)[/C][C](0.1018 )[/C][C](0.4239 )[/C][C](NA )[/C][C](0 )[/C][/ROW]
[ROW][C]Estimates ( 3 )[/C][C]0.1681[/C][C]0[/C][C]0[/C][C]-0.7488[/C][/ROW]
[ROW][C](p-val)[/C][C](0.2746 )[/C][C](NA )[/C][C](NA )[/C][C](0 )[/C][/ROW]
[ROW][C]Estimates ( 4 )[/C][C]0[/C][C]0[/C][C]0[/C][C]-0.6292[/C][/ROW]
[ROW][C](p-val)[/C][C](NA )[/C][C](NA )[/C][C](NA )[/C][C](0 )[/C][/ROW]
[ROW][C]Estimates ( 5 )[/C][C]NA[/C][C]NA[/C][C]NA[/C][C]NA[/C][/ROW]
[ROW][C](p-val)[/C][C](NA )[/C][C](NA )[/C][C](NA )[/C][C](NA )[/C][/ROW]
[ROW][C]Estimates ( 6 )[/C][C]NA[/C][C]NA[/C][C]NA[/C][C]NA[/C][/ROW]
[ROW][C](p-val)[/C][C](NA )[/C][C](NA )[/C][C](NA )[/C][C](NA )[/C][/ROW]
[ROW][C]Estimates ( 7 )[/C][C]NA[/C][C]NA[/C][C]NA[/C][C]NA[/C][/ROW]
[ROW][C](p-val)[/C][C](NA )[/C][C](NA )[/C][C](NA )[/C][C](NA )[/C][/ROW]
[/TABLE]
Source: https://freestatistics.org/blog/index.php?pk=301675&T=1

Globally Unique Identifier (entire table): ba.freestatistics.org/blog/index.php?pk=301675&T=1

As an alternative you can also use a QR Code:  

The GUIDs for individual cells are displayed in the table below:

ARIMA Parameter Estimation and Backward Selection
Iterationar1ar2ar3ma1
Estimates ( 1 )0.25760.10470.0558-0.8505
(p-val)(0.0584 )(0.3528 )(0.5961 )(0 )
Estimates ( 2 )0.23070.09440-0.8195
(p-val)(0.1018 )(0.4239 )(NA )(0 )
Estimates ( 3 )0.168100-0.7488
(p-val)(0.2746 )(NA )(NA )(0 )
Estimates ( 4 )000-0.6292
(p-val)(NA )(NA )(NA )(0 )
Estimates ( 5 )NANANANA
(p-val)(NA )(NA )(NA )(NA )
Estimates ( 6 )NANANANA
(p-val)(NA )(NA )(NA )(NA )
Estimates ( 7 )NANANANA
(p-val)(NA )(NA )(NA )(NA )


Estimated ARIMA Residuals
Value
2.75499814459054
8.61763771835605
223.298790507443
6.55460847371788
71.9173402129208
390.580520385834
-242.945200556538
118.585121030331
86.3869266068343
28.6617739479075
-328.341065885841
-330.934099912555
326.607146734288
57.0334936931043
503.646480806391
197.268077407036
35.3556152445801
128.328224903599
-412.361818067407
209.464358319725
218.701658789039
56.0576848220721
286.264741316062
-144.325726420047
230.735926716778
164.849270249125
446.707679644603
43.9949438924073
122.452293268831
-16.7188439240384
-410.705440362445
2.25320482466283
-163.664077402295
103.470761730651
-171.991642129799
-217.6329072827
3.06093866600904
-67.0869300449841
-122.666312745008
-168.397508032363
139.04199852631
-287.923091079724
-476.740455354478
-138.163670726946
-86.1931870527729
32.8959459291689
-148.022403865859
-269.773444501036
1814.10787025563
664.597520986642
573.152330108166
481.632884248859
526.38137844037
-200.288234131268
135.025161330696
-530.842949077975
593.402814943804
-545.318039224201
47.9156061285998
-167.083542498387
-504.886355575216
325.052788728753
1241.62473070427
43.8981239446293
-139.439763719138
229.350458247749
138.811926389043
656.415182134825
133.186782593074
299.279677877679
168.029182767622
-424.142190387353
-469.269532453661
-465.179473238656
1372.75131159463
122.884077649907
836.251539988606
-786.449587051216
-904.454161221395
1307.72839159718
70.5713754898152
27.0378638658849
-473.738821921068
-223.130817079934
-79.6377833510787
-505.602113597422
423.720105342054
-525.46925334982
497.602031694622
-501.874453963921
-550.527823795622
893.224533182918
-542.190290432243
302.15834130829
170.454579509783
-613.254592781351
-115.606367891424
-283.550278268208
254.58904786721
-583.350515304341
-49.0998721594356
497.840777337949
865.24900373906
408.669117843196
-1020.46579234364
112.889184699521
-674.757318372925
-690.948334980362
177.242304095892
-525.731481441443
-456.176409413551
-220.507533992577
-156.080066393718
-96.0701123951171
163.863076357953
302.343294924668
254.394655651175
509.552669250513
241.05091846461
84.7808776874172
671.975018058304
-426.047148392468
210.539848166533
337.073604809884
-483.8038482507
-200.403734644513

\begin{tabular}{lllllllll}
\hline
Estimated ARIMA Residuals \tabularnewline
Value \tabularnewline
2.75499814459054 \tabularnewline
8.61763771835605 \tabularnewline
223.298790507443 \tabularnewline
6.55460847371788 \tabularnewline
71.9173402129208 \tabularnewline
390.580520385834 \tabularnewline
-242.945200556538 \tabularnewline
118.585121030331 \tabularnewline
86.3869266068343 \tabularnewline
28.6617739479075 \tabularnewline
-328.341065885841 \tabularnewline
-330.934099912555 \tabularnewline
326.607146734288 \tabularnewline
57.0334936931043 \tabularnewline
503.646480806391 \tabularnewline
197.268077407036 \tabularnewline
35.3556152445801 \tabularnewline
128.328224903599 \tabularnewline
-412.361818067407 \tabularnewline
209.464358319725 \tabularnewline
218.701658789039 \tabularnewline
56.0576848220721 \tabularnewline
286.264741316062 \tabularnewline
-144.325726420047 \tabularnewline
230.735926716778 \tabularnewline
164.849270249125 \tabularnewline
446.707679644603 \tabularnewline
43.9949438924073 \tabularnewline
122.452293268831 \tabularnewline
-16.7188439240384 \tabularnewline
-410.705440362445 \tabularnewline
2.25320482466283 \tabularnewline
-163.664077402295 \tabularnewline
103.470761730651 \tabularnewline
-171.991642129799 \tabularnewline
-217.6329072827 \tabularnewline
3.06093866600904 \tabularnewline
-67.0869300449841 \tabularnewline
-122.666312745008 \tabularnewline
-168.397508032363 \tabularnewline
139.04199852631 \tabularnewline
-287.923091079724 \tabularnewline
-476.740455354478 \tabularnewline
-138.163670726946 \tabularnewline
-86.1931870527729 \tabularnewline
32.8959459291689 \tabularnewline
-148.022403865859 \tabularnewline
-269.773444501036 \tabularnewline
1814.10787025563 \tabularnewline
664.597520986642 \tabularnewline
573.152330108166 \tabularnewline
481.632884248859 \tabularnewline
526.38137844037 \tabularnewline
-200.288234131268 \tabularnewline
135.025161330696 \tabularnewline
-530.842949077975 \tabularnewline
593.402814943804 \tabularnewline
-545.318039224201 \tabularnewline
47.9156061285998 \tabularnewline
-167.083542498387 \tabularnewline
-504.886355575216 \tabularnewline
325.052788728753 \tabularnewline
1241.62473070427 \tabularnewline
43.8981239446293 \tabularnewline
-139.439763719138 \tabularnewline
229.350458247749 \tabularnewline
138.811926389043 \tabularnewline
656.415182134825 \tabularnewline
133.186782593074 \tabularnewline
299.279677877679 \tabularnewline
168.029182767622 \tabularnewline
-424.142190387353 \tabularnewline
-469.269532453661 \tabularnewline
-465.179473238656 \tabularnewline
1372.75131159463 \tabularnewline
122.884077649907 \tabularnewline
836.251539988606 \tabularnewline
-786.449587051216 \tabularnewline
-904.454161221395 \tabularnewline
1307.72839159718 \tabularnewline
70.5713754898152 \tabularnewline
27.0378638658849 \tabularnewline
-473.738821921068 \tabularnewline
-223.130817079934 \tabularnewline
-79.6377833510787 \tabularnewline
-505.602113597422 \tabularnewline
423.720105342054 \tabularnewline
-525.46925334982 \tabularnewline
497.602031694622 \tabularnewline
-501.874453963921 \tabularnewline
-550.527823795622 \tabularnewline
893.224533182918 \tabularnewline
-542.190290432243 \tabularnewline
302.15834130829 \tabularnewline
170.454579509783 \tabularnewline
-613.254592781351 \tabularnewline
-115.606367891424 \tabularnewline
-283.550278268208 \tabularnewline
254.58904786721 \tabularnewline
-583.350515304341 \tabularnewline
-49.0998721594356 \tabularnewline
497.840777337949 \tabularnewline
865.24900373906 \tabularnewline
408.669117843196 \tabularnewline
-1020.46579234364 \tabularnewline
112.889184699521 \tabularnewline
-674.757318372925 \tabularnewline
-690.948334980362 \tabularnewline
177.242304095892 \tabularnewline
-525.731481441443 \tabularnewline
-456.176409413551 \tabularnewline
-220.507533992577 \tabularnewline
-156.080066393718 \tabularnewline
-96.0701123951171 \tabularnewline
163.863076357953 \tabularnewline
302.343294924668 \tabularnewline
254.394655651175 \tabularnewline
509.552669250513 \tabularnewline
241.05091846461 \tabularnewline
84.7808776874172 \tabularnewline
671.975018058304 \tabularnewline
-426.047148392468 \tabularnewline
210.539848166533 \tabularnewline
337.073604809884 \tabularnewline
-483.8038482507 \tabularnewline
-200.403734644513 \tabularnewline
\hline
\end{tabular}
%Source: https://freestatistics.org/blog/index.php?pk=301675&T=2

[TABLE]
[ROW][C]Estimated ARIMA Residuals[/C][/ROW]
[ROW][C]Value[/C][/ROW]
[ROW][C]2.75499814459054[/C][/ROW]
[ROW][C]8.61763771835605[/C][/ROW]
[ROW][C]223.298790507443[/C][/ROW]
[ROW][C]6.55460847371788[/C][/ROW]
[ROW][C]71.9173402129208[/C][/ROW]
[ROW][C]390.580520385834[/C][/ROW]
[ROW][C]-242.945200556538[/C][/ROW]
[ROW][C]118.585121030331[/C][/ROW]
[ROW][C]86.3869266068343[/C][/ROW]
[ROW][C]28.6617739479075[/C][/ROW]
[ROW][C]-328.341065885841[/C][/ROW]
[ROW][C]-330.934099912555[/C][/ROW]
[ROW][C]326.607146734288[/C][/ROW]
[ROW][C]57.0334936931043[/C][/ROW]
[ROW][C]503.646480806391[/C][/ROW]
[ROW][C]197.268077407036[/C][/ROW]
[ROW][C]35.3556152445801[/C][/ROW]
[ROW][C]128.328224903599[/C][/ROW]
[ROW][C]-412.361818067407[/C][/ROW]
[ROW][C]209.464358319725[/C][/ROW]
[ROW][C]218.701658789039[/C][/ROW]
[ROW][C]56.0576848220721[/C][/ROW]
[ROW][C]286.264741316062[/C][/ROW]
[ROW][C]-144.325726420047[/C][/ROW]
[ROW][C]230.735926716778[/C][/ROW]
[ROW][C]164.849270249125[/C][/ROW]
[ROW][C]446.707679644603[/C][/ROW]
[ROW][C]43.9949438924073[/C][/ROW]
[ROW][C]122.452293268831[/C][/ROW]
[ROW][C]-16.7188439240384[/C][/ROW]
[ROW][C]-410.705440362445[/C][/ROW]
[ROW][C]2.25320482466283[/C][/ROW]
[ROW][C]-163.664077402295[/C][/ROW]
[ROW][C]103.470761730651[/C][/ROW]
[ROW][C]-171.991642129799[/C][/ROW]
[ROW][C]-217.6329072827[/C][/ROW]
[ROW][C]3.06093866600904[/C][/ROW]
[ROW][C]-67.0869300449841[/C][/ROW]
[ROW][C]-122.666312745008[/C][/ROW]
[ROW][C]-168.397508032363[/C][/ROW]
[ROW][C]139.04199852631[/C][/ROW]
[ROW][C]-287.923091079724[/C][/ROW]
[ROW][C]-476.740455354478[/C][/ROW]
[ROW][C]-138.163670726946[/C][/ROW]
[ROW][C]-86.1931870527729[/C][/ROW]
[ROW][C]32.8959459291689[/C][/ROW]
[ROW][C]-148.022403865859[/C][/ROW]
[ROW][C]-269.773444501036[/C][/ROW]
[ROW][C]1814.10787025563[/C][/ROW]
[ROW][C]664.597520986642[/C][/ROW]
[ROW][C]573.152330108166[/C][/ROW]
[ROW][C]481.632884248859[/C][/ROW]
[ROW][C]526.38137844037[/C][/ROW]
[ROW][C]-200.288234131268[/C][/ROW]
[ROW][C]135.025161330696[/C][/ROW]
[ROW][C]-530.842949077975[/C][/ROW]
[ROW][C]593.402814943804[/C][/ROW]
[ROW][C]-545.318039224201[/C][/ROW]
[ROW][C]47.9156061285998[/C][/ROW]
[ROW][C]-167.083542498387[/C][/ROW]
[ROW][C]-504.886355575216[/C][/ROW]
[ROW][C]325.052788728753[/C][/ROW]
[ROW][C]1241.62473070427[/C][/ROW]
[ROW][C]43.8981239446293[/C][/ROW]
[ROW][C]-139.439763719138[/C][/ROW]
[ROW][C]229.350458247749[/C][/ROW]
[ROW][C]138.811926389043[/C][/ROW]
[ROW][C]656.415182134825[/C][/ROW]
[ROW][C]133.186782593074[/C][/ROW]
[ROW][C]299.279677877679[/C][/ROW]
[ROW][C]168.029182767622[/C][/ROW]
[ROW][C]-424.142190387353[/C][/ROW]
[ROW][C]-469.269532453661[/C][/ROW]
[ROW][C]-465.179473238656[/C][/ROW]
[ROW][C]1372.75131159463[/C][/ROW]
[ROW][C]122.884077649907[/C][/ROW]
[ROW][C]836.251539988606[/C][/ROW]
[ROW][C]-786.449587051216[/C][/ROW]
[ROW][C]-904.454161221395[/C][/ROW]
[ROW][C]1307.72839159718[/C][/ROW]
[ROW][C]70.5713754898152[/C][/ROW]
[ROW][C]27.0378638658849[/C][/ROW]
[ROW][C]-473.738821921068[/C][/ROW]
[ROW][C]-223.130817079934[/C][/ROW]
[ROW][C]-79.6377833510787[/C][/ROW]
[ROW][C]-505.602113597422[/C][/ROW]
[ROW][C]423.720105342054[/C][/ROW]
[ROW][C]-525.46925334982[/C][/ROW]
[ROW][C]497.602031694622[/C][/ROW]
[ROW][C]-501.874453963921[/C][/ROW]
[ROW][C]-550.527823795622[/C][/ROW]
[ROW][C]893.224533182918[/C][/ROW]
[ROW][C]-542.190290432243[/C][/ROW]
[ROW][C]302.15834130829[/C][/ROW]
[ROW][C]170.454579509783[/C][/ROW]
[ROW][C]-613.254592781351[/C][/ROW]
[ROW][C]-115.606367891424[/C][/ROW]
[ROW][C]-283.550278268208[/C][/ROW]
[ROW][C]254.58904786721[/C][/ROW]
[ROW][C]-583.350515304341[/C][/ROW]
[ROW][C]-49.0998721594356[/C][/ROW]
[ROW][C]497.840777337949[/C][/ROW]
[ROW][C]865.24900373906[/C][/ROW]
[ROW][C]408.669117843196[/C][/ROW]
[ROW][C]-1020.46579234364[/C][/ROW]
[ROW][C]112.889184699521[/C][/ROW]
[ROW][C]-674.757318372925[/C][/ROW]
[ROW][C]-690.948334980362[/C][/ROW]
[ROW][C]177.242304095892[/C][/ROW]
[ROW][C]-525.731481441443[/C][/ROW]
[ROW][C]-456.176409413551[/C][/ROW]
[ROW][C]-220.507533992577[/C][/ROW]
[ROW][C]-156.080066393718[/C][/ROW]
[ROW][C]-96.0701123951171[/C][/ROW]
[ROW][C]163.863076357953[/C][/ROW]
[ROW][C]302.343294924668[/C][/ROW]
[ROW][C]254.394655651175[/C][/ROW]
[ROW][C]509.552669250513[/C][/ROW]
[ROW][C]241.05091846461[/C][/ROW]
[ROW][C]84.7808776874172[/C][/ROW]
[ROW][C]671.975018058304[/C][/ROW]
[ROW][C]-426.047148392468[/C][/ROW]
[ROW][C]210.539848166533[/C][/ROW]
[ROW][C]337.073604809884[/C][/ROW]
[ROW][C]-483.8038482507[/C][/ROW]
[ROW][C]-200.403734644513[/C][/ROW]
[/TABLE]
Source: https://freestatistics.org/blog/index.php?pk=301675&T=2

Globally Unique Identifier (entire table): ba.freestatistics.org/blog/index.php?pk=301675&T=2

As an alternative you can also use a QR Code:  

The GUIDs for individual cells are displayed in the table below:

Estimated ARIMA Residuals
Value
2.75499814459054
8.61763771835605
223.298790507443
6.55460847371788
71.9173402129208
390.580520385834
-242.945200556538
118.585121030331
86.3869266068343
28.6617739479075
-328.341065885841
-330.934099912555
326.607146734288
57.0334936931043
503.646480806391
197.268077407036
35.3556152445801
128.328224903599
-412.361818067407
209.464358319725
218.701658789039
56.0576848220721
286.264741316062
-144.325726420047
230.735926716778
164.849270249125
446.707679644603
43.9949438924073
122.452293268831
-16.7188439240384
-410.705440362445
2.25320482466283
-163.664077402295
103.470761730651
-171.991642129799
-217.6329072827
3.06093866600904
-67.0869300449841
-122.666312745008
-168.397508032363
139.04199852631
-287.923091079724
-476.740455354478
-138.163670726946
-86.1931870527729
32.8959459291689
-148.022403865859
-269.773444501036
1814.10787025563
664.597520986642
573.152330108166
481.632884248859
526.38137844037
-200.288234131268
135.025161330696
-530.842949077975
593.402814943804
-545.318039224201
47.9156061285998
-167.083542498387
-504.886355575216
325.052788728753
1241.62473070427
43.8981239446293
-139.439763719138
229.350458247749
138.811926389043
656.415182134825
133.186782593074
299.279677877679
168.029182767622
-424.142190387353
-469.269532453661
-465.179473238656
1372.75131159463
122.884077649907
836.251539988606
-786.449587051216
-904.454161221395
1307.72839159718
70.5713754898152
27.0378638658849
-473.738821921068
-223.130817079934
-79.6377833510787
-505.602113597422
423.720105342054
-525.46925334982
497.602031694622
-501.874453963921
-550.527823795622
893.224533182918
-542.190290432243
302.15834130829
170.454579509783
-613.254592781351
-115.606367891424
-283.550278268208
254.58904786721
-583.350515304341
-49.0998721594356
497.840777337949
865.24900373906
408.669117843196
-1020.46579234364
112.889184699521
-674.757318372925
-690.948334980362
177.242304095892
-525.731481441443
-456.176409413551
-220.507533992577
-156.080066393718
-96.0701123951171
163.863076357953
302.343294924668
254.394655651175
509.552669250513
241.05091846461
84.7808776874172
671.975018058304
-426.047148392468
210.539848166533
337.073604809884
-483.8038482507
-200.403734644513


Parameters (Session):
par1 = Default ; par2 = 1 ; par3 = 0 ; par4 = 0 ; par5 = 12 ; par6 = White Noise ; par7 = 0.95 ;
Parameters (R input):
par1 = FALSE ; par2 = 1 ; par3 = 1 ; par4 = 0 ; par5 = 12 ; par6 = 3 ; par7 = 1 ; par8 = 0 ; par9 = 0 ;
R code (references can be found in the software module):
par9 <- '1'
par8 <- '2'
par7 <- '1'
par6 <- '3'
par5 <- '12'
par4 <- '0'
par3 <- '1'
par2 <- '1'
par1 <- 'FALSE'
library(lattice)
if (par1 == 'TRUE') par1 <- TRUE
if (par1 == 'FALSE') par1 <- FALSE
par2 <- as.numeric(par2) #Box-Cox lambda transformation parameter
par3 <- as.numeric(par3) #degree of non-seasonal differencing
par4 <- as.numeric(par4) #degree of seasonal differencing
par5 <- as.numeric(par5) #seasonal period
par6 <- as.numeric(par6) #degree (p) of the non-seasonal AR(p) polynomial
par7 <- as.numeric(par7) #degree (q) of the non-seasonal MA(q) polynomial
par8 <- as.numeric(par8) #degree (P) of the seasonal AR(P) polynomial
par9 <- as.numeric(par9) #degree (Q) of the seasonal MA(Q) polynomial
armaGR <- function(arima.out, names, n){
try1 <- arima.out$coef
try2 <- sqrt(diag(arima.out$var.coef))
try.data.frame <- data.frame(matrix(NA,ncol=4,nrow=length(names)))
dimnames(try.data.frame) <- list(names,c('coef','std','tstat','pv'))
try.data.frame[,1] <- try1
for(i in 1:length(try2)) try.data.frame[which(rownames(try.data.frame)==names(try2)[i]),2] <- try2[i]
try.data.frame[,3] <- try.data.frame[,1] / try.data.frame[,2]
try.data.frame[,4] <- round((1-pt(abs(try.data.frame[,3]),df=n-(length(try2)+1)))*2,5)
vector <- rep(NA,length(names))
vector[is.na(try.data.frame[,4])] <- 0
maxi <- which.max(try.data.frame[,4])
continue <- max(try.data.frame[,4],na.rm=TRUE) > .05
vector[maxi] <- 0
list(summary=try.data.frame,next.vector=vector,continue=continue)
}
arimaSelect <- function(series, order=c(13,0,0), seasonal=list(order=c(2,0,0),period=12), include.mean=F){
nrc <- order[1]+order[3]+seasonal$order[1]+seasonal$order[3]
coeff <- matrix(NA, nrow=nrc*2, ncol=nrc)
pval <- matrix(NA, nrow=nrc*2, ncol=nrc)
mylist <- rep(list(NULL), nrc)
names <- NULL
if(order[1] > 0) names <- paste('ar',1:order[1],sep='')
if(order[3] > 0) names <- c( names , paste('ma',1:order[3],sep='') )
if(seasonal$order[1] > 0) names <- c(names, paste('sar',1:seasonal$order[1],sep=''))
if(seasonal$order[3] > 0) names <- c(names, paste('sma',1:seasonal$order[3],sep=''))
arima.out <- arima(series, order=order, seasonal=seasonal, include.mean=include.mean, method='ML')
mylist[[1]] <- arima.out
last.arma <- armaGR(arima.out, names, length(series))
mystop <- FALSE
i <- 1
coeff[i,] <- last.arma[[1]][,1]
pval [i,] <- last.arma[[1]][,4]
i <- 2
aic <- arima.out$aic
while(!mystop){
mylist[[i]] <- arima.out
arima.out <- arima(series, order=order, seasonal=seasonal, include.mean=include.mean, method='ML', fixed=last.arma$next.vector)
aic <- c(aic, arima.out$aic)
last.arma <- armaGR(arima.out, names, length(series))
mystop <- !last.arma$continue
coeff[i,] <- last.arma[[1]][,1]
pval [i,] <- last.arma[[1]][,4]
i <- i+1
}
list(coeff, pval, mylist, aic=aic)
}
arimaSelectplot <- function(arimaSelect.out,noms,choix){
noms <- names(arimaSelect.out[[3]][[1]]$coef)
coeff <- arimaSelect.out[[1]]
k <- min(which(is.na(coeff[,1])))-1
coeff <- coeff[1:k,]
pval <- arimaSelect.out[[2]][1:k,]
aic <- arimaSelect.out$aic[1:k]
coeff[coeff==0] <- NA
n <- ncol(coeff)
if(missing(choix)) choix <- k
layout(matrix(c(1,1,1,2,
3,3,3,2,
3,3,3,4,
5,6,7,7),nr=4),
widths=c(10,35,45,15),
heights=c(30,30,15,15))
couleurs <- rainbow(75)[1:50]#(50)
ticks <- pretty(coeff)
par(mar=c(1,1,3,1))
plot(aic,k:1-.5,type='o',pch=21,bg='blue',cex=2,axes=F,lty=2,xpd=NA)
points(aic[choix],k-choix+.5,pch=21,cex=4,bg=2,xpd=NA)
title('aic',line=2)
par(mar=c(3,0,0,0))
plot(0,axes=F,xlab='',ylab='',xlim=range(ticks),ylim=c(.1,1))
rect(xleft = min(ticks) + (0:49)/50*(max(ticks)-min(ticks)),
xright = min(ticks) + (1:50)/50*(max(ticks)-min(ticks)),
ytop = rep(1,50),
ybottom= rep(0,50),col=couleurs,border=NA)
axis(1,ticks)
rect(xleft=min(ticks),xright=max(ticks),ytop=1,ybottom=0)
text(mean(coeff,na.rm=T),.5,'coefficients',cex=2,font=2)
par(mar=c(1,1,3,1))
image(1:n,1:k,t(coeff[k:1,]),axes=F,col=couleurs,zlim=range(ticks))
for(i in 1:n) for(j in 1:k) if(!is.na(coeff[j,i])) {
if(pval[j,i]<.01) symb = 'green'
else if( (pval[j,i]<.05) & (pval[j,i]>=.01)) symb = 'orange'
else if( (pval[j,i]<.1) & (pval[j,i]>=.05)) symb = 'red'
else symb = 'black'
polygon(c(i+.5 ,i+.2 ,i+.5 ,i+.5),
c(k-j+0.5,k-j+0.5,k-j+0.8,k-j+0.5),
col=symb)
if(j==choix) {
rect(xleft=i-.5,
xright=i+.5,
ybottom=k-j+1.5,
ytop=k-j+.5,
lwd=4)
text(i,
k-j+1,
round(coeff[j,i],2),
cex=1.2,
font=2)
}
else{
rect(xleft=i-.5,xright=i+.5,ybottom=k-j+1.5,ytop=k-j+.5)
text(i,k-j+1,round(coeff[j,i],2),cex=1.2,font=1)
}
}
axis(3,1:n,noms)
par(mar=c(0.5,0,0,0.5))
plot(0,axes=F,xlab='',ylab='',type='n',xlim=c(0,8),ylim=c(-.2,.8))
cols <- c('green','orange','red','black')
niv <- c('0','0.01','0.05','0.1')
for(i in 0:3){
polygon(c(1+2*i ,1+2*i ,1+2*i-.5 ,1+2*i),
c(.4 ,.7 , .4 , .4),
col=cols[i+1])
text(2*i,0.5,niv[i+1],cex=1.5)
}
text(8,.5,1,cex=1.5)
text(4,0,'p-value',cex=2)
box()
residus <- arimaSelect.out[[3]][[choix]]$res
par(mar=c(1,2,4,1))
acf(residus,main='')
title('acf',line=.5)
par(mar=c(1,2,4,1))
pacf(residus,main='')
title('pacf',line=.5)
par(mar=c(2,2,4,1))
qqnorm(residus,main='')
title('qq-norm',line=.5)
qqline(residus)
residus
}
if (par2 == 0) x <- log(x)
if (par2 != 0) x <- x^par2
(selection <- arimaSelect(x, order=c(par6,par3,par7), seasonal=list(order=c(par8,par4,par9), period=par5)))
bitmap(file='test1.png')
resid <- arimaSelectplot(selection)
dev.off()
resid
bitmap(file='test2.png')
acf(resid,length(resid)/2, main='Residual Autocorrelation Function')
dev.off()
bitmap(file='test3.png')
pacf(resid,length(resid)/2, main='Residual Partial Autocorrelation Function')
dev.off()
bitmap(file='test4.png')
cpgram(resid, main='Residual Cumulative Periodogram')
dev.off()
bitmap(file='test5.png')
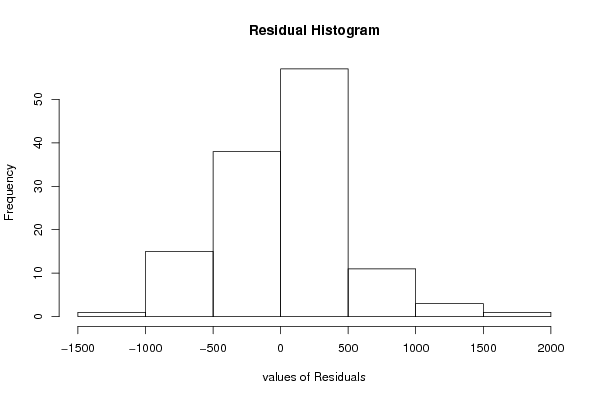
hist(resid, main='Residual Histogram', xlab='values of Residuals')
dev.off()
bitmap(file='test6.png')
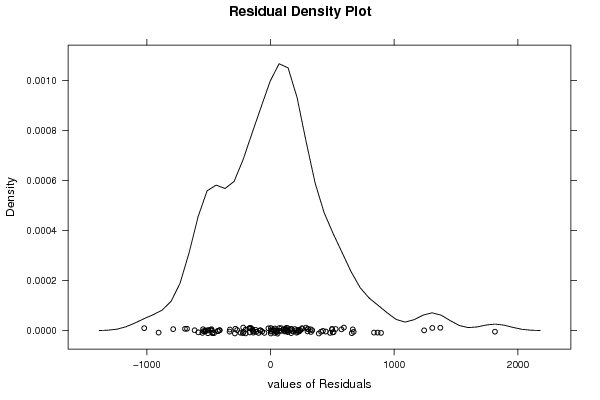
densityplot(~resid,col='black',main='Residual Density Plot', xlab='values of Residuals')
dev.off()
bitmap(file='test7.png')
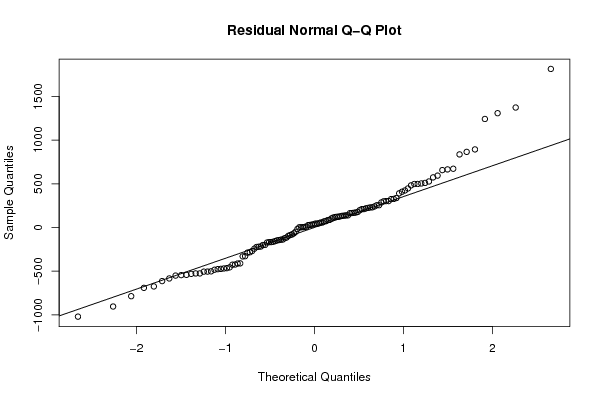
qqnorm(resid, main='Residual Normal Q-Q Plot')
qqline(resid)
dev.off()
ncols <- length(selection[[1]][1,])
nrows <- length(selection[[2]][,1])-1
load(file='createtable')
a<-table.start()
a<-table.row.start(a)
a<-table.element(a,'ARIMA Parameter Estimation and Backward Selection', ncols+1,TRUE)
a<-table.row.end(a)
a<-table.row.start(a)
a<-table.element(a,'Iteration', header=TRUE)
for (i in 1:ncols) {
a<-table.element(a,names(selection[[3]][[1]]$coef)[i],header=TRUE)
}
a<-table.row.end(a)
for (j in 1:nrows) {
a<-table.row.start(a)
mydum <- 'Estimates ('
mydum <- paste(mydum,j)
mydum <- paste(mydum,')')
a<-table.element(a,mydum, header=TRUE)
for (i in 1:ncols) {
a<-table.element(a,round(selection[[1]][j,i],4))
}
a<-table.row.end(a)
a<-table.row.start(a)
a<-table.element(a,'(p-val)', header=TRUE)
for (i in 1:ncols) {
mydum <- '('
mydum <- paste(mydum,round(selection[[2]][j,i],4),sep='')
mydum <- paste(mydum,')')
a<-table.element(a,mydum)
}
a<-table.row.end(a)
}
a<-table.end(a)
table.save(a,file='mytable.tab')
a<-table.start()
a<-table.row.start(a)
a<-table.element(a,'Estimated ARIMA Residuals', 1,TRUE)
a<-table.row.end(a)
a<-table.row.start(a)
a<-table.element(a,'Value', 1,TRUE)
a<-table.row.end(a)
for (i in (par4*par5+par3):length(resid)) {
a<-table.row.start(a)
a<-table.element(a,resid[i])
a<-table.row.end(a)
}
a<-table.end(a)
table.save(a,file='mytable1.tab')