Free Statistics

of Irreproducible Research!

Author's title

Author*The author of this computation has been verified*
R Software Modulerwasp_smp.wasp
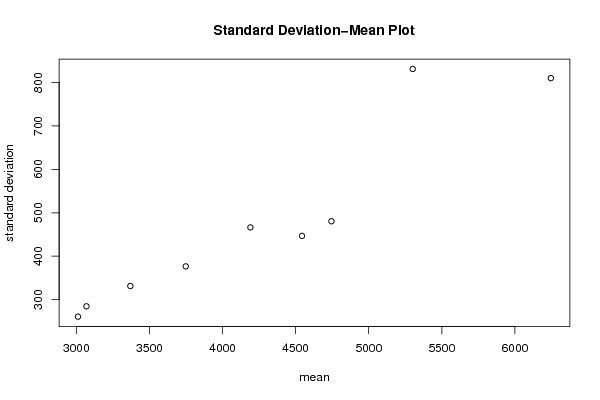
Title produced by softwareStandard Deviation-Mean Plot
Date of computationTue, 20 Dec 2016 14:57:55 +0100
Cite this page as followsStatistical Computations at FreeStatistics.org, Office for Research Development and Education, URL https://freestatistics.org/blog/index.php?v=date/2016/Dec/20/t1482242302uvn8i4nahs6wmhv.htm/, Retrieved Sun, 28 Apr 2024 10:47:52 +0000
Statistical Computations at FreeStatistics.org, Office for Research Development and Education, URL https://freestatistics.org/blog/index.php?pk=301677, Retrieved Sun, 28 Apr 2024 10:47:52 +0000
QR Codes:

Original text written by user:
IsPrivate?No (this computation is public)
User-defined keywords
Estimated Impact68
Family? (F = Feedback message, R = changed R code, M = changed R Module, P = changed Parameters, D = changed Data)
-       [Standard Deviation-Mean Plot] [Standard Deviatio...] [2016-12-20 13:57:55] [86c9a777e8dbb7ef3face68c75fc8376] [Current]
Feedback Forum

Post a new message
Dataseries X:
2720
2790
3395
2810
3095
3205
3030
2525
2915
3155
3190
3300
3015
3045
3380
2975
3105
2965
3110
2475
2770
3590
3300
3100
3010
3060
3360
3475
3600
3460
3575
2730
3100
3845
3455
3760
3655
3755
3845
3855
3530
3985
3775
2770
3485
4175
4030
4120
3440
3910
4480
4200
4270
4115
4285
3355
4135
4585
4480
5030
3875
4370
5115
4735
4580
4805
4760
3645
4215
4750
4605
5070
4415
4520
4960
4850
4605
5120
4780
3515
4590
5200
5100
5285
4925
5330
5830
5450
3980
3980
6470
4585
5010
6295
5720
6035
5765
5930
6335
6615
6220
6815
6870
4250
5600
7020
6270
7260
6455
7040
7760
8050
6690
8490


Summary of computational transaction
Raw Input view raw input (R code)
Raw Outputview raw output of R engine
Computing time1 seconds
R ServerBig Analytics Cloud Computing Center

\begin{tabular}{lllllllll}
\hline
Summary of computational transaction \tabularnewline
Raw Input view raw input (R code)  \tabularnewline
Raw Outputview raw output of R engine  \tabularnewline
Computing time1 seconds \tabularnewline
R ServerBig Analytics Cloud Computing Center \tabularnewline
\hline
\end{tabular}
%Source: https://freestatistics.org/blog/index.php?pk=301677&T=0

[TABLE]
[ROW]
Summary of computational transaction[/C][/ROW] [ROW]Raw Input[/C] view raw input (R code) [/C][/ROW] [ROW]Raw Output[/C]view raw output of R engine [/C][/ROW] [ROW]Computing time[/C]1 seconds[/C][/ROW] [ROW]R Server[/C]Big Analytics Cloud Computing Center[/C][/ROW] [/TABLE] Source: https://freestatistics.org/blog/index.php?pk=301677&T=0

Globally Unique Identifier (entire table): ba.freestatistics.org/blog/index.php?pk=301677&T=0

As an alternative you can also use a QR Code:  

The GUIDs for individual cells are displayed in the table below:

Summary of computational transaction
Raw Input view raw input (R code)
Raw Outputview raw output of R engine
Computing time1 seconds
R ServerBig Analytics Cloud Computing Center


Standard Deviation-Mean Plot
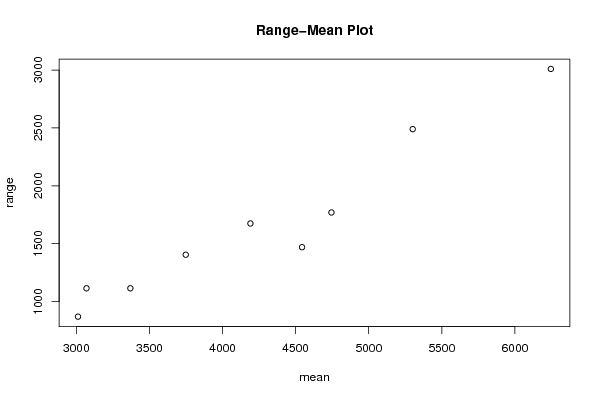
SectionMeanStandard DeviationRange
13010.83333333333260.7927889875870
23069.16666666667284.5797007177531115
33369.16666666667331.2910923625741115
43748.33333333333376.571454847631405
54190.41666666667466.332198863611675
64543.75446.7769679503511470
74745480.5110915378641770
85300.83333333333831.2417691549672490
96245.83333333333810.0668696677663010

\begin{tabular}{lllllllll}
\hline
Standard Deviation-Mean Plot \tabularnewline
Section & Mean & Standard Deviation & Range \tabularnewline
1 & 3010.83333333333 & 260.7927889875 & 870 \tabularnewline
2 & 3069.16666666667 & 284.579700717753 & 1115 \tabularnewline
3 & 3369.16666666667 & 331.291092362574 & 1115 \tabularnewline
4 & 3748.33333333333 & 376.57145484763 & 1405 \tabularnewline
5 & 4190.41666666667 & 466.33219886361 & 1675 \tabularnewline
6 & 4543.75 & 446.776967950351 & 1470 \tabularnewline
7 & 4745 & 480.511091537864 & 1770 \tabularnewline
8 & 5300.83333333333 & 831.241769154967 & 2490 \tabularnewline
9 & 6245.83333333333 & 810.066869667766 & 3010 \tabularnewline
\hline
\end{tabular}
%Source: https://freestatistics.org/blog/index.php?pk=301677&T=1

[TABLE]
[ROW][C]Standard Deviation-Mean Plot[/C][/ROW]
[ROW][C]Section[/C][C]Mean[/C][C]Standard Deviation[/C][C]Range[/C][/ROW]
[ROW][C]1[/C][C]3010.83333333333[/C][C]260.7927889875[/C][C]870[/C][/ROW]
[ROW][C]2[/C][C]3069.16666666667[/C][C]284.579700717753[/C][C]1115[/C][/ROW]
[ROW][C]3[/C][C]3369.16666666667[/C][C]331.291092362574[/C][C]1115[/C][/ROW]
[ROW][C]4[/C][C]3748.33333333333[/C][C]376.57145484763[/C][C]1405[/C][/ROW]
[ROW][C]5[/C][C]4190.41666666667[/C][C]466.33219886361[/C][C]1675[/C][/ROW]
[ROW][C]6[/C][C]4543.75[/C][C]446.776967950351[/C][C]1470[/C][/ROW]
[ROW][C]7[/C][C]4745[/C][C]480.511091537864[/C][C]1770[/C][/ROW]
[ROW][C]8[/C][C]5300.83333333333[/C][C]831.241769154967[/C][C]2490[/C][/ROW]
[ROW][C]9[/C][C]6245.83333333333[/C][C]810.066869667766[/C][C]3010[/C][/ROW]
[/TABLE]
Source: https://freestatistics.org/blog/index.php?pk=301677&T=1

Globally Unique Identifier (entire table): ba.freestatistics.org/blog/index.php?pk=301677&T=1

As an alternative you can also use a QR Code:  

The GUIDs for individual cells are displayed in the table below:

Standard Deviation-Mean Plot
SectionMeanStandard DeviationRange
13010.83333333333260.7927889875870
23069.16666666667284.5797007177531115
33369.16666666667331.2910923625741115
43748.33333333333376.571454847631405
54190.41666666667466.332198863611675
64543.75446.7769679503511470
74745480.5110915378641770
85300.83333333333831.2417691549672490
96245.83333333333810.0668696677663010


Regression: S.E.(k) = alpha + beta * Mean(k)
alpha-295.23398122862
beta0.181702357159177
S.D.0.0255505099712342
T-STAT7.11149630139455
p-value0.00019171727065252

\begin{tabular}{lllllllll}
\hline
Regression: S.E.(k) = alpha + beta * Mean(k) \tabularnewline
alpha & -295.23398122862 \tabularnewline
beta & 0.181702357159177 \tabularnewline
S.D. & 0.0255505099712342 \tabularnewline
T-STAT & 7.11149630139455 \tabularnewline
p-value & 0.00019171727065252 \tabularnewline
\hline
\end{tabular}
%Source: https://freestatistics.org/blog/index.php?pk=301677&T=2

[TABLE]
[ROW][C]Regression: S.E.(k) = alpha + beta * Mean(k)[/C][/ROW]
[ROW][C]alpha[/C][C]-295.23398122862[/C][/ROW]
[ROW][C]beta[/C][C]0.181702357159177[/C][/ROW]
[ROW][C]S.D.[/C][C]0.0255505099712342[/C][/ROW]
[ROW][C]T-STAT[/C][C]7.11149630139455[/C][/ROW]
[ROW][C]p-value[/C][C]0.00019171727065252[/C][/ROW]
[/TABLE]
Source: https://freestatistics.org/blog/index.php?pk=301677&T=2

Globally Unique Identifier (entire table): ba.freestatistics.org/blog/index.php?pk=301677&T=2

As an alternative you can also use a QR Code:  

The GUIDs for individual cells are displayed in the table below:

Regression: S.E.(k) = alpha + beta * Mean(k)
alpha-295.23398122862
beta0.181702357159177
S.D.0.0255505099712342
T-STAT7.11149630139455
p-value0.00019171727065252


Regression: ln S.E.(k) = alpha + beta * ln Mean(k)
alpha-7.09930472688877
beta1.5838778352577
S.D.0.169107995767156
T-STAT9.36607301193808
p-value3.2889795760265e-05
Lambda-0.583877835257698

\begin{tabular}{lllllllll}
\hline
Regression: ln S.E.(k) = alpha + beta * ln Mean(k) \tabularnewline
alpha & -7.09930472688877 \tabularnewline
beta & 1.5838778352577 \tabularnewline
S.D. & 0.169107995767156 \tabularnewline
T-STAT & 9.36607301193808 \tabularnewline
p-value & 3.2889795760265e-05 \tabularnewline
Lambda & -0.583877835257698 \tabularnewline
\hline
\end{tabular}
%Source: https://freestatistics.org/blog/index.php?pk=301677&T=3

[TABLE]
[ROW][C]Regression: ln S.E.(k) = alpha + beta * ln Mean(k)[/C][/ROW]
[ROW][C]alpha[/C][C]-7.09930472688877[/C][/ROW]
[ROW][C]beta[/C][C]1.5838778352577[/C][/ROW]
[ROW][C]S.D.[/C][C]0.169107995767156[/C][/ROW]
[ROW][C]T-STAT[/C][C]9.36607301193808[/C][/ROW]
[ROW][C]p-value[/C][C]3.2889795760265e-05[/C][/ROW]
[ROW][C]Lambda[/C][C]-0.583877835257698[/C][/ROW]
[/TABLE]
Source: https://freestatistics.org/blog/index.php?pk=301677&T=3

Globally Unique Identifier (entire table): ba.freestatistics.org/blog/index.php?pk=301677&T=3

As an alternative you can also use a QR Code:  

The GUIDs for individual cells are displayed in the table below:

Regression: ln S.E.(k) = alpha + beta * ln Mean(k)
alpha-7.09930472688877
beta1.5838778352577
S.D.0.169107995767156
T-STAT9.36607301193808
p-value3.2889795760265e-05
Lambda-0.583877835257698


Parameters (Session):
par1 = Default ; par2 = 1 ; par3 = 1 ; par4 = 1 ; par5 = 12 ; par6 = White Noise ; par7 = 0.95 ;
Parameters (R input):
par1 = 12 ;
R code (references can be found in the software module):
par1 <- as.numeric(par1)
(n <- length(x))
(np <- floor(n / par1))
arr <- array(NA,dim=c(par1,np))
j <- 0
k <- 1
for (i in 1:(np*par1))
{
j = j + 1
arr[j,k] <- x[i]
if (j == par1) {
j = 0
k=k+1
}
}
arr
arr.mean <- array(NA,dim=np)
arr.sd <- array(NA,dim=np)
arr.range <- array(NA,dim=np)
for (j in 1:np)
{
arr.mean[j] <- mean(arr[,j],na.rm=TRUE)
arr.sd[j] <- sd(arr[,j],na.rm=TRUE)
arr.range[j] <- max(arr[,j],na.rm=TRUE) - min(arr[,j],na.rm=TRUE)
}
arr.mean
arr.sd
arr.range
(lm1 <- lm(arr.sd~arr.mean))
(lnlm1 <- lm(log(arr.sd)~log(arr.mean)))
(lm2 <- lm(arr.range~arr.mean))
bitmap(file='test1.png')
plot(arr.mean,arr.sd,main='Standard Deviation-Mean Plot',xlab='mean',ylab='standard deviation')
dev.off()
bitmap(file='test2.png')
plot(arr.mean,arr.range,main='Range-Mean Plot',xlab='mean',ylab='range')
dev.off()
load(file='createtable')
a<-table.start()
a<-table.row.start(a)
a<-table.element(a,'Standard Deviation-Mean Plot',4,TRUE)
a<-table.row.end(a)
a<-table.row.start(a)
a<-table.element(a,'Section',header=TRUE)
a<-table.element(a,'Mean',header=TRUE)
a<-table.element(a,'Standard Deviation',header=TRUE)
a<-table.element(a,'Range',header=TRUE)
a<-table.row.end(a)
for (j in 1:np) {
a<-table.row.start(a)
a<-table.element(a,j,header=TRUE)
a<-table.element(a,arr.mean[j])
a<-table.element(a,arr.sd[j] )
a<-table.element(a,arr.range[j] )
a<-table.row.end(a)
}
a<-table.end(a)
table.save(a,file='mytable.tab')
a<-table.start()
a<-table.row.start(a)
a<-table.element(a,'Regression: S.E.(k) = alpha + beta * Mean(k)',2,TRUE)
a<-table.row.end(a)
a<-table.row.start(a)
a<-table.element(a,'alpha',header=TRUE)
a<-table.element(a,lm1$coefficients[[1]])
a<-table.row.end(a)
a<-table.row.start(a)
a<-table.element(a,'beta',header=TRUE)
a<-table.element(a,lm1$coefficients[[2]])
a<-table.row.end(a)
a<-table.row.start(a)
a<-table.element(a,'S.D.',header=TRUE)
a<-table.element(a,summary(lm1)$coefficients[2,2])
a<-table.row.end(a)
a<-table.row.start(a)
a<-table.element(a,'T-STAT',header=TRUE)
a<-table.element(a,summary(lm1)$coefficients[2,3])
a<-table.row.end(a)
a<-table.row.start(a)
a<-table.element(a,'p-value',header=TRUE)
a<-table.element(a,summary(lm1)$coefficients[2,4])
a<-table.row.end(a)
a<-table.end(a)
table.save(a,file='mytable1.tab')
a<-table.start()
a<-table.row.start(a)
a<-table.element(a,'Regression: ln S.E.(k) = alpha + beta * ln Mean(k)',2,TRUE)
a<-table.row.end(a)
a<-table.row.start(a)
a<-table.element(a,'alpha',header=TRUE)
a<-table.element(a,lnlm1$coefficients[[1]])
a<-table.row.end(a)
a<-table.row.start(a)
a<-table.element(a,'beta',header=TRUE)
a<-table.element(a,lnlm1$coefficients[[2]])
a<-table.row.end(a)
a<-table.row.start(a)
a<-table.element(a,'S.D.',header=TRUE)
a<-table.element(a,summary(lnlm1)$coefficients[2,2])
a<-table.row.end(a)
a<-table.row.start(a)
a<-table.element(a,'T-STAT',header=TRUE)
a<-table.element(a,summary(lnlm1)$coefficients[2,3])
a<-table.row.end(a)
a<-table.row.start(a)
a<-table.element(a,'p-value',header=TRUE)
a<-table.element(a,summary(lnlm1)$coefficients[2,4])
a<-table.row.end(a)
a<-table.row.start(a)
a<-table.element(a,'Lambda',header=TRUE)
a<-table.element(a,1-lnlm1$coefficients[[2]])
a<-table.row.end(a)
a<-table.end(a)
table.save(a,file='mytable2.tab')