Free Statistics

of Irreproducible Research!

Author's title

Author*The author of this computation has been verified*
R Software Modulerwasp_autocorrelation.wasp
Title produced by software(Partial) Autocorrelation Function
Date of computationTue, 20 Dec 2016 15:03:25 +0100
Cite this page as followsStatistical Computations at FreeStatistics.org, Office for Research Development and Education, URL https://freestatistics.org/blog/index.php?v=date/2016/Dec/20/t1482242686pn1andx999a94lh.htm/, Retrieved Sun, 28 Apr 2024 09:30:18 +0000
Statistical Computations at FreeStatistics.org, Office for Research Development and Education, URL https://freestatistics.org/blog/index.php?pk=301681, Retrieved Sun, 28 Apr 2024 09:30:18 +0000
QR Codes:

Original text written by user:
IsPrivate?No (this computation is public)
User-defined keywords
Estimated Impact62
Family? (F = Feedback message, R = changed R code, M = changed R Module, P = changed Parameters, D = changed Data)
-       [(Partial) Autocorrelation Function] [N1668 Autocorrela...] [2016-12-20 14:03:25] [da1cd5b79b9c78a074da6b069a6d8376] [Current]
Feedback Forum

Post a new message
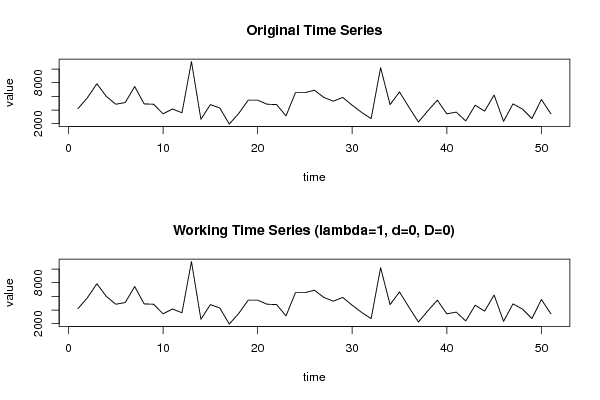
Dataseries X:
4200
5800
7850
6000
4850
5100
7450
4900
4850
3450
4150
3600
11100
2650
4800
4300
1950
3500
5450
5450
4850
4800
3150
6550
6550
6900
5850
5300
5850
4700
3650
2750
10200
4800
6650
4400
2250
3900
5450
3450
3700
2400
4700
3850
6200
2350
4900
4150
2750
5550
3450


Summary of computational transaction
Raw Input view raw input (R code)
Raw Outputview raw output of R engine
Computing time1 seconds
R ServerBig Analytics Cloud Computing Center

\begin{tabular}{lllllllll}
\hline
Summary of computational transaction \tabularnewline
Raw Input view raw input (R code)  \tabularnewline
Raw Outputview raw output of R engine  \tabularnewline
Computing time1 seconds \tabularnewline
R ServerBig Analytics Cloud Computing Center \tabularnewline
\hline
\end{tabular}
%Source: https://freestatistics.org/blog/index.php?pk=301681&T=0

[TABLE]
[ROW]
Summary of computational transaction[/C][/ROW] [ROW]Raw Input[/C] view raw input (R code) [/C][/ROW] [ROW]Raw Output[/C]view raw output of R engine [/C][/ROW] [ROW]Computing time[/C]1 seconds[/C][/ROW] [ROW]R Server[/C]Big Analytics Cloud Computing Center[/C][/ROW] [/TABLE] Source: https://freestatistics.org/blog/index.php?pk=301681&T=0

Globally Unique Identifier (entire table): ba.freestatistics.org/blog/index.php?pk=301681&T=0

As an alternative you can also use a QR Code:  

The GUIDs for individual cells are displayed in the table below:

Summary of computational transaction
Raw Input view raw input (R code)
Raw Outputview raw output of R engine
Computing time1 seconds
R ServerBig Analytics Cloud Computing Center


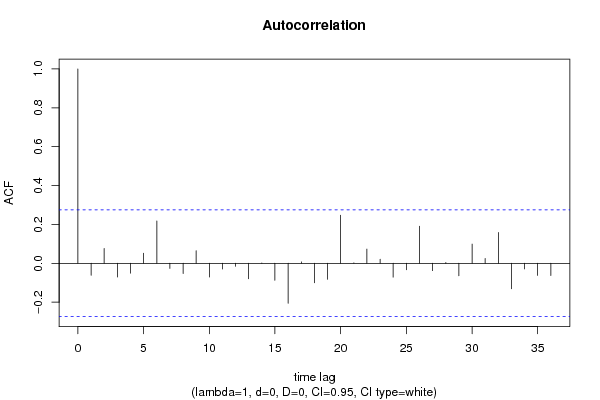
Autocorrelation Function
Time lag kACF(k)T-STATP-value
1-0.061259-0.43750.331806
20.0763880.54550.293887
3-0.07058-0.5040.308202
4-0.05075-0.36240.359266
50.052220.37290.355374
60.2173511.55220.0634
7-0.026076-0.18620.426505
8-0.052646-0.3760.354251
90.064920.46360.322445
10-0.070155-0.5010.30926
11-0.029219-0.20870.417771
12-0.014774-0.10550.458192
13-0.079523-0.56790.286295
140.0015780.01130.495526
15-0.08754-0.62520.267326
16-0.205706-1.4690.073983
170.0072520.05180.47945
18-0.100045-0.71450.2391
19-0.082067-0.58610.280205
200.2476491.76860.041473
210.0006940.0050.498033
220.0729020.52060.30244
230.020790.14850.441279
24-0.071082-0.50760.306951
25-0.033038-0.23590.407213
260.1908071.36260.089493
27-0.037635-0.26880.394596
280.0041310.02950.488289
29-0.06422-0.45860.324226
300.0986570.70450.242148
310.0250410.17880.42939
320.1582751.13030.131817
33-0.131364-0.93810.176301
34-0.028782-0.20550.418981
35-0.062149-0.44380.32952
36-0.062794-0.44840.327869

\begin{tabular}{lllllllll}
\hline
Autocorrelation Function \tabularnewline
Time lag k & ACF(k) & T-STAT & P-value \tabularnewline
1 & -0.061259 & -0.4375 & 0.331806 \tabularnewline
2 & 0.076388 & 0.5455 & 0.293887 \tabularnewline
3 & -0.07058 & -0.504 & 0.308202 \tabularnewline
4 & -0.05075 & -0.3624 & 0.359266 \tabularnewline
5 & 0.05222 & 0.3729 & 0.355374 \tabularnewline
6 & 0.217351 & 1.5522 & 0.0634 \tabularnewline
7 & -0.026076 & -0.1862 & 0.426505 \tabularnewline
8 & -0.052646 & -0.376 & 0.354251 \tabularnewline
9 & 0.06492 & 0.4636 & 0.322445 \tabularnewline
10 & -0.070155 & -0.501 & 0.30926 \tabularnewline
11 & -0.029219 & -0.2087 & 0.417771 \tabularnewline
12 & -0.014774 & -0.1055 & 0.458192 \tabularnewline
13 & -0.079523 & -0.5679 & 0.286295 \tabularnewline
14 & 0.001578 & 0.0113 & 0.495526 \tabularnewline
15 & -0.08754 & -0.6252 & 0.267326 \tabularnewline
16 & -0.205706 & -1.469 & 0.073983 \tabularnewline
17 & 0.007252 & 0.0518 & 0.47945 \tabularnewline
18 & -0.100045 & -0.7145 & 0.2391 \tabularnewline
19 & -0.082067 & -0.5861 & 0.280205 \tabularnewline
20 & 0.247649 & 1.7686 & 0.041473 \tabularnewline
21 & 0.000694 & 0.005 & 0.498033 \tabularnewline
22 & 0.072902 & 0.5206 & 0.30244 \tabularnewline
23 & 0.02079 & 0.1485 & 0.441279 \tabularnewline
24 & -0.071082 & -0.5076 & 0.306951 \tabularnewline
25 & -0.033038 & -0.2359 & 0.407213 \tabularnewline
26 & 0.190807 & 1.3626 & 0.089493 \tabularnewline
27 & -0.037635 & -0.2688 & 0.394596 \tabularnewline
28 & 0.004131 & 0.0295 & 0.488289 \tabularnewline
29 & -0.06422 & -0.4586 & 0.324226 \tabularnewline
30 & 0.098657 & 0.7045 & 0.242148 \tabularnewline
31 & 0.025041 & 0.1788 & 0.42939 \tabularnewline
32 & 0.158275 & 1.1303 & 0.131817 \tabularnewline
33 & -0.131364 & -0.9381 & 0.176301 \tabularnewline
34 & -0.028782 & -0.2055 & 0.418981 \tabularnewline
35 & -0.062149 & -0.4438 & 0.32952 \tabularnewline
36 & -0.062794 & -0.4484 & 0.327869 \tabularnewline
\hline
\end{tabular}
%Source: https://freestatistics.org/blog/index.php?pk=301681&T=1

[TABLE]
[ROW][C]Autocorrelation Function[/C][/ROW]
[ROW][C]Time lag k[/C][C]ACF(k)[/C][C]T-STAT[/C][C]P-value[/C][/ROW]
[ROW][C]1[/C][C]-0.061259[/C][C]-0.4375[/C][C]0.331806[/C][/ROW]
[ROW][C]2[/C][C]0.076388[/C][C]0.5455[/C][C]0.293887[/C][/ROW]
[ROW][C]3[/C][C]-0.07058[/C][C]-0.504[/C][C]0.308202[/C][/ROW]
[ROW][C]4[/C][C]-0.05075[/C][C]-0.3624[/C][C]0.359266[/C][/ROW]
[ROW][C]5[/C][C]0.05222[/C][C]0.3729[/C][C]0.355374[/C][/ROW]
[ROW][C]6[/C][C]0.217351[/C][C]1.5522[/C][C]0.0634[/C][/ROW]
[ROW][C]7[/C][C]-0.026076[/C][C]-0.1862[/C][C]0.426505[/C][/ROW]
[ROW][C]8[/C][C]-0.052646[/C][C]-0.376[/C][C]0.354251[/C][/ROW]
[ROW][C]9[/C][C]0.06492[/C][C]0.4636[/C][C]0.322445[/C][/ROW]
[ROW][C]10[/C][C]-0.070155[/C][C]-0.501[/C][C]0.30926[/C][/ROW]
[ROW][C]11[/C][C]-0.029219[/C][C]-0.2087[/C][C]0.417771[/C][/ROW]
[ROW][C]12[/C][C]-0.014774[/C][C]-0.1055[/C][C]0.458192[/C][/ROW]
[ROW][C]13[/C][C]-0.079523[/C][C]-0.5679[/C][C]0.286295[/C][/ROW]
[ROW][C]14[/C][C]0.001578[/C][C]0.0113[/C][C]0.495526[/C][/ROW]
[ROW][C]15[/C][C]-0.08754[/C][C]-0.6252[/C][C]0.267326[/C][/ROW]
[ROW][C]16[/C][C]-0.205706[/C][C]-1.469[/C][C]0.073983[/C][/ROW]
[ROW][C]17[/C][C]0.007252[/C][C]0.0518[/C][C]0.47945[/C][/ROW]
[ROW][C]18[/C][C]-0.100045[/C][C]-0.7145[/C][C]0.2391[/C][/ROW]
[ROW][C]19[/C][C]-0.082067[/C][C]-0.5861[/C][C]0.280205[/C][/ROW]
[ROW][C]20[/C][C]0.247649[/C][C]1.7686[/C][C]0.041473[/C][/ROW]
[ROW][C]21[/C][C]0.000694[/C][C]0.005[/C][C]0.498033[/C][/ROW]
[ROW][C]22[/C][C]0.072902[/C][C]0.5206[/C][C]0.30244[/C][/ROW]
[ROW][C]23[/C][C]0.02079[/C][C]0.1485[/C][C]0.441279[/C][/ROW]
[ROW][C]24[/C][C]-0.071082[/C][C]-0.5076[/C][C]0.306951[/C][/ROW]
[ROW][C]25[/C][C]-0.033038[/C][C]-0.2359[/C][C]0.407213[/C][/ROW]
[ROW][C]26[/C][C]0.190807[/C][C]1.3626[/C][C]0.089493[/C][/ROW]
[ROW][C]27[/C][C]-0.037635[/C][C]-0.2688[/C][C]0.394596[/C][/ROW]
[ROW][C]28[/C][C]0.004131[/C][C]0.0295[/C][C]0.488289[/C][/ROW]
[ROW][C]29[/C][C]-0.06422[/C][C]-0.4586[/C][C]0.324226[/C][/ROW]
[ROW][C]30[/C][C]0.098657[/C][C]0.7045[/C][C]0.242148[/C][/ROW]
[ROW][C]31[/C][C]0.025041[/C][C]0.1788[/C][C]0.42939[/C][/ROW]
[ROW][C]32[/C][C]0.158275[/C][C]1.1303[/C][C]0.131817[/C][/ROW]
[ROW][C]33[/C][C]-0.131364[/C][C]-0.9381[/C][C]0.176301[/C][/ROW]
[ROW][C]34[/C][C]-0.028782[/C][C]-0.2055[/C][C]0.418981[/C][/ROW]
[ROW][C]35[/C][C]-0.062149[/C][C]-0.4438[/C][C]0.32952[/C][/ROW]
[ROW][C]36[/C][C]-0.062794[/C][C]-0.4484[/C][C]0.327869[/C][/ROW]
[/TABLE]
Source: https://freestatistics.org/blog/index.php?pk=301681&T=1

Globally Unique Identifier (entire table): ba.freestatistics.org/blog/index.php?pk=301681&T=1

As an alternative you can also use a QR Code:  

The GUIDs for individual cells are displayed in the table below:

Autocorrelation Function
Time lag kACF(k)T-STATP-value
1-0.061259-0.43750.331806
20.0763880.54550.293887
3-0.07058-0.5040.308202
4-0.05075-0.36240.359266
50.052220.37290.355374
60.2173511.55220.0634
7-0.026076-0.18620.426505
8-0.052646-0.3760.354251
90.064920.46360.322445
10-0.070155-0.5010.30926
11-0.029219-0.20870.417771
12-0.014774-0.10550.458192
13-0.079523-0.56790.286295
140.0015780.01130.495526
15-0.08754-0.62520.267326
16-0.205706-1.4690.073983
170.0072520.05180.47945
18-0.100045-0.71450.2391
19-0.082067-0.58610.280205
200.2476491.76860.041473
210.0006940.0050.498033
220.0729020.52060.30244
230.020790.14850.441279
24-0.071082-0.50760.306951
25-0.033038-0.23590.407213
260.1908071.36260.089493
27-0.037635-0.26880.394596
280.0041310.02950.488289
29-0.06422-0.45860.324226
300.0986570.70450.242148
310.0250410.17880.42939
320.1582751.13030.131817
33-0.131364-0.93810.176301
34-0.028782-0.20550.418981
35-0.062149-0.44380.32952
36-0.062794-0.44840.327869


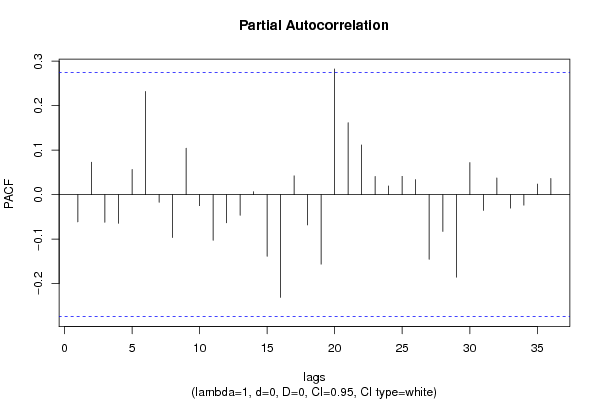
Partial Autocorrelation Function
Time lag kPACF(k)T-STATP-value
1-0.061259-0.43750.331806
20.0729090.52070.302423
3-0.062339-0.44520.329033
4-0.064386-0.45980.323805
50.0566130.40430.343842
60.2319161.65620.05191
7-0.017193-0.12280.451382
8-0.096409-0.68850.247129
90.1042680.74460.229959
10-0.024809-0.17720.430036
11-0.102532-0.73220.233691
12-0.063464-0.45320.326156
13-0.046448-0.33170.370735
140.0065980.04710.481301
15-0.138569-0.98960.163525
16-0.231079-1.65020.05252
170.0422010.30140.382176
18-0.068049-0.4860.314535
19-0.156342-1.11650.134719
200.2825762.0180.024433
210.1616341.15430.126879
220.1116520.79740.214471
230.0407240.29080.386181
240.0193370.13810.445354
250.0410710.29330.385239
260.0336870.24060.405426
27-0.145304-1.03770.152157
28-0.082716-0.59070.278662
29-0.185597-1.32540.095468
300.0719990.51420.304675
31-0.035403-0.25280.40071
320.0372090.26570.395761
33-0.030352-0.21680.414631
34-0.023717-0.16940.433085
350.0235630.16830.433518
360.0361930.25850.398542

\begin{tabular}{lllllllll}
\hline
Partial Autocorrelation Function \tabularnewline
Time lag k & PACF(k) & T-STAT & P-value \tabularnewline
1 & -0.061259 & -0.4375 & 0.331806 \tabularnewline
2 & 0.072909 & 0.5207 & 0.302423 \tabularnewline
3 & -0.062339 & -0.4452 & 0.329033 \tabularnewline
4 & -0.064386 & -0.4598 & 0.323805 \tabularnewline
5 & 0.056613 & 0.4043 & 0.343842 \tabularnewline
6 & 0.231916 & 1.6562 & 0.05191 \tabularnewline
7 & -0.017193 & -0.1228 & 0.451382 \tabularnewline
8 & -0.096409 & -0.6885 & 0.247129 \tabularnewline
9 & 0.104268 & 0.7446 & 0.229959 \tabularnewline
10 & -0.024809 & -0.1772 & 0.430036 \tabularnewline
11 & -0.102532 & -0.7322 & 0.233691 \tabularnewline
12 & -0.063464 & -0.4532 & 0.326156 \tabularnewline
13 & -0.046448 & -0.3317 & 0.370735 \tabularnewline
14 & 0.006598 & 0.0471 & 0.481301 \tabularnewline
15 & -0.138569 & -0.9896 & 0.163525 \tabularnewline
16 & -0.231079 & -1.6502 & 0.05252 \tabularnewline
17 & 0.042201 & 0.3014 & 0.382176 \tabularnewline
18 & -0.068049 & -0.486 & 0.314535 \tabularnewline
19 & -0.156342 & -1.1165 & 0.134719 \tabularnewline
20 & 0.282576 & 2.018 & 0.024433 \tabularnewline
21 & 0.161634 & 1.1543 & 0.126879 \tabularnewline
22 & 0.111652 & 0.7974 & 0.214471 \tabularnewline
23 & 0.040724 & 0.2908 & 0.386181 \tabularnewline
24 & 0.019337 & 0.1381 & 0.445354 \tabularnewline
25 & 0.041071 & 0.2933 & 0.385239 \tabularnewline
26 & 0.033687 & 0.2406 & 0.405426 \tabularnewline
27 & -0.145304 & -1.0377 & 0.152157 \tabularnewline
28 & -0.082716 & -0.5907 & 0.278662 \tabularnewline
29 & -0.185597 & -1.3254 & 0.095468 \tabularnewline
30 & 0.071999 & 0.5142 & 0.304675 \tabularnewline
31 & -0.035403 & -0.2528 & 0.40071 \tabularnewline
32 & 0.037209 & 0.2657 & 0.395761 \tabularnewline
33 & -0.030352 & -0.2168 & 0.414631 \tabularnewline
34 & -0.023717 & -0.1694 & 0.433085 \tabularnewline
35 & 0.023563 & 0.1683 & 0.433518 \tabularnewline
36 & 0.036193 & 0.2585 & 0.398542 \tabularnewline
\hline
\end{tabular}
%Source: https://freestatistics.org/blog/index.php?pk=301681&T=2

[TABLE]
[ROW][C]Partial Autocorrelation Function[/C][/ROW]
[ROW][C]Time lag k[/C][C]PACF(k)[/C][C]T-STAT[/C][C]P-value[/C][/ROW]
[ROW][C]1[/C][C]-0.061259[/C][C]-0.4375[/C][C]0.331806[/C][/ROW]
[ROW][C]2[/C][C]0.072909[/C][C]0.5207[/C][C]0.302423[/C][/ROW]
[ROW][C]3[/C][C]-0.062339[/C][C]-0.4452[/C][C]0.329033[/C][/ROW]
[ROW][C]4[/C][C]-0.064386[/C][C]-0.4598[/C][C]0.323805[/C][/ROW]
[ROW][C]5[/C][C]0.056613[/C][C]0.4043[/C][C]0.343842[/C][/ROW]
[ROW][C]6[/C][C]0.231916[/C][C]1.6562[/C][C]0.05191[/C][/ROW]
[ROW][C]7[/C][C]-0.017193[/C][C]-0.1228[/C][C]0.451382[/C][/ROW]
[ROW][C]8[/C][C]-0.096409[/C][C]-0.6885[/C][C]0.247129[/C][/ROW]
[ROW][C]9[/C][C]0.104268[/C][C]0.7446[/C][C]0.229959[/C][/ROW]
[ROW][C]10[/C][C]-0.024809[/C][C]-0.1772[/C][C]0.430036[/C][/ROW]
[ROW][C]11[/C][C]-0.102532[/C][C]-0.7322[/C][C]0.233691[/C][/ROW]
[ROW][C]12[/C][C]-0.063464[/C][C]-0.4532[/C][C]0.326156[/C][/ROW]
[ROW][C]13[/C][C]-0.046448[/C][C]-0.3317[/C][C]0.370735[/C][/ROW]
[ROW][C]14[/C][C]0.006598[/C][C]0.0471[/C][C]0.481301[/C][/ROW]
[ROW][C]15[/C][C]-0.138569[/C][C]-0.9896[/C][C]0.163525[/C][/ROW]
[ROW][C]16[/C][C]-0.231079[/C][C]-1.6502[/C][C]0.05252[/C][/ROW]
[ROW][C]17[/C][C]0.042201[/C][C]0.3014[/C][C]0.382176[/C][/ROW]
[ROW][C]18[/C][C]-0.068049[/C][C]-0.486[/C][C]0.314535[/C][/ROW]
[ROW][C]19[/C][C]-0.156342[/C][C]-1.1165[/C][C]0.134719[/C][/ROW]
[ROW][C]20[/C][C]0.282576[/C][C]2.018[/C][C]0.024433[/C][/ROW]
[ROW][C]21[/C][C]0.161634[/C][C]1.1543[/C][C]0.126879[/C][/ROW]
[ROW][C]22[/C][C]0.111652[/C][C]0.7974[/C][C]0.214471[/C][/ROW]
[ROW][C]23[/C][C]0.040724[/C][C]0.2908[/C][C]0.386181[/C][/ROW]
[ROW][C]24[/C][C]0.019337[/C][C]0.1381[/C][C]0.445354[/C][/ROW]
[ROW][C]25[/C][C]0.041071[/C][C]0.2933[/C][C]0.385239[/C][/ROW]
[ROW][C]26[/C][C]0.033687[/C][C]0.2406[/C][C]0.405426[/C][/ROW]
[ROW][C]27[/C][C]-0.145304[/C][C]-1.0377[/C][C]0.152157[/C][/ROW]
[ROW][C]28[/C][C]-0.082716[/C][C]-0.5907[/C][C]0.278662[/C][/ROW]
[ROW][C]29[/C][C]-0.185597[/C][C]-1.3254[/C][C]0.095468[/C][/ROW]
[ROW][C]30[/C][C]0.071999[/C][C]0.5142[/C][C]0.304675[/C][/ROW]
[ROW][C]31[/C][C]-0.035403[/C][C]-0.2528[/C][C]0.40071[/C][/ROW]
[ROW][C]32[/C][C]0.037209[/C][C]0.2657[/C][C]0.395761[/C][/ROW]
[ROW][C]33[/C][C]-0.030352[/C][C]-0.2168[/C][C]0.414631[/C][/ROW]
[ROW][C]34[/C][C]-0.023717[/C][C]-0.1694[/C][C]0.433085[/C][/ROW]
[ROW][C]35[/C][C]0.023563[/C][C]0.1683[/C][C]0.433518[/C][/ROW]
[ROW][C]36[/C][C]0.036193[/C][C]0.2585[/C][C]0.398542[/C][/ROW]
[/TABLE]
Source: https://freestatistics.org/blog/index.php?pk=301681&T=2

Globally Unique Identifier (entire table): ba.freestatistics.org/blog/index.php?pk=301681&T=2

As an alternative you can also use a QR Code:  

The GUIDs for individual cells are displayed in the table below:

Partial Autocorrelation Function
Time lag kPACF(k)T-STATP-value
1-0.061259-0.43750.331806
20.0729090.52070.302423
3-0.062339-0.44520.329033
4-0.064386-0.45980.323805
50.0566130.40430.343842
60.2319161.65620.05191
7-0.017193-0.12280.451382
8-0.096409-0.68850.247129
90.1042680.74460.229959
10-0.024809-0.17720.430036
11-0.102532-0.73220.233691
12-0.063464-0.45320.326156
13-0.046448-0.33170.370735
140.0065980.04710.481301
15-0.138569-0.98960.163525
16-0.231079-1.65020.05252
170.0422010.30140.382176
18-0.068049-0.4860.314535
19-0.156342-1.11650.134719
200.2825762.0180.024433
210.1616341.15430.126879
220.1116520.79740.214471
230.0407240.29080.386181
240.0193370.13810.445354
250.0410710.29330.385239
260.0336870.24060.405426
27-0.145304-1.03770.152157
28-0.082716-0.59070.278662
29-0.185597-1.32540.095468
300.0719990.51420.304675
31-0.035403-0.25280.40071
320.0372090.26570.395761
33-0.030352-0.21680.414631
34-0.023717-0.16940.433085
350.0235630.16830.433518
360.0361930.25850.398542


Parameters (Session):
par1 = 60 ; par2 = 1 ; par3 = 0 ; par4 = 1 ; par5 = 12 ; par6 = White Noise ; par7 = 0.95 ;
Parameters (R input):
par1 = 36 ; par2 = 1 ; par3 = 0 ; par4 = 0 ; par5 = 12 ; par6 = White Noise ; par7 = 0.95 ; par8 = ;
R code (references can be found in the software module):
par8 <- ''
par7 <- '0.95'
par6 <- 'White Noise'
par5 <- '12'
par4 <- '0'
par3 <- '0'
par2 <- '1'
par1 <- 'Default'
if (par1 == 'Default') {
par1 = 10*log10(length(x))
} else {
par1 <- as.numeric(par1)
}
par2 <- as.numeric(par2)
par3 <- as.numeric(par3)
par4 <- as.numeric(par4)
par5 <- as.numeric(par5)
if (par6 == 'White Noise') par6 <- 'white' else par6 <- 'ma'
par7 <- as.numeric(par7)
if (par8 != '') par8 <- as.numeric(par8)
x <- na.omit(x)
ox <- x
if (par8 == '') {
if (par2 == 0) {
x <- log(x)
} else {
x <- (x ^ par2 - 1) / par2
}
} else {
x <- log(x,base=par8)
}
if (par3 > 0) x <- diff(x,lag=1,difference=par3)
if (par4 > 0) x <- diff(x,lag=par5,difference=par4)
bitmap(file='picts.png')
op <- par(mfrow=c(2,1))
plot(ox,type='l',main='Original Time Series',xlab='time',ylab='value')
if (par8=='') {
mytitle <- paste('Working Time Series (lambda=',par2,', d=',par3,', D=',par4,')',sep='')
mysub <- paste('(lambda=',par2,', d=',par3,', D=',par4,', CI=', par7, ', CI type=',par6,')',sep='')
} else {
mytitle <- paste('Working Time Series (base=',par8,', d=',par3,', D=',par4,')',sep='')
mysub <- paste('(base=',par8,', d=',par3,', D=',par4,', CI=', par7, ', CI type=',par6,')',sep='')
}
plot(x,type='l', main=mytitle,xlab='time',ylab='value')
par(op)
dev.off()
bitmap(file='pic1.png')
racf <- acf(x, par1, main='Autocorrelation', xlab='time lag', ylab='ACF', ci.type=par6, ci=par7, sub=mysub)
dev.off()
bitmap(file='pic2.png')
rpacf <- pacf(x,par1,main='Partial Autocorrelation',xlab='lags',ylab='PACF',sub=mysub)
dev.off()
(myacf <- c(racf$acf))
(mypacf <- c(rpacf$acf))
lengthx <- length(x)
sqrtn <- sqrt(lengthx)
load(file='createtable')
a<-table.start()
a<-table.row.start(a)
a<-table.element(a,'Autocorrelation Function',4,TRUE)
a<-table.row.end(a)
a<-table.row.start(a)
a<-table.element(a,'Time lag k',header=TRUE)
a<-table.element(a,'ACF(k)',header=TRUE)
a<-table.element(a,'T-STAT',header=TRUE)
a<-table.element(a,'P-value',header=TRUE)
a<-table.row.end(a)
for (i in 2:(par1+1)) {
a<-table.row.start(a)
a<-table.element(a,i-1,header=TRUE)
a<-table.element(a,round(myacf[i],6))
mytstat <- myacf[i]*sqrtn
a<-table.element(a,round(mytstat,4))
a<-table.element(a,round(1-pt(abs(mytstat),lengthx),6))
a<-table.row.end(a)
}
a<-table.end(a)
table.save(a,file='mytable.tab')
a<-table.start()
a<-table.row.start(a)
a<-table.element(a,'Partial Autocorrelation Function',4,TRUE)
a<-table.row.end(a)
a<-table.row.start(a)
a<-table.element(a,'Time lag k',header=TRUE)
a<-table.element(a,'PACF(k)',header=TRUE)
a<-table.element(a,'T-STAT',header=TRUE)
a<-table.element(a,'P-value',header=TRUE)
a<-table.row.end(a)
for (i in 1:par1) {
a<-table.row.start(a)
a<-table.element(a,i,header=TRUE)
a<-table.element(a,round(mypacf[i],6))
mytstat <- mypacf[i]*sqrtn
a<-table.element(a,round(mytstat,4))
a<-table.element(a,round(1-pt(abs(mytstat),lengthx),6))
a<-table.row.end(a)
}
a<-table.end(a)
table.save(a,file='mytable1.tab')