Free Statistics

of Irreproducible Research!

Author's title

Author*The author of this computation has been verified*
R Software Modulerwasp_arimabackwardselection.wasp
Title produced by softwareARIMA Backward Selection
Date of computationTue, 20 Dec 2016 15:24:52 +0100
Cite this page as followsStatistical Computations at FreeStatistics.org, Office for Research Development and Education, URL https://freestatistics.org/blog/index.php?v=date/2016/Dec/20/t1482243923p38xdftiqqljm01.htm/, Retrieved Sun, 28 Apr 2024 13:15:22 +0000
Statistical Computations at FreeStatistics.org, Office for Research Development and Education, URL https://freestatistics.org/blog/index.php?pk=301685, Retrieved Sun, 28 Apr 2024 13:15:22 +0000
QR Codes:

Original text written by user:
IsPrivate?No (this computation is public)
User-defined keywords
Estimated Impact73
Family? (F = Feedback message, R = changed R code, M = changed R Module, P = changed Parameters, D = changed Data)
-       [ARIMA Backward Selection] [] [2016-12-20 14:24:52] [361c8dad91b3f1ef2e651cd04783c23b] [Current]
Feedback Forum

Post a new message
Dataseries X:
2755
2765
3000
2890
2940
3290
2815
3035
3070
3040
2685
2540
3090
2995
3440
3335
3205
3285
2790
3225
3360
3275
3505
3185
3470
3510
3840
3605
3655
3555
3140
3380
3255
3460
3245
3120
3265
3220
3140
3050
3300
2950
2630
2795
2840
2945
2790
2605
4590
4230
4245
4300
4475
3910
4100
3500
4390
3550
3865
3715
3310
3945
5050
4350
4060
4345
4360
4915
4650
4805
4775
4220
3975
3820
5515
4895
5535
4230
3695
5590
5000
4875
4360
4405
4500
4070
4800
4080
4850
4105
3805
5060
4060
4600
4635
3900
4120
3960
4400
3700
3970
4550
5140
5000
3650
4300
3650
3355
4000
3450
3295
3390
3415
3440
3680
3900
3965
4295
4210
4100
4690
3860
4250
4495
3800
3845


Summary of computational transaction
Raw Input view raw input (R code)
Raw Outputview raw output of R engine
Computing time7 seconds
R ServerBig Analytics Cloud Computing Center

\begin{tabular}{lllllllll}
\hline
Summary of computational transaction \tabularnewline
Raw Input view raw input (R code)  \tabularnewline
Raw Outputview raw output of R engine  \tabularnewline
Computing time7 seconds \tabularnewline
R ServerBig Analytics Cloud Computing Center \tabularnewline
\hline
\end{tabular}
%Source: https://freestatistics.org/blog/index.php?pk=301685&T=0

[TABLE]
[ROW]
Summary of computational transaction[/C][/ROW] [ROW]Raw Input[/C] view raw input (R code) [/C][/ROW] [ROW]Raw Output[/C]view raw output of R engine [/C][/ROW] [ROW]Computing time[/C]7 seconds[/C][/ROW] [ROW]R Server[/C]Big Analytics Cloud Computing Center[/C][/ROW] [/TABLE] Source: https://freestatistics.org/blog/index.php?pk=301685&T=0

Globally Unique Identifier (entire table): ba.freestatistics.org/blog/index.php?pk=301685&T=0

As an alternative you can also use a QR Code:  

The GUIDs for individual cells are displayed in the table below:

Summary of computational transaction
Raw Input view raw input (R code)
Raw Outputview raw output of R engine
Computing time7 seconds
R ServerBig Analytics Cloud Computing Center


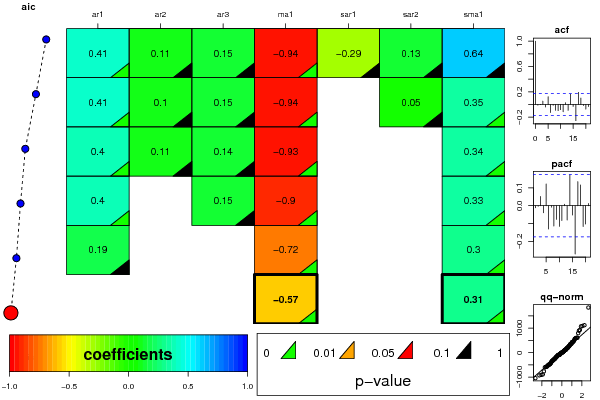
ARIMA Parameter Estimation and Backward Selection
Iterationar1ar2ar3ma1sar1sar2sma1
Estimates ( 1 )0.41130.11110.1489-0.9417-0.29040.13320.6387
(p-val)(3e-04 )(0.3131 )(0.1361 )(0 )(0.5212 )(0.4843 )(0.1505 )
Estimates ( 2 )0.40660.09720.1505-0.937400.04660.3492
(p-val)(4e-04 )(0.36 )(0.1364 )(0 )(NA )(0.6456 )(5e-04 )
Estimates ( 3 )0.39690.11140.141-0.9341000.3378
(p-val)(5e-04 )(0.2736 )(0.153 )(0 )(NA )(NA )(4e-04 )
Estimates ( 4 )0.39600.1537-0.9028000.3302
(p-val)(0.0056 )(NA )(0.1625 )(0 )(NA )(NA )(5e-04 )
Estimates ( 5 )0.194800-0.7216000.2971
(p-val)(0.3325 )(NA )(NA )(0 )(NA )(NA )(0.0012 )
Estimates ( 6 )000-0.5731000.3052
(p-val)(NA )(NA )(NA )(0 )(NA )(NA )(0.0012 )
Estimates ( 7 )NANANANANANANA
(p-val)(NA )(NA )(NA )(NA )(NA )(NA )(NA )
Estimates ( 8 )NANANANANANANA
(p-val)(NA )(NA )(NA )(NA )(NA )(NA )(NA )
Estimates ( 9 )NANANANANANANA
(p-val)(NA )(NA )(NA )(NA )(NA )(NA )(NA )
Estimates ( 10 )NANANANANANANA
(p-val)(NA )(NA )(NA )(NA )(NA )(NA )(NA )
Estimates ( 11 )NANANANANANANA
(p-val)(NA )(NA )(NA )(NA )(NA )(NA )(NA )
Estimates ( 12 )NANANANANANANA
(p-val)(NA )(NA )(NA )(NA )(NA )(NA )(NA )
Estimates ( 13 )NANANANANANANA
(p-val)(NA )(NA )(NA )(NA )(NA )(NA )(NA )

\begin{tabular}{lllllllll}
\hline
ARIMA Parameter Estimation and Backward Selection \tabularnewline
Iteration & ar1 & ar2 & ar3 & ma1 & sar1 & sar2 & sma1 \tabularnewline
Estimates ( 1 ) & 0.4113 & 0.1111 & 0.1489 & -0.9417 & -0.2904 & 0.1332 & 0.6387 \tabularnewline
(p-val) & (3e-04 ) & (0.3131 ) & (0.1361 ) & (0 ) & (0.5212 ) & (0.4843 ) & (0.1505 ) \tabularnewline
Estimates ( 2 ) & 0.4066 & 0.0972 & 0.1505 & -0.9374 & 0 & 0.0466 & 0.3492 \tabularnewline
(p-val) & (4e-04 ) & (0.36 ) & (0.1364 ) & (0 ) & (NA ) & (0.6456 ) & (5e-04 ) \tabularnewline
Estimates ( 3 ) & 0.3969 & 0.1114 & 0.141 & -0.9341 & 0 & 0 & 0.3378 \tabularnewline
(p-val) & (5e-04 ) & (0.2736 ) & (0.153 ) & (0 ) & (NA ) & (NA ) & (4e-04 ) \tabularnewline
Estimates ( 4 ) & 0.396 & 0 & 0.1537 & -0.9028 & 0 & 0 & 0.3302 \tabularnewline
(p-val) & (0.0056 ) & (NA ) & (0.1625 ) & (0 ) & (NA ) & (NA ) & (5e-04 ) \tabularnewline
Estimates ( 5 ) & 0.1948 & 0 & 0 & -0.7216 & 0 & 0 & 0.2971 \tabularnewline
(p-val) & (0.3325 ) & (NA ) & (NA ) & (0 ) & (NA ) & (NA ) & (0.0012 ) \tabularnewline
Estimates ( 6 ) & 0 & 0 & 0 & -0.5731 & 0 & 0 & 0.3052 \tabularnewline
(p-val) & (NA ) & (NA ) & (NA ) & (0 ) & (NA ) & (NA ) & (0.0012 ) \tabularnewline
Estimates ( 7 ) & NA & NA & NA & NA & NA & NA & NA \tabularnewline
(p-val) & (NA ) & (NA ) & (NA ) & (NA ) & (NA ) & (NA ) & (NA ) \tabularnewline
Estimates ( 8 ) & NA & NA & NA & NA & NA & NA & NA \tabularnewline
(p-val) & (NA ) & (NA ) & (NA ) & (NA ) & (NA ) & (NA ) & (NA ) \tabularnewline
Estimates ( 9 ) & NA & NA & NA & NA & NA & NA & NA \tabularnewline
(p-val) & (NA ) & (NA ) & (NA ) & (NA ) & (NA ) & (NA ) & (NA ) \tabularnewline
Estimates ( 10 ) & NA & NA & NA & NA & NA & NA & NA \tabularnewline
(p-val) & (NA ) & (NA ) & (NA ) & (NA ) & (NA ) & (NA ) & (NA ) \tabularnewline
Estimates ( 11 ) & NA & NA & NA & NA & NA & NA & NA \tabularnewline
(p-val) & (NA ) & (NA ) & (NA ) & (NA ) & (NA ) & (NA ) & (NA ) \tabularnewline
Estimates ( 12 ) & NA & NA & NA & NA & NA & NA & NA \tabularnewline
(p-val) & (NA ) & (NA ) & (NA ) & (NA ) & (NA ) & (NA ) & (NA ) \tabularnewline
Estimates ( 13 ) & NA & NA & NA & NA & NA & NA & NA \tabularnewline
(p-val) & (NA ) & (NA ) & (NA ) & (NA ) & (NA ) & (NA ) & (NA ) \tabularnewline
\hline
\end{tabular}
%Source: https://freestatistics.org/blog/index.php?pk=301685&T=1

[TABLE]
[ROW][C]ARIMA Parameter Estimation and Backward Selection[/C][/ROW]
[ROW][C]Iteration[/C][C]ar1[/C][C]ar2[/C][C]ar3[/C][C]ma1[/C][C]sar1[/C][C]sar2[/C][C]sma1[/C][/ROW]
[ROW][C]Estimates ( 1 )[/C][C]0.4113[/C][C]0.1111[/C][C]0.1489[/C][C]-0.9417[/C][C]-0.2904[/C][C]0.1332[/C][C]0.6387[/C][/ROW]
[ROW][C](p-val)[/C][C](3e-04 )[/C][C](0.3131 )[/C][C](0.1361 )[/C][C](0 )[/C][C](0.5212 )[/C][C](0.4843 )[/C][C](0.1505 )[/C][/ROW]
[ROW][C]Estimates ( 2 )[/C][C]0.4066[/C][C]0.0972[/C][C]0.1505[/C][C]-0.9374[/C][C]0[/C][C]0.0466[/C][C]0.3492[/C][/ROW]
[ROW][C](p-val)[/C][C](4e-04 )[/C][C](0.36 )[/C][C](0.1364 )[/C][C](0 )[/C][C](NA )[/C][C](0.6456 )[/C][C](5e-04 )[/C][/ROW]
[ROW][C]Estimates ( 3 )[/C][C]0.3969[/C][C]0.1114[/C][C]0.141[/C][C]-0.9341[/C][C]0[/C][C]0[/C][C]0.3378[/C][/ROW]
[ROW][C](p-val)[/C][C](5e-04 )[/C][C](0.2736 )[/C][C](0.153 )[/C][C](0 )[/C][C](NA )[/C][C](NA )[/C][C](4e-04 )[/C][/ROW]
[ROW][C]Estimates ( 4 )[/C][C]0.396[/C][C]0[/C][C]0.1537[/C][C]-0.9028[/C][C]0[/C][C]0[/C][C]0.3302[/C][/ROW]
[ROW][C](p-val)[/C][C](0.0056 )[/C][C](NA )[/C][C](0.1625 )[/C][C](0 )[/C][C](NA )[/C][C](NA )[/C][C](5e-04 )[/C][/ROW]
[ROW][C]Estimates ( 5 )[/C][C]0.1948[/C][C]0[/C][C]0[/C][C]-0.7216[/C][C]0[/C][C]0[/C][C]0.2971[/C][/ROW]
[ROW][C](p-val)[/C][C](0.3325 )[/C][C](NA )[/C][C](NA )[/C][C](0 )[/C][C](NA )[/C][C](NA )[/C][C](0.0012 )[/C][/ROW]
[ROW][C]Estimates ( 6 )[/C][C]0[/C][C]0[/C][C]0[/C][C]-0.5731[/C][C]0[/C][C]0[/C][C]0.3052[/C][/ROW]
[ROW][C](p-val)[/C][C](NA )[/C][C](NA )[/C][C](NA )[/C][C](0 )[/C][C](NA )[/C][C](NA )[/C][C](0.0012 )[/C][/ROW]
[ROW][C]Estimates ( 7 )[/C][C]NA[/C][C]NA[/C][C]NA[/C][C]NA[/C][C]NA[/C][C]NA[/C][C]NA[/C][/ROW]
[ROW][C](p-val)[/C][C](NA )[/C][C](NA )[/C][C](NA )[/C][C](NA )[/C][C](NA )[/C][C](NA )[/C][C](NA )[/C][/ROW]
[ROW][C]Estimates ( 8 )[/C][C]NA[/C][C]NA[/C][C]NA[/C][C]NA[/C][C]NA[/C][C]NA[/C][C]NA[/C][/ROW]
[ROW][C](p-val)[/C][C](NA )[/C][C](NA )[/C][C](NA )[/C][C](NA )[/C][C](NA )[/C][C](NA )[/C][C](NA )[/C][/ROW]
[ROW][C]Estimates ( 9 )[/C][C]NA[/C][C]NA[/C][C]NA[/C][C]NA[/C][C]NA[/C][C]NA[/C][C]NA[/C][/ROW]
[ROW][C](p-val)[/C][C](NA )[/C][C](NA )[/C][C](NA )[/C][C](NA )[/C][C](NA )[/C][C](NA )[/C][C](NA )[/C][/ROW]
[ROW][C]Estimates ( 10 )[/C][C]NA[/C][C]NA[/C][C]NA[/C][C]NA[/C][C]NA[/C][C]NA[/C][C]NA[/C][/ROW]
[ROW][C](p-val)[/C][C](NA )[/C][C](NA )[/C][C](NA )[/C][C](NA )[/C][C](NA )[/C][C](NA )[/C][C](NA )[/C][/ROW]
[ROW][C]Estimates ( 11 )[/C][C]NA[/C][C]NA[/C][C]NA[/C][C]NA[/C][C]NA[/C][C]NA[/C][C]NA[/C][/ROW]
[ROW][C](p-val)[/C][C](NA )[/C][C](NA )[/C][C](NA )[/C][C](NA )[/C][C](NA )[/C][C](NA )[/C][C](NA )[/C][/ROW]
[ROW][C]Estimates ( 12 )[/C][C]NA[/C][C]NA[/C][C]NA[/C][C]NA[/C][C]NA[/C][C]NA[/C][C]NA[/C][/ROW]
[ROW][C](p-val)[/C][C](NA )[/C][C](NA )[/C][C](NA )[/C][C](NA )[/C][C](NA )[/C][C](NA )[/C][C](NA )[/C][/ROW]
[ROW][C]Estimates ( 13 )[/C][C]NA[/C][C]NA[/C][C]NA[/C][C]NA[/C][C]NA[/C][C]NA[/C][C]NA[/C][/ROW]
[ROW][C](p-val)[/C][C](NA )[/C][C](NA )[/C][C](NA )[/C][C](NA )[/C][C](NA )[/C][C](NA )[/C][C](NA )[/C][/ROW]
[/TABLE]
Source: https://freestatistics.org/blog/index.php?pk=301685&T=1

Globally Unique Identifier (entire table): ba.freestatistics.org/blog/index.php?pk=301685&T=1

As an alternative you can also use a QR Code:  

The GUIDs for individual cells are displayed in the table below:

ARIMA Parameter Estimation and Backward Selection
Iterationar1ar2ar3ma1sar1sar2sma1
Estimates ( 1 )0.41130.11110.1489-0.9417-0.29040.13320.6387
(p-val)(3e-04 )(0.3131 )(0.1361 )(0 )(0.5212 )(0.4843 )(0.1505 )
Estimates ( 2 )0.40660.09720.1505-0.937400.04660.3492
(p-val)(4e-04 )(0.36 )(0.1364 )(0 )(NA )(0.6456 )(5e-04 )
Estimates ( 3 )0.39690.11140.141-0.9341000.3378
(p-val)(5e-04 )(0.2736 )(0.153 )(0 )(NA )(NA )(4e-04 )
Estimates ( 4 )0.39600.1537-0.9028000.3302
(p-val)(0.0056 )(NA )(0.1625 )(0 )(NA )(NA )(5e-04 )
Estimates ( 5 )0.194800-0.7216000.2971
(p-val)(0.3325 )(NA )(NA )(0 )(NA )(NA )(0.0012 )
Estimates ( 6 )000-0.5731000.3052
(p-val)(NA )(NA )(NA )(0 )(NA )(NA )(0.0012 )
Estimates ( 7 )NANANANANANANA
(p-val)(NA )(NA )(NA )(NA )(NA )(NA )(NA )
Estimates ( 8 )NANANANANANANA
(p-val)(NA )(NA )(NA )(NA )(NA )(NA )(NA )
Estimates ( 9 )NANANANANANANA
(p-val)(NA )(NA )(NA )(NA )(NA )(NA )(NA )
Estimates ( 10 )NANANANANANANA
(p-val)(NA )(NA )(NA )(NA )(NA )(NA )(NA )
Estimates ( 11 )NANANANANANANA
(p-val)(NA )(NA )(NA )(NA )(NA )(NA )(NA )
Estimates ( 12 )NANANANANANANA
(p-val)(NA )(NA )(NA )(NA )(NA )(NA )(NA )
Estimates ( 13 )NANANANANANANA
(p-val)(NA )(NA )(NA )(NA )(NA )(NA )(NA )


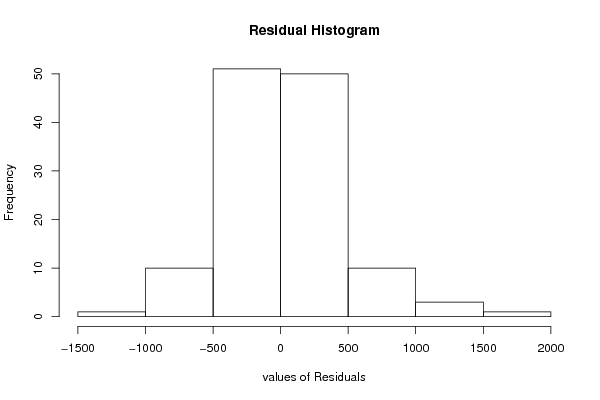
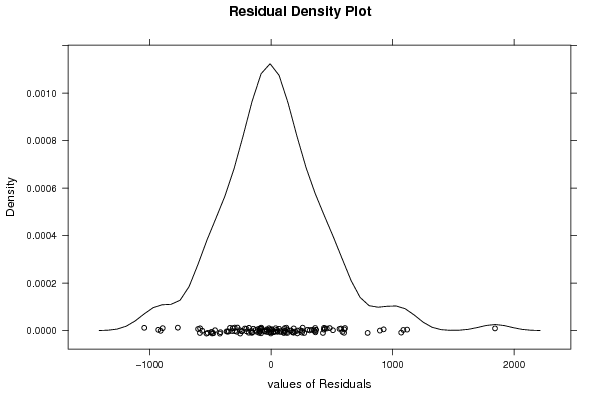
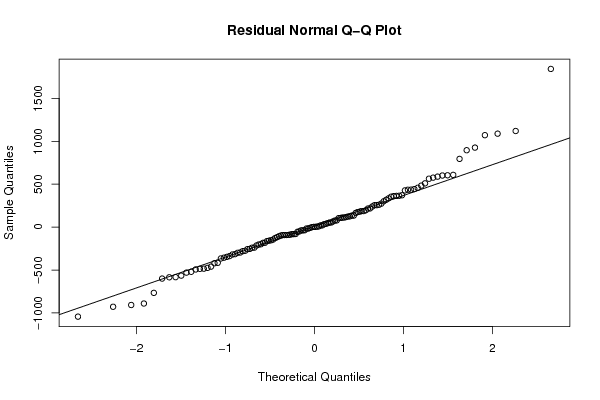
Estimated ARIMA Residuals
Value
2.75499806851381
8.44619454513426
216.498440495407
-1.45037312076815
66.5649647698631
371.047859751869
-253.866376233118
116.843525500945
76.5855493215512
20.0784826774029
-319.316411331818
-299.214800515496
363.278858649481
54.188454504811
435.982710199468
164.737300611554
-9.89801182055034
5.2414299709112
-357.126084812531
186.855620983987
187.006685942628
34.0005058340725
364.993185559569
-80.5811168454365
125.287452085809
133.944426154094
300.68807930688
-38.2892080051777
106.18132583279
-36.7578428770165
-315.06135587567
-38.1550432768742
-214.685265572487
104.244986082006
-280.410237765072
-183.607595442762
-17.391974052225
-98.8072618257013
-203.165594580394
-145.199260622447
123.007494111249
-276.259631680716
-365.435316934917
-92.5440085092231
1.66982018616554
20.4556089286683
-55.055110337505
-200.091123259709
1842.41743342805
608.341952174967
563.279147829154
458.107562719165
427.160082765846
-182.407286066086
217.806306506773
-530.704118243572
603.612291135654
-583.55998752463
78.3136124534362
-107.210456648126
-1043.47823143605
175.218561110212
1070.77964158863
-157.98621456607
-296.328088730873
273.464002721475
52.9704880672403
794.693098959475
-92.8444556120923
442.453139567851
110.673411730139
-420.648690411984
-153.327482756349
-493.700835094228
1088.35213411207
111.6291423905
895.515444811273
-928.301401298856
-907.699347042637
1119.48118772821
46.5749456910103
-127.826352776953
-520.90285377851
-81.8131936055157
-17.4316873796841
-347.261689134971
133.95040942225
-565.382352638763
260.147283230795
-239.454048322166
-256.961336589274
600.766949987164
-584.817985697456
360.802851686778
317.516089775863
-600.084647640659
-82.171266195915
-162.704497938411
239.510395593335
-416.178789858597
-92.4509544892904
587.618126378889
926.024280043146
179.638972051277
-890.519017696435
37.8370009608648
-766.319940313468
-474.931044228689
255.529254172396
-460.549415595251
-486.220887083148
-50.6278029370496
-91.8009245790161
-240.539752918811
-87.6071159495529
255.197717693276
509.409263996569
482.733003918292
434.85321937999
197.153164621272
575.932270136709
-337.732677690778
353.734745143975
335.057670343144
-484.540733955589
-117.437726569997

\begin{tabular}{lllllllll}
\hline
Estimated ARIMA Residuals \tabularnewline
Value \tabularnewline
2.75499806851381 \tabularnewline
8.44619454513426 \tabularnewline
216.498440495407 \tabularnewline
-1.45037312076815 \tabularnewline
66.5649647698631 \tabularnewline
371.047859751869 \tabularnewline
-253.866376233118 \tabularnewline
116.843525500945 \tabularnewline
76.5855493215512 \tabularnewline
20.0784826774029 \tabularnewline
-319.316411331818 \tabularnewline
-299.214800515496 \tabularnewline
363.278858649481 \tabularnewline
54.188454504811 \tabularnewline
435.982710199468 \tabularnewline
164.737300611554 \tabularnewline
-9.89801182055034 \tabularnewline
5.2414299709112 \tabularnewline
-357.126084812531 \tabularnewline
186.855620983987 \tabularnewline
187.006685942628 \tabularnewline
34.0005058340725 \tabularnewline
364.993185559569 \tabularnewline
-80.5811168454365 \tabularnewline
125.287452085809 \tabularnewline
133.944426154094 \tabularnewline
300.68807930688 \tabularnewline
-38.2892080051777 \tabularnewline
106.18132583279 \tabularnewline
-36.7578428770165 \tabularnewline
-315.06135587567 \tabularnewline
-38.1550432768742 \tabularnewline
-214.685265572487 \tabularnewline
104.244986082006 \tabularnewline
-280.410237765072 \tabularnewline
-183.607595442762 \tabularnewline
-17.391974052225 \tabularnewline
-98.8072618257013 \tabularnewline
-203.165594580394 \tabularnewline
-145.199260622447 \tabularnewline
123.007494111249 \tabularnewline
-276.259631680716 \tabularnewline
-365.435316934917 \tabularnewline
-92.5440085092231 \tabularnewline
1.66982018616554 \tabularnewline
20.4556089286683 \tabularnewline
-55.055110337505 \tabularnewline
-200.091123259709 \tabularnewline
1842.41743342805 \tabularnewline
608.341952174967 \tabularnewline
563.279147829154 \tabularnewline
458.107562719165 \tabularnewline
427.160082765846 \tabularnewline
-182.407286066086 \tabularnewline
217.806306506773 \tabularnewline
-530.704118243572 \tabularnewline
603.612291135654 \tabularnewline
-583.55998752463 \tabularnewline
78.3136124534362 \tabularnewline
-107.210456648126 \tabularnewline
-1043.47823143605 \tabularnewline
175.218561110212 \tabularnewline
1070.77964158863 \tabularnewline
-157.98621456607 \tabularnewline
-296.328088730873 \tabularnewline
273.464002721475 \tabularnewline
52.9704880672403 \tabularnewline
794.693098959475 \tabularnewline
-92.8444556120923 \tabularnewline
442.453139567851 \tabularnewline
110.673411730139 \tabularnewline
-420.648690411984 \tabularnewline
-153.327482756349 \tabularnewline
-493.700835094228 \tabularnewline
1088.35213411207 \tabularnewline
111.6291423905 \tabularnewline
895.515444811273 \tabularnewline
-928.301401298856 \tabularnewline
-907.699347042637 \tabularnewline
1119.48118772821 \tabularnewline
46.5749456910103 \tabularnewline
-127.826352776953 \tabularnewline
-520.90285377851 \tabularnewline
-81.8131936055157 \tabularnewline
-17.4316873796841 \tabularnewline
-347.261689134971 \tabularnewline
133.95040942225 \tabularnewline
-565.382352638763 \tabularnewline
260.147283230795 \tabularnewline
-239.454048322166 \tabularnewline
-256.961336589274 \tabularnewline
600.766949987164 \tabularnewline
-584.817985697456 \tabularnewline
360.802851686778 \tabularnewline
317.516089775863 \tabularnewline
-600.084647640659 \tabularnewline
-82.171266195915 \tabularnewline
-162.704497938411 \tabularnewline
239.510395593335 \tabularnewline
-416.178789858597 \tabularnewline
-92.4509544892904 \tabularnewline
587.618126378889 \tabularnewline
926.024280043146 \tabularnewline
179.638972051277 \tabularnewline
-890.519017696435 \tabularnewline
37.8370009608648 \tabularnewline
-766.319940313468 \tabularnewline
-474.931044228689 \tabularnewline
255.529254172396 \tabularnewline
-460.549415595251 \tabularnewline
-486.220887083148 \tabularnewline
-50.6278029370496 \tabularnewline
-91.8009245790161 \tabularnewline
-240.539752918811 \tabularnewline
-87.6071159495529 \tabularnewline
255.197717693276 \tabularnewline
509.409263996569 \tabularnewline
482.733003918292 \tabularnewline
434.85321937999 \tabularnewline
197.153164621272 \tabularnewline
575.932270136709 \tabularnewline
-337.732677690778 \tabularnewline
353.734745143975 \tabularnewline
335.057670343144 \tabularnewline
-484.540733955589 \tabularnewline
-117.437726569997 \tabularnewline
\hline
\end{tabular}
%Source: https://freestatistics.org/blog/index.php?pk=301685&T=2

[TABLE]
[ROW][C]Estimated ARIMA Residuals[/C][/ROW]
[ROW][C]Value[/C][/ROW]
[ROW][C]2.75499806851381[/C][/ROW]
[ROW][C]8.44619454513426[/C][/ROW]
[ROW][C]216.498440495407[/C][/ROW]
[ROW][C]-1.45037312076815[/C][/ROW]
[ROW][C]66.5649647698631[/C][/ROW]
[ROW][C]371.047859751869[/C][/ROW]
[ROW][C]-253.866376233118[/C][/ROW]
[ROW][C]116.843525500945[/C][/ROW]
[ROW][C]76.5855493215512[/C][/ROW]
[ROW][C]20.0784826774029[/C][/ROW]
[ROW][C]-319.316411331818[/C][/ROW]
[ROW][C]-299.214800515496[/C][/ROW]
[ROW][C]363.278858649481[/C][/ROW]
[ROW][C]54.188454504811[/C][/ROW]
[ROW][C]435.982710199468[/C][/ROW]
[ROW][C]164.737300611554[/C][/ROW]
[ROW][C]-9.89801182055034[/C][/ROW]
[ROW][C]5.2414299709112[/C][/ROW]
[ROW][C]-357.126084812531[/C][/ROW]
[ROW][C]186.855620983987[/C][/ROW]
[ROW][C]187.006685942628[/C][/ROW]
[ROW][C]34.0005058340725[/C][/ROW]
[ROW][C]364.993185559569[/C][/ROW]
[ROW][C]-80.5811168454365[/C][/ROW]
[ROW][C]125.287452085809[/C][/ROW]
[ROW][C]133.944426154094[/C][/ROW]
[ROW][C]300.68807930688[/C][/ROW]
[ROW][C]-38.2892080051777[/C][/ROW]
[ROW][C]106.18132583279[/C][/ROW]
[ROW][C]-36.7578428770165[/C][/ROW]
[ROW][C]-315.06135587567[/C][/ROW]
[ROW][C]-38.1550432768742[/C][/ROW]
[ROW][C]-214.685265572487[/C][/ROW]
[ROW][C]104.244986082006[/C][/ROW]
[ROW][C]-280.410237765072[/C][/ROW]
[ROW][C]-183.607595442762[/C][/ROW]
[ROW][C]-17.391974052225[/C][/ROW]
[ROW][C]-98.8072618257013[/C][/ROW]
[ROW][C]-203.165594580394[/C][/ROW]
[ROW][C]-145.199260622447[/C][/ROW]
[ROW][C]123.007494111249[/C][/ROW]
[ROW][C]-276.259631680716[/C][/ROW]
[ROW][C]-365.435316934917[/C][/ROW]
[ROW][C]-92.5440085092231[/C][/ROW]
[ROW][C]1.66982018616554[/C][/ROW]
[ROW][C]20.4556089286683[/C][/ROW]
[ROW][C]-55.055110337505[/C][/ROW]
[ROW][C]-200.091123259709[/C][/ROW]
[ROW][C]1842.41743342805[/C][/ROW]
[ROW][C]608.341952174967[/C][/ROW]
[ROW][C]563.279147829154[/C][/ROW]
[ROW][C]458.107562719165[/C][/ROW]
[ROW][C]427.160082765846[/C][/ROW]
[ROW][C]-182.407286066086[/C][/ROW]
[ROW][C]217.806306506773[/C][/ROW]
[ROW][C]-530.704118243572[/C][/ROW]
[ROW][C]603.612291135654[/C][/ROW]
[ROW][C]-583.55998752463[/C][/ROW]
[ROW][C]78.3136124534362[/C][/ROW]
[ROW][C]-107.210456648126[/C][/ROW]
[ROW][C]-1043.47823143605[/C][/ROW]
[ROW][C]175.218561110212[/C][/ROW]
[ROW][C]1070.77964158863[/C][/ROW]
[ROW][C]-157.98621456607[/C][/ROW]
[ROW][C]-296.328088730873[/C][/ROW]
[ROW][C]273.464002721475[/C][/ROW]
[ROW][C]52.9704880672403[/C][/ROW]
[ROW][C]794.693098959475[/C][/ROW]
[ROW][C]-92.8444556120923[/C][/ROW]
[ROW][C]442.453139567851[/C][/ROW]
[ROW][C]110.673411730139[/C][/ROW]
[ROW][C]-420.648690411984[/C][/ROW]
[ROW][C]-153.327482756349[/C][/ROW]
[ROW][C]-493.700835094228[/C][/ROW]
[ROW][C]1088.35213411207[/C][/ROW]
[ROW][C]111.6291423905[/C][/ROW]
[ROW][C]895.515444811273[/C][/ROW]
[ROW][C]-928.301401298856[/C][/ROW]
[ROW][C]-907.699347042637[/C][/ROW]
[ROW][C]1119.48118772821[/C][/ROW]
[ROW][C]46.5749456910103[/C][/ROW]
[ROW][C]-127.826352776953[/C][/ROW]
[ROW][C]-520.90285377851[/C][/ROW]
[ROW][C]-81.8131936055157[/C][/ROW]
[ROW][C]-17.4316873796841[/C][/ROW]
[ROW][C]-347.261689134971[/C][/ROW]
[ROW][C]133.95040942225[/C][/ROW]
[ROW][C]-565.382352638763[/C][/ROW]
[ROW][C]260.147283230795[/C][/ROW]
[ROW][C]-239.454048322166[/C][/ROW]
[ROW][C]-256.961336589274[/C][/ROW]
[ROW][C]600.766949987164[/C][/ROW]
[ROW][C]-584.817985697456[/C][/ROW]
[ROW][C]360.802851686778[/C][/ROW]
[ROW][C]317.516089775863[/C][/ROW]
[ROW][C]-600.084647640659[/C][/ROW]
[ROW][C]-82.171266195915[/C][/ROW]
[ROW][C]-162.704497938411[/C][/ROW]
[ROW][C]239.510395593335[/C][/ROW]
[ROW][C]-416.178789858597[/C][/ROW]
[ROW][C]-92.4509544892904[/C][/ROW]
[ROW][C]587.618126378889[/C][/ROW]
[ROW][C]926.024280043146[/C][/ROW]
[ROW][C]179.638972051277[/C][/ROW]
[ROW][C]-890.519017696435[/C][/ROW]
[ROW][C]37.8370009608648[/C][/ROW]
[ROW][C]-766.319940313468[/C][/ROW]
[ROW][C]-474.931044228689[/C][/ROW]
[ROW][C]255.529254172396[/C][/ROW]
[ROW][C]-460.549415595251[/C][/ROW]
[ROW][C]-486.220887083148[/C][/ROW]
[ROW][C]-50.6278029370496[/C][/ROW]
[ROW][C]-91.8009245790161[/C][/ROW]
[ROW][C]-240.539752918811[/C][/ROW]
[ROW][C]-87.6071159495529[/C][/ROW]
[ROW][C]255.197717693276[/C][/ROW]
[ROW][C]509.409263996569[/C][/ROW]
[ROW][C]482.733003918292[/C][/ROW]
[ROW][C]434.85321937999[/C][/ROW]
[ROW][C]197.153164621272[/C][/ROW]
[ROW][C]575.932270136709[/C][/ROW]
[ROW][C]-337.732677690778[/C][/ROW]
[ROW][C]353.734745143975[/C][/ROW]
[ROW][C]335.057670343144[/C][/ROW]
[ROW][C]-484.540733955589[/C][/ROW]
[ROW][C]-117.437726569997[/C][/ROW]
[/TABLE]
Source: https://freestatistics.org/blog/index.php?pk=301685&T=2

Globally Unique Identifier (entire table): ba.freestatistics.org/blog/index.php?pk=301685&T=2

As an alternative you can also use a QR Code:  

The GUIDs for individual cells are displayed in the table below:

Estimated ARIMA Residuals
Value
2.75499806851381
8.44619454513426
216.498440495407
-1.45037312076815
66.5649647698631
371.047859751869
-253.866376233118
116.843525500945
76.5855493215512
20.0784826774029
-319.316411331818
-299.214800515496
363.278858649481
54.188454504811
435.982710199468
164.737300611554
-9.89801182055034
5.2414299709112
-357.126084812531
186.855620983987
187.006685942628
34.0005058340725
364.993185559569
-80.5811168454365
125.287452085809
133.944426154094
300.68807930688
-38.2892080051777
106.18132583279
-36.7578428770165
-315.06135587567
-38.1550432768742
-214.685265572487
104.244986082006
-280.410237765072
-183.607595442762
-17.391974052225
-98.8072618257013
-203.165594580394
-145.199260622447
123.007494111249
-276.259631680716
-365.435316934917
-92.5440085092231
1.66982018616554
20.4556089286683
-55.055110337505
-200.091123259709
1842.41743342805
608.341952174967
563.279147829154
458.107562719165
427.160082765846
-182.407286066086
217.806306506773
-530.704118243572
603.612291135654
-583.55998752463
78.3136124534362
-107.210456648126
-1043.47823143605
175.218561110212
1070.77964158863
-157.98621456607
-296.328088730873
273.464002721475
52.9704880672403
794.693098959475
-92.8444556120923
442.453139567851
110.673411730139
-420.648690411984
-153.327482756349
-493.700835094228
1088.35213411207
111.6291423905
895.515444811273
-928.301401298856
-907.699347042637
1119.48118772821
46.5749456910103
-127.826352776953
-520.90285377851
-81.8131936055157
-17.4316873796841
-347.261689134971
133.95040942225
-565.382352638763
260.147283230795
-239.454048322166
-256.961336589274
600.766949987164
-584.817985697456
360.802851686778
317.516089775863
-600.084647640659
-82.171266195915
-162.704497938411
239.510395593335
-416.178789858597
-92.4509544892904
587.618126378889
926.024280043146
179.638972051277
-890.519017696435
37.8370009608648
-766.319940313468
-474.931044228689
255.529254172396
-460.549415595251
-486.220887083148
-50.6278029370496
-91.8009245790161
-240.539752918811
-87.6071159495529
255.197717693276
509.409263996569
482.733003918292
434.85321937999
197.153164621272
575.932270136709
-337.732677690778
353.734745143975
335.057670343144
-484.540733955589
-117.437726569997


Parameters (Session):
par1 = FALSE ; par2 = 1 ; par3 = 1 ; par4 = 0 ; par5 = 12 ; par6 = 3 ; par7 = 1 ; par8 = 2 ; par9 = 1 ;
Parameters (R input):
par1 = FALSE ; par2 = 1 ; par3 = 1 ; par4 = 0 ; par5 = 12 ; par6 = 3 ; par7 = 1 ; par8 = 2 ; par9 = 1 ;
R code (references can be found in the software module):
library(lattice)
if (par1 == 'TRUE') par1 <- TRUE
if (par1 == 'FALSE') par1 <- FALSE
par2 <- as.numeric(par2) #Box-Cox lambda transformation parameter
par3 <- as.numeric(par3) #degree of non-seasonal differencing
par4 <- as.numeric(par4) #degree of seasonal differencing
par5 <- as.numeric(par5) #seasonal period
par6 <- as.numeric(par6) #degree (p) of the non-seasonal AR(p) polynomial
par7 <- as.numeric(par7) #degree (q) of the non-seasonal MA(q) polynomial
par8 <- as.numeric(par8) #degree (P) of the seasonal AR(P) polynomial
par9 <- as.numeric(par9) #degree (Q) of the seasonal MA(Q) polynomial
armaGR <- function(arima.out, names, n){
try1 <- arima.out$coef
try2 <- sqrt(diag(arima.out$var.coef))
try.data.frame <- data.frame(matrix(NA,ncol=4,nrow=length(names)))
dimnames(try.data.frame) <- list(names,c('coef','std','tstat','pv'))
try.data.frame[,1] <- try1
for(i in 1:length(try2)) try.data.frame[which(rownames(try.data.frame)==names(try2)[i]),2] <- try2[i]
try.data.frame[,3] <- try.data.frame[,1] / try.data.frame[,2]
try.data.frame[,4] <- round((1-pt(abs(try.data.frame[,3]),df=n-(length(try2)+1)))*2,5)
vector <- rep(NA,length(names))
vector[is.na(try.data.frame[,4])] <- 0
maxi <- which.max(try.data.frame[,4])
continue <- max(try.data.frame[,4],na.rm=TRUE) > .05
vector[maxi] <- 0
list(summary=try.data.frame,next.vector=vector,continue=continue)
}
arimaSelect <- function(series, order=c(13,0,0), seasonal=list(order=c(2,0,0),period=12), include.mean=F){
nrc <- order[1]+order[3]+seasonal$order[1]+seasonal$order[3]
coeff <- matrix(NA, nrow=nrc*2, ncol=nrc)
pval <- matrix(NA, nrow=nrc*2, ncol=nrc)
mylist <- rep(list(NULL), nrc)
names <- NULL
if(order[1] > 0) names <- paste('ar',1:order[1],sep='')
if(order[3] > 0) names <- c( names , paste('ma',1:order[3],sep='') )
if(seasonal$order[1] > 0) names <- c(names, paste('sar',1:seasonal$order[1],sep=''))
if(seasonal$order[3] > 0) names <- c(names, paste('sma',1:seasonal$order[3],sep=''))
arima.out <- arima(series, order=order, seasonal=seasonal, include.mean=include.mean, method='ML')
mylist[[1]] <- arima.out
last.arma <- armaGR(arima.out, names, length(series))
mystop <- FALSE
i <- 1
coeff[i,] <- last.arma[[1]][,1]
pval [i,] <- last.arma[[1]][,4]
i <- 2
aic <- arima.out$aic
while(!mystop){
mylist[[i]] <- arima.out
arima.out <- arima(series, order=order, seasonal=seasonal, include.mean=include.mean, method='ML', fixed=last.arma$next.vector)
aic <- c(aic, arima.out$aic)
last.arma <- armaGR(arima.out, names, length(series))
mystop <- !last.arma$continue
coeff[i,] <- last.arma[[1]][,1]
pval [i,] <- last.arma[[1]][,4]
i <- i+1
}
list(coeff, pval, mylist, aic=aic)
}
arimaSelectplot <- function(arimaSelect.out,noms,choix){
noms <- names(arimaSelect.out[[3]][[1]]$coef)
coeff <- arimaSelect.out[[1]]
k <- min(which(is.na(coeff[,1])))-1
coeff <- coeff[1:k,]
pval <- arimaSelect.out[[2]][1:k,]
aic <- arimaSelect.out$aic[1:k]
coeff[coeff==0] <- NA
n <- ncol(coeff)
if(missing(choix)) choix <- k
layout(matrix(c(1,1,1,2,
3,3,3,2,
3,3,3,4,
5,6,7,7),nr=4),
widths=c(10,35,45,15),
heights=c(30,30,15,15))
couleurs <- rainbow(75)[1:50]#(50)
ticks <- pretty(coeff)
par(mar=c(1,1,3,1))
plot(aic,k:1-.5,type='o',pch=21,bg='blue',cex=2,axes=F,lty=2,xpd=NA)
points(aic[choix],k-choix+.5,pch=21,cex=4,bg=2,xpd=NA)
title('aic',line=2)
par(mar=c(3,0,0,0))
plot(0,axes=F,xlab='',ylab='',xlim=range(ticks),ylim=c(.1,1))
rect(xleft = min(ticks) + (0:49)/50*(max(ticks)-min(ticks)),
xright = min(ticks) + (1:50)/50*(max(ticks)-min(ticks)),
ytop = rep(1,50),
ybottom= rep(0,50),col=couleurs,border=NA)
axis(1,ticks)
rect(xleft=min(ticks),xright=max(ticks),ytop=1,ybottom=0)
text(mean(coeff,na.rm=T),.5,'coefficients',cex=2,font=2)
par(mar=c(1,1,3,1))
image(1:n,1:k,t(coeff[k:1,]),axes=F,col=couleurs,zlim=range(ticks))
for(i in 1:n) for(j in 1:k) if(!is.na(coeff[j,i])) {
if(pval[j,i]<.01) symb = 'green'
else if( (pval[j,i]<.05) & (pval[j,i]>=.01)) symb = 'orange'
else if( (pval[j,i]<.1) & (pval[j,i]>=.05)) symb = 'red'
else symb = 'black'
polygon(c(i+.5 ,i+.2 ,i+.5 ,i+.5),
c(k-j+0.5,k-j+0.5,k-j+0.8,k-j+0.5),
col=symb)
if(j==choix) {
rect(xleft=i-.5,
xright=i+.5,
ybottom=k-j+1.5,
ytop=k-j+.5,
lwd=4)
text(i,
k-j+1,
round(coeff[j,i],2),
cex=1.2,
font=2)
}
else{
rect(xleft=i-.5,xright=i+.5,ybottom=k-j+1.5,ytop=k-j+.5)
text(i,k-j+1,round(coeff[j,i],2),cex=1.2,font=1)
}
}
axis(3,1:n,noms)
par(mar=c(0.5,0,0,0.5))
plot(0,axes=F,xlab='',ylab='',type='n',xlim=c(0,8),ylim=c(-.2,.8))
cols <- c('green','orange','red','black')
niv <- c('0','0.01','0.05','0.1')
for(i in 0:3){
polygon(c(1+2*i ,1+2*i ,1+2*i-.5 ,1+2*i),
c(.4 ,.7 , .4 , .4),
col=cols[i+1])
text(2*i,0.5,niv[i+1],cex=1.5)
}
text(8,.5,1,cex=1.5)
text(4,0,'p-value',cex=2)
box()
residus <- arimaSelect.out[[3]][[choix]]$res
par(mar=c(1,2,4,1))
acf(residus,main='')
title('acf',line=.5)
par(mar=c(1,2,4,1))
pacf(residus,main='')
title('pacf',line=.5)
par(mar=c(2,2,4,1))
qqnorm(residus,main='')
title('qq-norm',line=.5)
qqline(residus)
residus
}
if (par2 == 0) x <- log(x)
if (par2 != 0) x <- x^par2
(selection <- arimaSelect(x, order=c(par6,par3,par7), seasonal=list(order=c(par8,par4,par9), period=par5)))
bitmap(file='test1.png')
resid <- arimaSelectplot(selection)
dev.off()
resid
bitmap(file='test2.png')
acf(resid,length(resid)/2, main='Residual Autocorrelation Function')
dev.off()
bitmap(file='test3.png')
pacf(resid,length(resid)/2, main='Residual Partial Autocorrelation Function')
dev.off()
bitmap(file='test4.png')
cpgram(resid, main='Residual Cumulative Periodogram')
dev.off()
bitmap(file='test5.png')
hist(resid, main='Residual Histogram', xlab='values of Residuals')
dev.off()
bitmap(file='test6.png')
densityplot(~resid,col='black',main='Residual Density Plot', xlab='values of Residuals')
dev.off()
bitmap(file='test7.png')
qqnorm(resid, main='Residual Normal Q-Q Plot')
qqline(resid)
dev.off()
ncols <- length(selection[[1]][1,])
nrows <- length(selection[[2]][,1])-1
load(file='createtable')
a<-table.start()
a<-table.row.start(a)
a<-table.element(a,'ARIMA Parameter Estimation and Backward Selection', ncols+1,TRUE)
a<-table.row.end(a)
a<-table.row.start(a)
a<-table.element(a,'Iteration', header=TRUE)
for (i in 1:ncols) {
a<-table.element(a,names(selection[[3]][[1]]$coef)[i],header=TRUE)
}
a<-table.row.end(a)
for (j in 1:nrows) {
a<-table.row.start(a)
mydum <- 'Estimates ('
mydum <- paste(mydum,j)
mydum <- paste(mydum,')')
a<-table.element(a,mydum, header=TRUE)
for (i in 1:ncols) {
a<-table.element(a,round(selection[[1]][j,i],4))
}
a<-table.row.end(a)
a<-table.row.start(a)
a<-table.element(a,'(p-val)', header=TRUE)
for (i in 1:ncols) {
mydum <- '('
mydum <- paste(mydum,round(selection[[2]][j,i],4),sep='')
mydum <- paste(mydum,')')
a<-table.element(a,mydum)
}
a<-table.row.end(a)
}
a<-table.end(a)
table.save(a,file='mytable.tab')
a<-table.start()
a<-table.row.start(a)
a<-table.element(a,'Estimated ARIMA Residuals', 1,TRUE)
a<-table.row.end(a)
a<-table.row.start(a)
a<-table.element(a,'Value', 1,TRUE)
a<-table.row.end(a)
for (i in (par4*par5+par3):length(resid)) {
a<-table.row.start(a)
a<-table.element(a,resid[i])
a<-table.row.end(a)
}
a<-table.end(a)
table.save(a,file='mytable1.tab')