Free Statistics

of Irreproducible Research!

Author's title

Author*The author of this computation has been verified*
R Software Modulerwasp_arimaforecasting.wasp
Title produced by softwareARIMA Forecasting
Date of computationTue, 20 Dec 2016 16:09:40 +0100
Cite this page as followsStatistical Computations at FreeStatistics.org, Office for Research Development and Education, URL https://freestatistics.org/blog/index.php?v=date/2016/Dec/20/t1482246699lpbwxt79v9zwhz6.htm/, Retrieved Sat, 27 Apr 2024 17:00:29 +0000
Statistical Computations at FreeStatistics.org, Office for Research Development and Education, URL https://freestatistics.org/blog/index.php?pk=301700, Retrieved Sat, 27 Apr 2024 17:00:29 +0000
QR Codes:

Original text written by user:
IsPrivate?No (this computation is public)
User-defined keywords
Estimated Impact82
Family? (F = Feedback message, R = changed R code, M = changed R Module, P = changed Parameters, D = changed Data)
-       [ARIMA Forecasting] [ARIMA Forecasting ] [2016-12-20 15:09:40] [86c9a777e8dbb7ef3face68c75fc8376] [Current]
Feedback Forum

Post a new message
Dataseries X:
2720
2790
3395
2810
3095
3205
3030
2525
2915
3155
3190
3300
3015
3045
3380
2975
3105
2965
3110
2475
2770
3590
3300
3100
3010
3060
3360
3475
3600
3460
3575
2730
3100
3845
3455
3760
3655
3755
3845
3855
3530
3985
3775
2770
3485
4175
4030
4120
3440
3910
4480
4200
4270
4115
4285
3355
4135
4585
4480
5030
3875
4370
5115
4735
4580
4805
4760
3645
4215
4750
4605
5070
4415
4520
4960
4850
4605
5120
4780
3515
4590
5200
5100
5285
4925
5330
5830
5450
3980
3980
6470
4585
5010
6295
5720
6035
5765
5930
6335
6615
6220
6815
6870
4250
5600
7020
6270
7260
6455
7040
7760
8050
6690
8490


Summary of computational transaction
Raw Input view raw input (R code)
Raw Outputview raw output of R engine
Computing time1 seconds
R ServerBig Analytics Cloud Computing Center

\begin{tabular}{lllllllll}
\hline
Summary of computational transaction \tabularnewline
Raw Input view raw input (R code)  \tabularnewline
Raw Outputview raw output of R engine  \tabularnewline
Computing time1 seconds \tabularnewline
R ServerBig Analytics Cloud Computing Center \tabularnewline
\hline
\end{tabular}
%Source: https://freestatistics.org/blog/index.php?pk=301700&T=0

[TABLE]
[ROW]
Summary of computational transaction[/C][/ROW] [ROW]Raw Input[/C] view raw input (R code) [/C][/ROW] [ROW]Raw Output[/C]view raw output of R engine [/C][/ROW] [ROW]Computing time[/C]1 seconds[/C][/ROW] [ROW]R Server[/C]Big Analytics Cloud Computing Center[/C][/ROW] [/TABLE] Source: https://freestatistics.org/blog/index.php?pk=301700&T=0

Globally Unique Identifier (entire table): ba.freestatistics.org/blog/index.php?pk=301700&T=0

As an alternative you can also use a QR Code:  

The GUIDs for individual cells are displayed in the table below:

Summary of computational transaction
Raw Input view raw input (R code)
Raw Outputview raw output of R engine
Computing time1 seconds
R ServerBig Analytics Cloud Computing Center


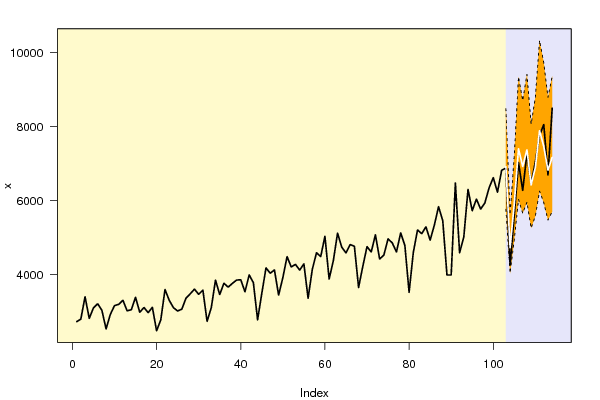
Univariate ARIMA Extrapolation Forecast
timeY[t]F[t]95% LB95% UBp-value(H0: Y[t] = F[t])P(F[t]>Y[t-1])P(F[t]>Y[t-s])P(F[t]>Y[102])
903980-------
916470-------
924585-------
935010-------
946295-------
955720-------
966035-------
975765-------
985930-------
996335-------
1006615-------
1016220-------
1026815-------
10368706911.36825759.78568481.12830.47940.54790.70920.5479
10442504721.22074034.72895615.69840.150900.61730
10556005913.58064944.83847226.09470.31980.99350.91140.0891
10670207395.04046025.50329340.49370.35280.96470.86610.7205
10762706914.90965651.86648698.81350.23930.4540.90540.5437
10872607365.48885950.28199407.94080.45970.85340.89920.7013
10964556418.0455251.91028061.52690.48240.15770.7820.318
11070406889.38085573.94868782.59080.4380.67350.83970.5307
11177607883.23566250.588510323.48990.46060.75090.89320.8046
11280507458.59275935.78489718.87460.3040.39690.76780.7116
11366906815.25465468.05678784.6270.45040.10960.72320.5001
11484907163.59925693.66259350.71720.11730.66440.62260.6226

\begin{tabular}{lllllllll}
\hline
Univariate ARIMA Extrapolation Forecast \tabularnewline
time & Y[t] & F[t] & 95% LB & 95% UB & p-value(H0: Y[t] = F[t]) & P(F[t]>Y[t-1]) & P(F[t]>Y[t-s]) & P(F[t]>Y[102]) \tabularnewline
90 & 3980 & - & - & - & - & - & - & - \tabularnewline
91 & 6470 & - & - & - & - & - & - & - \tabularnewline
92 & 4585 & - & - & - & - & - & - & - \tabularnewline
93 & 5010 & - & - & - & - & - & - & - \tabularnewline
94 & 6295 & - & - & - & - & - & - & - \tabularnewline
95 & 5720 & - & - & - & - & - & - & - \tabularnewline
96 & 6035 & - & - & - & - & - & - & - \tabularnewline
97 & 5765 & - & - & - & - & - & - & - \tabularnewline
98 & 5930 & - & - & - & - & - & - & - \tabularnewline
99 & 6335 & - & - & - & - & - & - & - \tabularnewline
100 & 6615 & - & - & - & - & - & - & - \tabularnewline
101 & 6220 & - & - & - & - & - & - & - \tabularnewline
102 & 6815 & - & - & - & - & - & - & - \tabularnewline
103 & 6870 & 6911.3682 & 5759.7856 & 8481.1283 & 0.4794 & 0.5479 & 0.7092 & 0.5479 \tabularnewline
104 & 4250 & 4721.2207 & 4034.7289 & 5615.6984 & 0.1509 & 0 & 0.6173 & 0 \tabularnewline
105 & 5600 & 5913.5806 & 4944.8384 & 7226.0947 & 0.3198 & 0.9935 & 0.9114 & 0.0891 \tabularnewline
106 & 7020 & 7395.0404 & 6025.5032 & 9340.4937 & 0.3528 & 0.9647 & 0.8661 & 0.7205 \tabularnewline
107 & 6270 & 6914.9096 & 5651.8664 & 8698.8135 & 0.2393 & 0.454 & 0.9054 & 0.5437 \tabularnewline
108 & 7260 & 7365.4888 & 5950.2819 & 9407.9408 & 0.4597 & 0.8534 & 0.8992 & 0.7013 \tabularnewline
109 & 6455 & 6418.045 & 5251.9102 & 8061.5269 & 0.4824 & 0.1577 & 0.782 & 0.318 \tabularnewline
110 & 7040 & 6889.3808 & 5573.9486 & 8782.5908 & 0.438 & 0.6735 & 0.8397 & 0.5307 \tabularnewline
111 & 7760 & 7883.2356 & 6250.5885 & 10323.4899 & 0.4606 & 0.7509 & 0.8932 & 0.8046 \tabularnewline
112 & 8050 & 7458.5927 & 5935.7848 & 9718.8746 & 0.304 & 0.3969 & 0.7678 & 0.7116 \tabularnewline
113 & 6690 & 6815.2546 & 5468.0567 & 8784.627 & 0.4504 & 0.1096 & 0.7232 & 0.5001 \tabularnewline
114 & 8490 & 7163.5992 & 5693.6625 & 9350.7172 & 0.1173 & 0.6644 & 0.6226 & 0.6226 \tabularnewline
\hline
\end{tabular}
%Source: https://freestatistics.org/blog/index.php?pk=301700&T=1

[TABLE]
[ROW][C]Univariate ARIMA Extrapolation Forecast[/C][/ROW]
[ROW][C]time[/C][C]Y[t][/C][C]F[t][/C][C]95% LB[/C][C]95% UB[/C][C]p-value(H0: Y[t] = F[t])[/C][C]P(F[t]>Y[t-1])[/C][C]P(F[t]>Y[t-s])[/C][C]P(F[t]>Y[102])[/C][/ROW]
[ROW][C]90[/C][C]3980[/C][C]-[/C][C]-[/C][C]-[/C][C]-[/C][C]-[/C][C]-[/C][C]-[/C][/ROW]
[ROW][C]91[/C][C]6470[/C][C]-[/C][C]-[/C][C]-[/C][C]-[/C][C]-[/C][C]-[/C][C]-[/C][/ROW]
[ROW][C]92[/C][C]4585[/C][C]-[/C][C]-[/C][C]-[/C][C]-[/C][C]-[/C][C]-[/C][C]-[/C][/ROW]
[ROW][C]93[/C][C]5010[/C][C]-[/C][C]-[/C][C]-[/C][C]-[/C][C]-[/C][C]-[/C][C]-[/C][/ROW]
[ROW][C]94[/C][C]6295[/C][C]-[/C][C]-[/C][C]-[/C][C]-[/C][C]-[/C][C]-[/C][C]-[/C][/ROW]
[ROW][C]95[/C][C]5720[/C][C]-[/C][C]-[/C][C]-[/C][C]-[/C][C]-[/C][C]-[/C][C]-[/C][/ROW]
[ROW][C]96[/C][C]6035[/C][C]-[/C][C]-[/C][C]-[/C][C]-[/C][C]-[/C][C]-[/C][C]-[/C][/ROW]
[ROW][C]97[/C][C]5765[/C][C]-[/C][C]-[/C][C]-[/C][C]-[/C][C]-[/C][C]-[/C][C]-[/C][/ROW]
[ROW][C]98[/C][C]5930[/C][C]-[/C][C]-[/C][C]-[/C][C]-[/C][C]-[/C][C]-[/C][C]-[/C][/ROW]
[ROW][C]99[/C][C]6335[/C][C]-[/C][C]-[/C][C]-[/C][C]-[/C][C]-[/C][C]-[/C][C]-[/C][/ROW]
[ROW][C]100[/C][C]6615[/C][C]-[/C][C]-[/C][C]-[/C][C]-[/C][C]-[/C][C]-[/C][C]-[/C][/ROW]
[ROW][C]101[/C][C]6220[/C][C]-[/C][C]-[/C][C]-[/C][C]-[/C][C]-[/C][C]-[/C][C]-[/C][/ROW]
[ROW][C]102[/C][C]6815[/C][C]-[/C][C]-[/C][C]-[/C][C]-[/C][C]-[/C][C]-[/C][C]-[/C][/ROW]
[ROW][C]103[/C][C]6870[/C][C]6911.3682[/C][C]5759.7856[/C][C]8481.1283[/C][C]0.4794[/C][C]0.5479[/C][C]0.7092[/C][C]0.5479[/C][/ROW]
[ROW][C]104[/C][C]4250[/C][C]4721.2207[/C][C]4034.7289[/C][C]5615.6984[/C][C]0.1509[/C][C]0[/C][C]0.6173[/C][C]0[/C][/ROW]
[ROW][C]105[/C][C]5600[/C][C]5913.5806[/C][C]4944.8384[/C][C]7226.0947[/C][C]0.3198[/C][C]0.9935[/C][C]0.9114[/C][C]0.0891[/C][/ROW]
[ROW][C]106[/C][C]7020[/C][C]7395.0404[/C][C]6025.5032[/C][C]9340.4937[/C][C]0.3528[/C][C]0.9647[/C][C]0.8661[/C][C]0.7205[/C][/ROW]
[ROW][C]107[/C][C]6270[/C][C]6914.9096[/C][C]5651.8664[/C][C]8698.8135[/C][C]0.2393[/C][C]0.454[/C][C]0.9054[/C][C]0.5437[/C][/ROW]
[ROW][C]108[/C][C]7260[/C][C]7365.4888[/C][C]5950.2819[/C][C]9407.9408[/C][C]0.4597[/C][C]0.8534[/C][C]0.8992[/C][C]0.7013[/C][/ROW]
[ROW][C]109[/C][C]6455[/C][C]6418.045[/C][C]5251.9102[/C][C]8061.5269[/C][C]0.4824[/C][C]0.1577[/C][C]0.782[/C][C]0.318[/C][/ROW]
[ROW][C]110[/C][C]7040[/C][C]6889.3808[/C][C]5573.9486[/C][C]8782.5908[/C][C]0.438[/C][C]0.6735[/C][C]0.8397[/C][C]0.5307[/C][/ROW]
[ROW][C]111[/C][C]7760[/C][C]7883.2356[/C][C]6250.5885[/C][C]10323.4899[/C][C]0.4606[/C][C]0.7509[/C][C]0.8932[/C][C]0.8046[/C][/ROW]
[ROW][C]112[/C][C]8050[/C][C]7458.5927[/C][C]5935.7848[/C][C]9718.8746[/C][C]0.304[/C][C]0.3969[/C][C]0.7678[/C][C]0.7116[/C][/ROW]
[ROW][C]113[/C][C]6690[/C][C]6815.2546[/C][C]5468.0567[/C][C]8784.627[/C][C]0.4504[/C][C]0.1096[/C][C]0.7232[/C][C]0.5001[/C][/ROW]
[ROW][C]114[/C][C]8490[/C][C]7163.5992[/C][C]5693.6625[/C][C]9350.7172[/C][C]0.1173[/C][C]0.6644[/C][C]0.6226[/C][C]0.6226[/C][/ROW]
[/TABLE]
Source: https://freestatistics.org/blog/index.php?pk=301700&T=1

Globally Unique Identifier (entire table): ba.freestatistics.org/blog/index.php?pk=301700&T=1

As an alternative you can also use a QR Code:  

The GUIDs for individual cells are displayed in the table below:

Univariate ARIMA Extrapolation Forecast
timeY[t]F[t]95% LB95% UBp-value(H0: Y[t] = F[t])P(F[t]>Y[t-1])P(F[t]>Y[t-s])P(F[t]>Y[102])
903980-------
916470-------
924585-------
935010-------
946295-------
955720-------
966035-------
975765-------
985930-------
996335-------
1006615-------
1016220-------
1026815-------
10368706911.36825759.78568481.12830.47940.54790.70920.5479
10442504721.22074034.72895615.69840.150900.61730
10556005913.58064944.83847226.09470.31980.99350.91140.0891
10670207395.04046025.50329340.49370.35280.96470.86610.7205
10762706914.90965651.86648698.81350.23930.4540.90540.5437
10872607365.48885950.28199407.94080.45970.85340.89920.7013
10964556418.0455251.91028061.52690.48240.15770.7820.318
11070406889.38085573.94868782.59080.4380.67350.83970.5307
11177607883.23566250.588510323.48990.46060.75090.89320.8046
11280507458.59275935.78489718.87460.3040.39690.76780.7116
11366906815.25465468.05678784.6270.45040.10960.72320.5001
11484907163.59925693.66259350.71720.11730.66440.62260.6226


Univariate ARIMA Extrapolation Forecast Performance
time% S.E.PEMAPEsMAPESq.EMSERMSEScaledEMASE
1030.1159-0.0060.0060.0061711.3300-0.03590.0359
1040.0967-0.11090.05840.0555222048.937111880.1335334.4849-0.40850.2222
1050.1132-0.0560.05760.055298332.7734107364.3468327.665-0.27180.2387
1060.1342-0.05340.05660.0544140655.3137115687.0885340.128-0.32510.2603
1070.1316-0.10290.06580.0631415908.4067175731.3521419.2032-0.5590.3201
1080.1415-0.01450.05730.05511127.8829148297.4406385.0941-0.09140.282
1090.13060.00570.04990.04791365.6722127307.188356.80130.0320.2462
1100.14020.02140.04640.044622686.1431114229.5574337.97860.13060.2318
1110.1579-0.01590.0430.041415187.0015103224.8289321.2862-0.10680.2179
1120.15460.07350.0460.0449349762.538127878.5998357.60120.51260.2474
1130.1474-0.01870.04350.042515688.7048117679.5185343.0445-0.10860.2348
1140.15580.15620.05290.05311759339.2053254484.4924504.46461.14980.311

\begin{tabular}{lllllllll}
\hline
Univariate ARIMA Extrapolation Forecast Performance \tabularnewline
time & % S.E. & PE & MAPE & sMAPE & Sq.E & MSE & RMSE & ScaledE & MASE \tabularnewline
103 & 0.1159 & -0.006 & 0.006 & 0.006 & 1711.33 & 0 & 0 & -0.0359 & 0.0359 \tabularnewline
104 & 0.0967 & -0.1109 & 0.0584 & 0.0555 & 222048.937 & 111880.1335 & 334.4849 & -0.4085 & 0.2222 \tabularnewline
105 & 0.1132 & -0.056 & 0.0576 & 0.0552 & 98332.7734 & 107364.3468 & 327.665 & -0.2718 & 0.2387 \tabularnewline
106 & 0.1342 & -0.0534 & 0.0566 & 0.0544 & 140655.3137 & 115687.0885 & 340.128 & -0.3251 & 0.2603 \tabularnewline
107 & 0.1316 & -0.1029 & 0.0658 & 0.0631 & 415908.4067 & 175731.3521 & 419.2032 & -0.559 & 0.3201 \tabularnewline
108 & 0.1415 & -0.0145 & 0.0573 & 0.055 & 11127.8829 & 148297.4406 & 385.0941 & -0.0914 & 0.282 \tabularnewline
109 & 0.1306 & 0.0057 & 0.0499 & 0.0479 & 1365.6722 & 127307.188 & 356.8013 & 0.032 & 0.2462 \tabularnewline
110 & 0.1402 & 0.0214 & 0.0464 & 0.0446 & 22686.1431 & 114229.5574 & 337.9786 & 0.1306 & 0.2318 \tabularnewline
111 & 0.1579 & -0.0159 & 0.043 & 0.0414 & 15187.0015 & 103224.8289 & 321.2862 & -0.1068 & 0.2179 \tabularnewline
112 & 0.1546 & 0.0735 & 0.046 & 0.0449 & 349762.538 & 127878.5998 & 357.6012 & 0.5126 & 0.2474 \tabularnewline
113 & 0.1474 & -0.0187 & 0.0435 & 0.0425 & 15688.7048 & 117679.5185 & 343.0445 & -0.1086 & 0.2348 \tabularnewline
114 & 0.1558 & 0.1562 & 0.0529 & 0.0531 & 1759339.2053 & 254484.4924 & 504.4646 & 1.1498 & 0.311 \tabularnewline
\hline
\end{tabular}
%Source: https://freestatistics.org/blog/index.php?pk=301700&T=2

[TABLE]
[ROW][C]Univariate ARIMA Extrapolation Forecast Performance[/C][/ROW]
[ROW][C]time[/C][C]% S.E.[/C][C]PE[/C][C]MAPE[/C][C]sMAPE[/C][C]Sq.E[/C][C]MSE[/C][C]RMSE[/C][C]ScaledE[/C][C]MASE[/C][/ROW]
[ROW][C]103[/C][C]0.1159[/C][C]-0.006[/C][C]0.006[/C][C]0.006[/C][C]1711.33[/C][C]0[/C][C]0[/C][C]-0.0359[/C][C]0.0359[/C][/ROW]
[ROW][C]104[/C][C]0.0967[/C][C]-0.1109[/C][C]0.0584[/C][C]0.0555[/C][C]222048.937[/C][C]111880.1335[/C][C]334.4849[/C][C]-0.4085[/C][C]0.2222[/C][/ROW]
[ROW][C]105[/C][C]0.1132[/C][C]-0.056[/C][C]0.0576[/C][C]0.0552[/C][C]98332.7734[/C][C]107364.3468[/C][C]327.665[/C][C]-0.2718[/C][C]0.2387[/C][/ROW]
[ROW][C]106[/C][C]0.1342[/C][C]-0.0534[/C][C]0.0566[/C][C]0.0544[/C][C]140655.3137[/C][C]115687.0885[/C][C]340.128[/C][C]-0.3251[/C][C]0.2603[/C][/ROW]
[ROW][C]107[/C][C]0.1316[/C][C]-0.1029[/C][C]0.0658[/C][C]0.0631[/C][C]415908.4067[/C][C]175731.3521[/C][C]419.2032[/C][C]-0.559[/C][C]0.3201[/C][/ROW]
[ROW][C]108[/C][C]0.1415[/C][C]-0.0145[/C][C]0.0573[/C][C]0.055[/C][C]11127.8829[/C][C]148297.4406[/C][C]385.0941[/C][C]-0.0914[/C][C]0.282[/C][/ROW]
[ROW][C]109[/C][C]0.1306[/C][C]0.0057[/C][C]0.0499[/C][C]0.0479[/C][C]1365.6722[/C][C]127307.188[/C][C]356.8013[/C][C]0.032[/C][C]0.2462[/C][/ROW]
[ROW][C]110[/C][C]0.1402[/C][C]0.0214[/C][C]0.0464[/C][C]0.0446[/C][C]22686.1431[/C][C]114229.5574[/C][C]337.9786[/C][C]0.1306[/C][C]0.2318[/C][/ROW]
[ROW][C]111[/C][C]0.1579[/C][C]-0.0159[/C][C]0.043[/C][C]0.0414[/C][C]15187.0015[/C][C]103224.8289[/C][C]321.2862[/C][C]-0.1068[/C][C]0.2179[/C][/ROW]
[ROW][C]112[/C][C]0.1546[/C][C]0.0735[/C][C]0.046[/C][C]0.0449[/C][C]349762.538[/C][C]127878.5998[/C][C]357.6012[/C][C]0.5126[/C][C]0.2474[/C][/ROW]
[ROW][C]113[/C][C]0.1474[/C][C]-0.0187[/C][C]0.0435[/C][C]0.0425[/C][C]15688.7048[/C][C]117679.5185[/C][C]343.0445[/C][C]-0.1086[/C][C]0.2348[/C][/ROW]
[ROW][C]114[/C][C]0.1558[/C][C]0.1562[/C][C]0.0529[/C][C]0.0531[/C][C]1759339.2053[/C][C]254484.4924[/C][C]504.4646[/C][C]1.1498[/C][C]0.311[/C][/ROW]
[/TABLE]
Source: https://freestatistics.org/blog/index.php?pk=301700&T=2

Globally Unique Identifier (entire table): ba.freestatistics.org/blog/index.php?pk=301700&T=2

As an alternative you can also use a QR Code:  

The GUIDs for individual cells are displayed in the table below:

Univariate ARIMA Extrapolation Forecast Performance
time% S.E.PEMAPEsMAPESq.EMSERMSEScaledEMASE
1030.1159-0.0060.0060.0061711.3300-0.03590.0359
1040.0967-0.11090.05840.0555222048.937111880.1335334.4849-0.40850.2222
1050.1132-0.0560.05760.055298332.7734107364.3468327.665-0.27180.2387
1060.1342-0.05340.05660.0544140655.3137115687.0885340.128-0.32510.2603
1070.1316-0.10290.06580.0631415908.4067175731.3521419.2032-0.5590.3201
1080.1415-0.01450.05730.05511127.8829148297.4406385.0941-0.09140.282
1090.13060.00570.04990.04791365.6722127307.188356.80130.0320.2462
1100.14020.02140.04640.044622686.1431114229.5574337.97860.13060.2318
1110.1579-0.01590.0430.041415187.0015103224.8289321.2862-0.10680.2179
1120.15460.07350.0460.0449349762.538127878.5998357.60120.51260.2474
1130.1474-0.01870.04350.042515688.7048117679.5185343.0445-0.10860.2348
1140.15580.15620.05290.05311759339.2053254484.4924504.46461.14980.311


Parameters (Session):
par1 = Default ; par2 = 1 ; par3 = 1 ; par4 = 1 ; par5 = 12 ; par6 = White Noise ; par7 = 0.95 ;
Parameters (R input):
par1 = 12 ; par2 = -0.6 ; par3 = 1 ; par4 = 1 ; par5 = 12 ; par6 = 2 ; par7 = 1 ; par8 = 0 ; par9 = 1 ; par10 = FALSE ;
R code (references can be found in the software module):
par10 <- 'FALSE'
par9 <- '1'
par8 <- '0'
par7 <- '0'
par6 <- '2'
par5 <- '1'
par4 <- '1'
par3 <- '1'
par2 <- '-0.6'
par1 <- '12'
par1 <- as.numeric(par1) #cut off periods
par2 <- as.numeric(par2) #lambda
par3 <- as.numeric(par3) #degree of non-seasonal differencing
par4 <- as.numeric(par4) #degree of seasonal differencing
par5 <- as.numeric(par5) #seasonal period
par6 <- as.numeric(par6) #p
par7 <- as.numeric(par7) #q
par8 <- as.numeric(par8) #P
par9 <- as.numeric(par9) #Q
if (par10 == 'TRUE') par10 <- TRUE
if (par10 == 'FALSE') par10 <- FALSE
if (par2 == 0) x <- log(x)
if (par2 != 0) x <- x^par2
lx <- length(x)
first <- lx - 2*par1
nx <- lx - par1
nx1 <- nx + 1
fx <- lx - nx
if (fx < 1) {
fx <- par5*2
nx1 <- lx + fx - 1
first <- lx - 2*fx
}
first <- 1
if (fx < 3) fx <- round(lx/10,0)
(arima.out <- arima(x[1:nx], order=c(par6,par3,par7), seasonal=list(order=c(par8,par4,par9), period=par5), include.mean=par10, method='ML'))
(forecast <- predict(arima.out,fx))
(lb <- forecast$pred - 1.96 * forecast$se)
(ub <- forecast$pred + 1.96 * forecast$se)
if (par2 == 0) {
x <- exp(x)
forecast$pred <- exp(forecast$pred)
lb <- exp(lb)
ub <- exp(ub)
}
if (par2 != 0) {
x <- x^(1/par2)
forecast$pred <- forecast$pred^(1/par2)
lb <- lb^(1/par2)
ub <- ub^(1/par2)
}
if (par2 < 0) {
olb <- lb
lb <- ub
ub <- olb
}
(actandfor <- c(x[1:nx], forecast$pred))
(perc.se <- (ub-forecast$pred)/1.96/forecast$pred)
bitmap(file='test1.png')
opar <- par(mar=c(4,4,2,2),las=1)
ylim <- c( min(x[first:nx],lb), max(x[first:nx],ub))
plot(x,ylim=ylim,type='n',xlim=c(first,lx))
usr <- par('usr')
rect(usr[1],usr[3],nx+1,usr[4],border=NA,col='lemonchiffon')
rect(nx1,usr[3],usr[2],usr[4],border=NA,col='lavender')
abline(h= (-3:3)*2 , col ='gray', lty =3)
polygon( c(nx1:lx,lx:nx1), c(lb,rev(ub)), col = 'orange', lty=2,border=NA)
lines(nx1:lx, lb , lty=2)
lines(nx1:lx, ub , lty=2)
lines(x, lwd=2)
lines(nx1:lx, forecast$pred , lwd=2 , col ='white')
box()
par(opar)
dev.off()
prob.dec <- array(NA, dim=fx)
prob.sdec <- array(NA, dim=fx)
prob.ldec <- array(NA, dim=fx)
prob.pval <- array(NA, dim=fx)
perf.pe <- array(0, dim=fx)
perf.spe <- array(0, dim=fx)
perf.scalederr <- array(0, dim=fx)
perf.mase <- array(0, dim=fx)
perf.mase1 <- array(0, dim=fx)
perf.mape <- array(0, dim=fx)
perf.smape <- array(0, dim=fx)
perf.mape1 <- array(0, dim=fx)
perf.smape1 <- array(0,dim=fx)
perf.se <- array(0, dim=fx)
perf.mse <- array(0, dim=fx)
perf.mse1 <- array(0, dim=fx)
perf.rmse <- array(0, dim=fx)
perf.scaleddenom <- 0
for (i in 2:fx) {
perf.scaleddenom = perf.scaleddenom + abs(x[nx+i] - x[nx+i-1])
}
perf.scaleddenom = perf.scaleddenom / (fx-1)
for (i in 1:fx) {
locSD <- (ub[i] - forecast$pred[i]) / 1.96
perf.scalederr[i] = (x[nx+i] - forecast$pred[i]) / perf.scaleddenom
perf.pe[i] = (x[nx+i] - forecast$pred[i]) / x[nx+i]
perf.spe[i] = 2*(x[nx+i] - forecast$pred[i]) / (x[nx+i] + forecast$pred[i])
perf.se[i] = (x[nx+i] - forecast$pred[i])^2
prob.dec[i] = pnorm((x[nx+i-1] - forecast$pred[i]) / locSD)
prob.sdec[i] = pnorm((x[nx+i-par5] - forecast$pred[i]) / locSD)
prob.ldec[i] = pnorm((x[nx] - forecast$pred[i]) / locSD)
prob.pval[i] = pnorm(abs(x[nx+i] - forecast$pred[i]) / locSD)
}
perf.mape[1] = abs(perf.pe[1])
perf.smape[1] = abs(perf.spe[1])
perf.mape1[1] = perf.mape[1]
perf.smape1[1] = perf.smape[1]
perf.mse[1] = perf.se[1]
perf.mase[1] = abs(perf.scalederr[1])
perf.mase1[1] = perf.mase[1]
for (i in 2:fx) {
perf.mape[i] = perf.mape[i-1] + abs(perf.pe[i])
perf.mape1[i] = perf.mape[i] / i
perf.smape[i] = perf.smape[i-1] + abs(perf.spe[i])
perf.smape1[i] = perf.smape[i] / i
perf.mse[i] = perf.mse[i-1] + perf.se[i]
perf.mse1[i] = perf.mse[i] / i
perf.mase[i] = perf.mase[i-1] + abs(perf.scalederr[i])
perf.mase1[i] = perf.mase[i] / i
}
perf.rmse = sqrt(perf.mse1)
bitmap(file='test2.png')
plot(forecast$pred, pch=19, type='b',main='ARIMA Extrapolation Forecast', ylab='Forecast and 95% CI', xlab='time',ylim=c(min(lb),max(ub)))
dum <- forecast$pred
dum[1:par1] <- x[(nx+1):lx]
lines(dum, lty=1)
lines(ub,lty=3)
lines(lb,lty=3)
dev.off()
load(file='createtable')
a<-table.start()
a<-table.row.start(a)
a<-table.element(a,'Univariate ARIMA Extrapolation Forecast',9,TRUE)
a<-table.row.end(a)
a<-table.row.start(a)
a<-table.element(a,'time',1,header=TRUE)
a<-table.element(a,'Y[t]',1,header=TRUE)
a<-table.element(a,'F[t]',1,header=TRUE)
a<-table.element(a,'95% LB',1,header=TRUE)
a<-table.element(a,'95% UB',1,header=TRUE)
a<-table.element(a,'p-value
(H0: Y[t] = F[t])',1,header=TRUE)
a<-table.element(a,'P(F[t]>Y[t-1])',1,header=TRUE)
a<-table.element(a,'P(F[t]>Y[t-s])',1,header=TRUE)
mylab <- paste('P(F[t]>Y[',nx,sep='')
mylab <- paste(mylab,'])',sep='')
a<-table.element(a,mylab,1,header=TRUE)
a<-table.row.end(a)
for (i in (nx-par5):nx) {
a<-table.row.start(a)
a<-table.element(a,i,header=TRUE)
a<-table.element(a,x[i])
a<-table.element(a,'-')
a<-table.row.end(a)
}
for (i in 1:fx) {
a<-table.row.start(a)
a<-table.element(a,nx+i,header=TRUE)
a<-table.element(a,round(x[nx+i],4))
a<-table.element(a,round(forecast$pred[i],4))
a<-table.element(a,round(lb[i],4))
a<-table.element(a,round(ub[i],4))
a<-table.element(a,round((1-prob.pval[i]),4))
a<-table.element(a,round((1-prob.dec[i]),4))
a<-table.element(a,round((1-prob.sdec[i]),4))
a<-table.element(a,round((1-prob.ldec[i]),4))
a<-table.row.end(a)
}
a<-table.end(a)
table.save(a,file='mytable.tab')
a<-table.start()
a<-table.row.start(a)
a<-table.element(a,'Univariate ARIMA Extrapolation Forecast Performance',10,TRUE)
a<-table.row.end(a)
a<-table.row.start(a)
a<-table.element(a,'time',1,header=TRUE)
a<-table.element(a,'% S.E.',1,header=TRUE)
a<-table.element(a,'PE',1,header=TRUE)
a<-table.element(a,'MAPE',1,header=TRUE)
a<-table.element(a,'sMAPE',1,header=TRUE)
a<-table.element(a,'Sq.E',1,header=TRUE)
a<-table.element(a,'MSE',1,header=TRUE)
a<-table.element(a,'RMSE',1,header=TRUE)
a<-table.element(a,'ScaledE',1,header=TRUE)
a<-table.element(a,'MASE',1,header=TRUE)
a<-table.row.end(a)
for (i in 1:fx) {
a<-table.row.start(a)
a<-table.element(a,nx+i,header=TRUE)
a<-table.element(a,round(perc.se[i],4))
a<-table.element(a,round(perf.pe[i],4))
a<-table.element(a,round(perf.mape1[i],4))
a<-table.element(a,round(perf.smape1[i],4))
a<-table.element(a,round(perf.se[i],4))
a<-table.element(a,round(perf.mse1[i],4))
a<-table.element(a,round(perf.rmse[i],4))
a<-table.element(a,round(perf.scalederr[i],4))
a<-table.element(a,round(perf.mase1[i],4))
a<-table.row.end(a)
}
a<-table.end(a)
table.save(a,file='mytable1.tab')