Free Statistics

of Irreproducible Research!

Author's title

Author*The author of this computation has been verified*
R Software Modulerwasp_autocorrelation.wasp
Title produced by software(Partial) Autocorrelation Function
Date of computationTue, 20 Dec 2016 16:14:02 +0100
Cite this page as followsStatistical Computations at FreeStatistics.org, Office for Research Development and Education, URL https://freestatistics.org/blog/index.php?v=date/2016/Dec/20/t1482246875s1y3yi6v3x0p7y5.htm/, Retrieved Sun, 28 Apr 2024 00:19:07 +0000
Statistical Computations at FreeStatistics.org, Office for Research Development and Education, URL https://freestatistics.org/blog/index.php?pk=301704, Retrieved Sun, 28 Apr 2024 00:19:07 +0000
QR Codes:

Original text written by user:
IsPrivate?No (this computation is public)
User-defined keywords
Estimated Impact64
Family? (F = Feedback message, R = changed R code, M = changed R Module, P = changed Parameters, D = changed Data)
-       [(Partial) Autocorrelation Function] [] [2016-12-20 15:14:02] [361c8dad91b3f1ef2e651cd04783c23b] [Current]
Feedback Forum

Post a new message
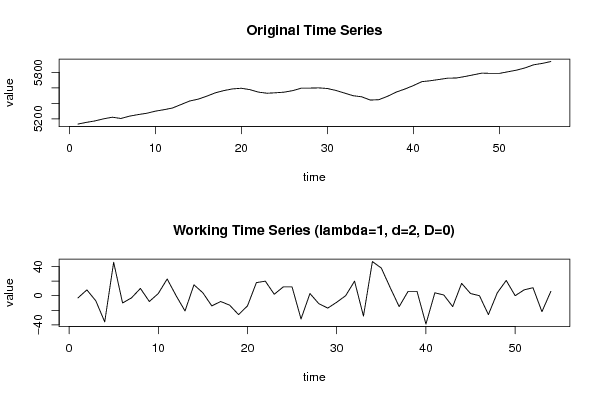
Dataseries X:
5133
5155
5174
5201
5221
5205
5235
5255
5272
5299
5318
5340
5385
5430
5454
5493
5536
5565
5586
5594
5576
5544
5530
5536
5544
5564
5596
5596
5599
5591
5566
5532
5498
5484
5442
5447
5490
5544
5583
5628
5679
5691
5707
5724
5726
5745
5767
5789
5785
5785
5806
5827
5856
5896
5914
5938


Summary of computational transaction
Raw Input view raw input (R code)
Raw Outputview raw output of R engine
Computing time1 seconds
R ServerBig Analytics Cloud Computing Center

\begin{tabular}{lllllllll}
\hline
Summary of computational transaction \tabularnewline
Raw Input view raw input (R code)  \tabularnewline
Raw Outputview raw output of R engine  \tabularnewline
Computing time1 seconds \tabularnewline
R ServerBig Analytics Cloud Computing Center \tabularnewline
\hline
\end{tabular}
%Source: https://freestatistics.org/blog/index.php?pk=301704&T=0

[TABLE]
[ROW]
Summary of computational transaction[/C][/ROW] [ROW]Raw Input[/C] view raw input (R code) [/C][/ROW] [ROW]Raw Output[/C]view raw output of R engine [/C][/ROW] [ROW]Computing time[/C]1 seconds[/C][/ROW] [ROW]R Server[/C]Big Analytics Cloud Computing Center[/C][/ROW] [/TABLE] Source: https://freestatistics.org/blog/index.php?pk=301704&T=0

Globally Unique Identifier (entire table): ba.freestatistics.org/blog/index.php?pk=301704&T=0

As an alternative you can also use a QR Code:  

The GUIDs for individual cells are displayed in the table below:

Summary of computational transaction
Raw Input view raw input (R code)
Raw Outputview raw output of R engine
Computing time1 seconds
R ServerBig Analytics Cloud Computing Center


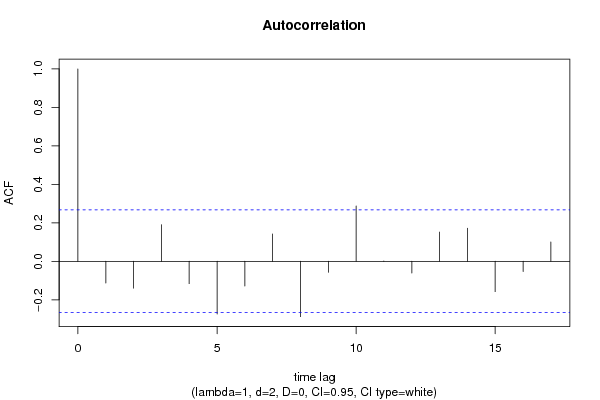
Autocorrelation Function
Time lag kACF(k)T-STATP-value
1-0.112694-0.82810.205621
2-0.139524-1.02530.1549
30.190361.39890.083787
4-0.116046-0.85280.198779
5-0.274259-2.01540.024427
6-0.128691-0.94570.174261
70.141871.04250.150906
8-0.287862-2.11530.019515
9-0.057048-0.41920.33836
100.2871562.11020.019747
110.0018080.01330.494725
12-0.060758-0.44650.328518
130.1518311.11570.134741
140.1714571.25990.106554
15-0.157881-1.16020.125539
16-0.052859-0.38840.349613
170.1007280.74020.231194

\begin{tabular}{lllllllll}
\hline
Autocorrelation Function \tabularnewline
Time lag k & ACF(k) & T-STAT & P-value \tabularnewline
1 & -0.112694 & -0.8281 & 0.205621 \tabularnewline
2 & -0.139524 & -1.0253 & 0.1549 \tabularnewline
3 & 0.19036 & 1.3989 & 0.083787 \tabularnewline
4 & -0.116046 & -0.8528 & 0.198779 \tabularnewline
5 & -0.274259 & -2.0154 & 0.024427 \tabularnewline
6 & -0.128691 & -0.9457 & 0.174261 \tabularnewline
7 & 0.14187 & 1.0425 & 0.150906 \tabularnewline
8 & -0.287862 & -2.1153 & 0.019515 \tabularnewline
9 & -0.057048 & -0.4192 & 0.33836 \tabularnewline
10 & 0.287156 & 2.1102 & 0.019747 \tabularnewline
11 & 0.001808 & 0.0133 & 0.494725 \tabularnewline
12 & -0.060758 & -0.4465 & 0.328518 \tabularnewline
13 & 0.151831 & 1.1157 & 0.134741 \tabularnewline
14 & 0.171457 & 1.2599 & 0.106554 \tabularnewline
15 & -0.157881 & -1.1602 & 0.125539 \tabularnewline
16 & -0.052859 & -0.3884 & 0.349613 \tabularnewline
17 & 0.100728 & 0.7402 & 0.231194 \tabularnewline
\hline
\end{tabular}
%Source: https://freestatistics.org/blog/index.php?pk=301704&T=1

[TABLE]
[ROW][C]Autocorrelation Function[/C][/ROW]
[ROW][C]Time lag k[/C][C]ACF(k)[/C][C]T-STAT[/C][C]P-value[/C][/ROW]
[ROW][C]1[/C][C]-0.112694[/C][C]-0.8281[/C][C]0.205621[/C][/ROW]
[ROW][C]2[/C][C]-0.139524[/C][C]-1.0253[/C][C]0.1549[/C][/ROW]
[ROW][C]3[/C][C]0.19036[/C][C]1.3989[/C][C]0.083787[/C][/ROW]
[ROW][C]4[/C][C]-0.116046[/C][C]-0.8528[/C][C]0.198779[/C][/ROW]
[ROW][C]5[/C][C]-0.274259[/C][C]-2.0154[/C][C]0.024427[/C][/ROW]
[ROW][C]6[/C][C]-0.128691[/C][C]-0.9457[/C][C]0.174261[/C][/ROW]
[ROW][C]7[/C][C]0.14187[/C][C]1.0425[/C][C]0.150906[/C][/ROW]
[ROW][C]8[/C][C]-0.287862[/C][C]-2.1153[/C][C]0.019515[/C][/ROW]
[ROW][C]9[/C][C]-0.057048[/C][C]-0.4192[/C][C]0.33836[/C][/ROW]
[ROW][C]10[/C][C]0.287156[/C][C]2.1102[/C][C]0.019747[/C][/ROW]
[ROW][C]11[/C][C]0.001808[/C][C]0.0133[/C][C]0.494725[/C][/ROW]
[ROW][C]12[/C][C]-0.060758[/C][C]-0.4465[/C][C]0.328518[/C][/ROW]
[ROW][C]13[/C][C]0.151831[/C][C]1.1157[/C][C]0.134741[/C][/ROW]
[ROW][C]14[/C][C]0.171457[/C][C]1.2599[/C][C]0.106554[/C][/ROW]
[ROW][C]15[/C][C]-0.157881[/C][C]-1.1602[/C][C]0.125539[/C][/ROW]
[ROW][C]16[/C][C]-0.052859[/C][C]-0.3884[/C][C]0.349613[/C][/ROW]
[ROW][C]17[/C][C]0.100728[/C][C]0.7402[/C][C]0.231194[/C][/ROW]
[/TABLE]
Source: https://freestatistics.org/blog/index.php?pk=301704&T=1

Globally Unique Identifier (entire table): ba.freestatistics.org/blog/index.php?pk=301704&T=1

As an alternative you can also use a QR Code:  

The GUIDs for individual cells are displayed in the table below:

Autocorrelation Function
Time lag kACF(k)T-STATP-value
1-0.112694-0.82810.205621
2-0.139524-1.02530.1549
30.190361.39890.083787
4-0.116046-0.85280.198779
5-0.274259-2.01540.024427
6-0.128691-0.94570.174261
70.141871.04250.150906
8-0.287862-2.11530.019515
9-0.057048-0.41920.33836
100.2871562.11020.019747
110.0018080.01330.494725
12-0.060758-0.44650.328518
130.1518311.11570.134741
140.1714571.25990.106554
15-0.157881-1.16020.125539
16-0.052859-0.38840.349613
170.1007280.74020.231194


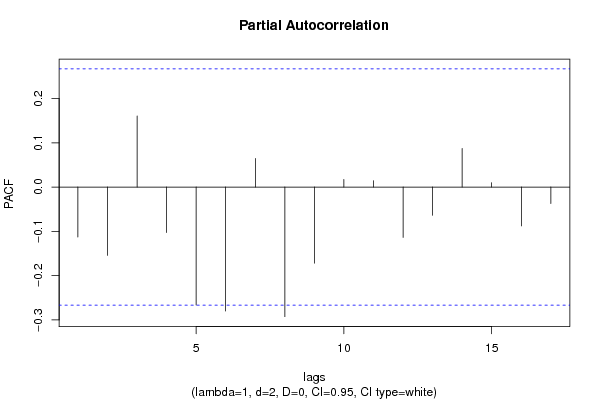
Partial Autocorrelation Function
Time lag kPACF(k)T-STATP-value
1-0.112694-0.82810.205621
2-0.154182-1.1330.13111
30.1606481.18050.121484
4-0.102767-0.75520.226711
5-0.266146-1.95580.027838
6-0.279967-2.05730.022248
70.0644140.47330.318937
8-0.292576-2.150.018026
9-0.171727-1.26190.106199
100.017060.12540.450351
110.0142310.10460.45855
12-0.113625-0.8350.203707
13-0.06361-0.46740.321035
140.0870420.63960.262559
150.0096910.07120.471744
16-0.087692-0.64440.261022
17-0.037142-0.27290.392972

\begin{tabular}{lllllllll}
\hline
Partial Autocorrelation Function \tabularnewline
Time lag k & PACF(k) & T-STAT & P-value \tabularnewline
1 & -0.112694 & -0.8281 & 0.205621 \tabularnewline
2 & -0.154182 & -1.133 & 0.13111 \tabularnewline
3 & 0.160648 & 1.1805 & 0.121484 \tabularnewline
4 & -0.102767 & -0.7552 & 0.226711 \tabularnewline
5 & -0.266146 & -1.9558 & 0.027838 \tabularnewline
6 & -0.279967 & -2.0573 & 0.022248 \tabularnewline
7 & 0.064414 & 0.4733 & 0.318937 \tabularnewline
8 & -0.292576 & -2.15 & 0.018026 \tabularnewline
9 & -0.171727 & -1.2619 & 0.106199 \tabularnewline
10 & 0.01706 & 0.1254 & 0.450351 \tabularnewline
11 & 0.014231 & 0.1046 & 0.45855 \tabularnewline
12 & -0.113625 & -0.835 & 0.203707 \tabularnewline
13 & -0.06361 & -0.4674 & 0.321035 \tabularnewline
14 & 0.087042 & 0.6396 & 0.262559 \tabularnewline
15 & 0.009691 & 0.0712 & 0.471744 \tabularnewline
16 & -0.087692 & -0.6444 & 0.261022 \tabularnewline
17 & -0.037142 & -0.2729 & 0.392972 \tabularnewline
\hline
\end{tabular}
%Source: https://freestatistics.org/blog/index.php?pk=301704&T=2

[TABLE]
[ROW][C]Partial Autocorrelation Function[/C][/ROW]
[ROW][C]Time lag k[/C][C]PACF(k)[/C][C]T-STAT[/C][C]P-value[/C][/ROW]
[ROW][C]1[/C][C]-0.112694[/C][C]-0.8281[/C][C]0.205621[/C][/ROW]
[ROW][C]2[/C][C]-0.154182[/C][C]-1.133[/C][C]0.13111[/C][/ROW]
[ROW][C]3[/C][C]0.160648[/C][C]1.1805[/C][C]0.121484[/C][/ROW]
[ROW][C]4[/C][C]-0.102767[/C][C]-0.7552[/C][C]0.226711[/C][/ROW]
[ROW][C]5[/C][C]-0.266146[/C][C]-1.9558[/C][C]0.027838[/C][/ROW]
[ROW][C]6[/C][C]-0.279967[/C][C]-2.0573[/C][C]0.022248[/C][/ROW]
[ROW][C]7[/C][C]0.064414[/C][C]0.4733[/C][C]0.318937[/C][/ROW]
[ROW][C]8[/C][C]-0.292576[/C][C]-2.15[/C][C]0.018026[/C][/ROW]
[ROW][C]9[/C][C]-0.171727[/C][C]-1.2619[/C][C]0.106199[/C][/ROW]
[ROW][C]10[/C][C]0.01706[/C][C]0.1254[/C][C]0.450351[/C][/ROW]
[ROW][C]11[/C][C]0.014231[/C][C]0.1046[/C][C]0.45855[/C][/ROW]
[ROW][C]12[/C][C]-0.113625[/C][C]-0.835[/C][C]0.203707[/C][/ROW]
[ROW][C]13[/C][C]-0.06361[/C][C]-0.4674[/C][C]0.321035[/C][/ROW]
[ROW][C]14[/C][C]0.087042[/C][C]0.6396[/C][C]0.262559[/C][/ROW]
[ROW][C]15[/C][C]0.009691[/C][C]0.0712[/C][C]0.471744[/C][/ROW]
[ROW][C]16[/C][C]-0.087692[/C][C]-0.6444[/C][C]0.261022[/C][/ROW]
[ROW][C]17[/C][C]-0.037142[/C][C]-0.2729[/C][C]0.392972[/C][/ROW]
[/TABLE]
Source: https://freestatistics.org/blog/index.php?pk=301704&T=2

Globally Unique Identifier (entire table): ba.freestatistics.org/blog/index.php?pk=301704&T=2

As an alternative you can also use a QR Code:  

The GUIDs for individual cells are displayed in the table below:

Partial Autocorrelation Function
Time lag kPACF(k)T-STATP-value
1-0.112694-0.82810.205621
2-0.154182-1.1330.13111
30.1606481.18050.121484
4-0.102767-0.75520.226711
5-0.266146-1.95580.027838
6-0.279967-2.05730.022248
70.0644140.47330.318937
8-0.292576-2.150.018026
9-0.171727-1.26190.106199
100.017060.12540.450351
110.0142310.10460.45855
12-0.113625-0.8350.203707
13-0.06361-0.46740.321035
140.0870420.63960.262559
150.0096910.07120.471744
16-0.087692-0.64440.261022
17-0.037142-0.27290.392972


Parameters (Session):
par1 = Default ; par2 = 1 ; par3 = 2 ; par4 = 0 ; par5 = 12 ; par6 = White Noise ; par7 = 0.95 ;
Parameters (R input):
par1 = Default ; par2 = 1 ; par3 = 2 ; par4 = 0 ; par5 = 12 ; par6 = White Noise ; par7 = 0.95 ; par8 = ;
R code (references can be found in the software module):
par8 <- ''
par7 <- '0.95'
par6 <- 'White Noise'
par5 <- '12'
par4 <- '2'
par3 <- '1'
par2 <- '1'
par1 <- 'Default'
if (par1 == 'Default') {
par1 = 10*log10(length(x))
} else {
par1 <- as.numeric(par1)
}
par2 <- as.numeric(par2)
par3 <- as.numeric(par3)
par4 <- as.numeric(par4)
par5 <- as.numeric(par5)
if (par6 == 'White Noise') par6 <- 'white' else par6 <- 'ma'
par7 <- as.numeric(par7)
if (par8 != '') par8 <- as.numeric(par8)
x <- na.omit(x)
ox <- x
if (par8 == '') {
if (par2 == 0) {
x <- log(x)
} else {
x <- (x ^ par2 - 1) / par2
}
} else {
x <- log(x,base=par8)
}
if (par3 > 0) x <- diff(x,lag=1,difference=par3)
if (par4 > 0) x <- diff(x,lag=par5,difference=par4)
bitmap(file='picts.png')
op <- par(mfrow=c(2,1))
plot(ox,type='l',main='Original Time Series',xlab='time',ylab='value')
if (par8=='') {
mytitle <- paste('Working Time Series (lambda=',par2,', d=',par3,', D=',par4,')',sep='')
mysub <- paste('(lambda=',par2,', d=',par3,', D=',par4,', CI=', par7, ', CI type=',par6,')',sep='')
} else {
mytitle <- paste('Working Time Series (base=',par8,', d=',par3,', D=',par4,')',sep='')
mysub <- paste('(base=',par8,', d=',par3,', D=',par4,', CI=', par7, ', CI type=',par6,')',sep='')
}
plot(x,type='l', main=mytitle,xlab='time',ylab='value')
par(op)
dev.off()
bitmap(file='pic1.png')
racf <- acf(x, par1, main='Autocorrelation', xlab='time lag', ylab='ACF', ci.type=par6, ci=par7, sub=mysub)
dev.off()
bitmap(file='pic2.png')
rpacf <- pacf(x,par1,main='Partial Autocorrelation',xlab='lags',ylab='PACF',sub=mysub)
dev.off()
(myacf <- c(racf$acf))
(mypacf <- c(rpacf$acf))
lengthx <- length(x)
sqrtn <- sqrt(lengthx)
load(file='createtable')
a<-table.start()
a<-table.row.start(a)
a<-table.element(a,'Autocorrelation Function',4,TRUE)
a<-table.row.end(a)
a<-table.row.start(a)
a<-table.element(a,'Time lag k',header=TRUE)
a<-table.element(a,'ACF(k)',header=TRUE)
a<-table.element(a,'T-STAT',header=TRUE)
a<-table.element(a,'P-value',header=TRUE)
a<-table.row.end(a)
for (i in 2:(par1+1)) {
a<-table.row.start(a)
a<-table.element(a,i-1,header=TRUE)
a<-table.element(a,round(myacf[i],6))
mytstat <- myacf[i]*sqrtn
a<-table.element(a,round(mytstat,4))
a<-table.element(a,round(1-pt(abs(mytstat),lengthx),6))
a<-table.row.end(a)
}
a<-table.end(a)
table.save(a,file='mytable.tab')
a<-table.start()
a<-table.row.start(a)
a<-table.element(a,'Partial Autocorrelation Function',4,TRUE)
a<-table.row.end(a)
a<-table.row.start(a)
a<-table.element(a,'Time lag k',header=TRUE)
a<-table.element(a,'PACF(k)',header=TRUE)
a<-table.element(a,'T-STAT',header=TRUE)
a<-table.element(a,'P-value',header=TRUE)
a<-table.row.end(a)
for (i in 1:par1) {
a<-table.row.start(a)
a<-table.element(a,i,header=TRUE)
a<-table.element(a,round(mypacf[i],6))
mytstat <- mypacf[i]*sqrtn
a<-table.element(a,round(mytstat,4))
a<-table.element(a,round(1-pt(abs(mytstat),lengthx),6))
a<-table.row.end(a)
}
a<-table.end(a)
table.save(a,file='mytable1.tab')