Free Statistics

of Irreproducible Research!

Author's title

Author*Unverified author*
R Software Modulerwasp_exponentialsmoothing.wasp
Title produced by softwareExponential Smoothing
Date of computationTue, 20 Dec 2016 16:21:44 +0000
Cite this page as followsStatistical Computations at FreeStatistics.org, Office for Research Development and Education, URL https://freestatistics.org/blog/index.php?v=date/2016/Dec/20/t1482250924zyihfgw79ucd7e1.htm/, Retrieved Sat, 27 Apr 2024 23:01:26 +0200
Statistical Computations at FreeStatistics.org, Office for Research Development and Education, URL https://freestatistics.org/blog/index.php?pk=, Retrieved Sat, 27 Apr 2024 23:01:26 +0200
QR Codes:

Original text written by user:
IsPrivate?No (this computation is public)
User-defined keywords
Estimated Impact0
Dataseries X:
149
143
135
126
119
133
134
123
147
144
150
140
165
173
167
161
151
163
158
152
176
170
168
164
185
186
184
179
171
187
191
176
204
196
193
179
195
201
192
181
171
177
176
155
173
167
164
152
173
162
158
154
151
160
160
143
170
166
153
144


Summary of computational transaction
Raw Inputview raw input (R code)
Raw Outputview raw output of R engine
Computing time2 seconds
R Server'Gwilym Jenkins' @ jenkins.wessa.net

\begin{tabular}{lllllllll}
\hline
Summary of computational transaction \tabularnewline
Raw Input & view raw input (R code)  \tabularnewline
Raw Output & view raw output of R engine  \tabularnewline
Computing time & 2 seconds \tabularnewline
R Server & 'Gwilym Jenkins' @ jenkins.wessa.net \tabularnewline
\hline
\end{tabular}
%Source: https://freestatistics.org/blog/index.php?pk=&T=0

[TABLE]
[ROW][C]Summary of computational transaction[/C][/ROW]
[ROW][C]Raw Input[/C][C]view raw input (R code) [/C][/ROW]
[ROW][C]Raw Output[/C][C]view raw output of R engine [/C][/ROW]
[ROW][C]Computing time[/C][C]2 seconds[/C][/ROW]
[ROW][C]R Server[/C][C]'Gwilym Jenkins' @ jenkins.wessa.net[/C][/ROW]
[/TABLE]
Source: https://freestatistics.org/blog/index.php?pk=&T=0

Globally Unique Identifier (entire table): ba.freestatistics.org/blog/index.php?pk=&T=0

As an alternative you can also use a QR Code:  

The GUIDs for individual cells are displayed in the table below:

Summary of computational transaction
Raw Inputview raw input (R code)
Raw Outputview raw output of R engine
Computing time2 seconds
R Server'Gwilym Jenkins' @ jenkins.wessa.net


Estimated Parameters of Exponential Smoothing
ParameterValue
alpha0.874062409366971
beta0.104535919024592
gamma1

\begin{tabular}{lllllllll}
\hline
Estimated Parameters of Exponential Smoothing \tabularnewline
Parameter & Value \tabularnewline
alpha & 0.874062409366971 \tabularnewline
beta & 0.104535919024592 \tabularnewline
gamma & 1 \tabularnewline
\hline
\end{tabular}
%Source: https://freestatistics.org/blog/index.php?pk=&T=1

[TABLE]
[ROW][C]Estimated Parameters of Exponential Smoothing[/C][/ROW]
[ROW][C]Parameter[/C][C]Value[/C][/ROW]
[ROW][C]alpha[/C][C]0.874062409366971[/C][/ROW]
[ROW][C]beta[/C][C]0.104535919024592[/C][/ROW]
[ROW][C]gamma[/C][C]1[/C][/ROW]
[/TABLE]
Source: https://freestatistics.org/blog/index.php?pk=&T=1

Globally Unique Identifier (entire table): ba.freestatistics.org/blog/index.php?pk=&T=1

As an alternative you can also use a QR Code:  

The GUIDs for individual cells are displayed in the table below:

Estimated Parameters of Exponential Smoothing
ParameterValue
alpha0.874062409366971
beta0.104535919024592
gamma1


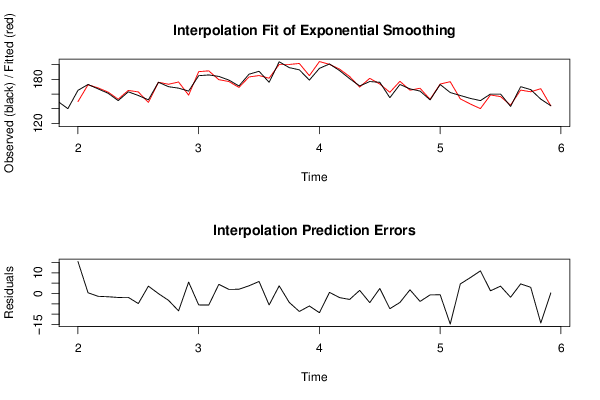
Interpolation Forecasts of Exponential Smoothing
tObservedFittedResiduals
13165149.55795940170915.4420405982906
14173172.6400253875460.359974612453669
15167168.363982316763-1.36398231676347
16161162.581464983391-1.58146498339147
17151152.922687653636-1.92268765363627
18163164.873316013435-1.87331601343536
19158162.862598332247-4.86259833224653
20152148.461427942043.53857205795993
21176176.060060692617-0.0600606926173839
22170173.29944269689-3.2994426968898
23168176.405929556026-8.40592955602571
24164158.4893040471425.51069595285847
25185190.518261825438-5.51826182543761
26186191.600547777861-5.60054777786058
27184179.5731382215684.42686177843231
28179177.0295185819641.97048141803569
29171168.961663716232.03833628377001
30187183.271886733543.72811326645953
31191185.1837073286965.81629267130444
32176181.55331987906-5.55331987905967
33204200.2998765966753.70012340332531
34196200.309513754014-4.30951375401381
35193201.689325247976-8.68932524797589
36179185.051014808082-6.0510148080815
37195204.30234563926-9.30234563925984
38201200.4379782593090.562021740691108
39192193.994181471391-1.99418147139085
40181183.876436669793-2.87643666979326
41171169.4853690248611.51463097513852
42177181.407546570152-4.40754657015239
43176173.5848095180292.41519048197102
44155162.352559564808-7.35255956480839
45173177.330201360827-4.33020136082749
46167165.2167574629871.78324253701294
47164167.831774385888-3.83177438588831
48152152.676706986618-0.676706986617916
49173173.612286895238-0.612286895238213
50162176.776119903521-14.7761199035211
51158153.3926999741854.60730002581508
52154146.3259282940447.67407170595615
53151140.06564891992810.934351080072
54160158.6920984309051.30790156909526
55160156.4631580413783.53684195862209
56143144.822560123293-1.82256012329285
57170165.3610617363344.6389382636664
58166163.023303209142.97669679085985
59153167.249564125411-14.2495641254107
60144143.7093891039030.290610896097007

\begin{tabular}{lllllllll}
\hline
Interpolation Forecasts of Exponential Smoothing \tabularnewline
t & Observed & Fitted & Residuals \tabularnewline
13 & 165 & 149.557959401709 & 15.4420405982906 \tabularnewline
14 & 173 & 172.640025387546 & 0.359974612453669 \tabularnewline
15 & 167 & 168.363982316763 & -1.36398231676347 \tabularnewline
16 & 161 & 162.581464983391 & -1.58146498339147 \tabularnewline
17 & 151 & 152.922687653636 & -1.92268765363627 \tabularnewline
18 & 163 & 164.873316013435 & -1.87331601343536 \tabularnewline
19 & 158 & 162.862598332247 & -4.86259833224653 \tabularnewline
20 & 152 & 148.46142794204 & 3.53857205795993 \tabularnewline
21 & 176 & 176.060060692617 & -0.0600606926173839 \tabularnewline
22 & 170 & 173.29944269689 & -3.2994426968898 \tabularnewline
23 & 168 & 176.405929556026 & -8.40592955602571 \tabularnewline
24 & 164 & 158.489304047142 & 5.51069595285847 \tabularnewline
25 & 185 & 190.518261825438 & -5.51826182543761 \tabularnewline
26 & 186 & 191.600547777861 & -5.60054777786058 \tabularnewline
27 & 184 & 179.573138221568 & 4.42686177843231 \tabularnewline
28 & 179 & 177.029518581964 & 1.97048141803569 \tabularnewline
29 & 171 & 168.96166371623 & 2.03833628377001 \tabularnewline
30 & 187 & 183.27188673354 & 3.72811326645953 \tabularnewline
31 & 191 & 185.183707328696 & 5.81629267130444 \tabularnewline
32 & 176 & 181.55331987906 & -5.55331987905967 \tabularnewline
33 & 204 & 200.299876596675 & 3.70012340332531 \tabularnewline
34 & 196 & 200.309513754014 & -4.30951375401381 \tabularnewline
35 & 193 & 201.689325247976 & -8.68932524797589 \tabularnewline
36 & 179 & 185.051014808082 & -6.0510148080815 \tabularnewline
37 & 195 & 204.30234563926 & -9.30234563925984 \tabularnewline
38 & 201 & 200.437978259309 & 0.562021740691108 \tabularnewline
39 & 192 & 193.994181471391 & -1.99418147139085 \tabularnewline
40 & 181 & 183.876436669793 & -2.87643666979326 \tabularnewline
41 & 171 & 169.485369024861 & 1.51463097513852 \tabularnewline
42 & 177 & 181.407546570152 & -4.40754657015239 \tabularnewline
43 & 176 & 173.584809518029 & 2.41519048197102 \tabularnewline
44 & 155 & 162.352559564808 & -7.35255956480839 \tabularnewline
45 & 173 & 177.330201360827 & -4.33020136082749 \tabularnewline
46 & 167 & 165.216757462987 & 1.78324253701294 \tabularnewline
47 & 164 & 167.831774385888 & -3.83177438588831 \tabularnewline
48 & 152 & 152.676706986618 & -0.676706986617916 \tabularnewline
49 & 173 & 173.612286895238 & -0.612286895238213 \tabularnewline
50 & 162 & 176.776119903521 & -14.7761199035211 \tabularnewline
51 & 158 & 153.392699974185 & 4.60730002581508 \tabularnewline
52 & 154 & 146.325928294044 & 7.67407170595615 \tabularnewline
53 & 151 & 140.065648919928 & 10.934351080072 \tabularnewline
54 & 160 & 158.692098430905 & 1.30790156909526 \tabularnewline
55 & 160 & 156.463158041378 & 3.53684195862209 \tabularnewline
56 & 143 & 144.822560123293 & -1.82256012329285 \tabularnewline
57 & 170 & 165.361061736334 & 4.6389382636664 \tabularnewline
58 & 166 & 163.02330320914 & 2.97669679085985 \tabularnewline
59 & 153 & 167.249564125411 & -14.2495641254107 \tabularnewline
60 & 144 & 143.709389103903 & 0.290610896097007 \tabularnewline
\hline
\end{tabular}
%Source: https://freestatistics.org/blog/index.php?pk=&T=2

[TABLE]
[ROW][C]Interpolation Forecasts of Exponential Smoothing[/C][/ROW]
[ROW][C]t[/C][C]Observed[/C][C]Fitted[/C][C]Residuals[/C][/ROW]
[ROW][C]13[/C][C]165[/C][C]149.557959401709[/C][C]15.4420405982906[/C][/ROW]
[ROW][C]14[/C][C]173[/C][C]172.640025387546[/C][C]0.359974612453669[/C][/ROW]
[ROW][C]15[/C][C]167[/C][C]168.363982316763[/C][C]-1.36398231676347[/C][/ROW]
[ROW][C]16[/C][C]161[/C][C]162.581464983391[/C][C]-1.58146498339147[/C][/ROW]
[ROW][C]17[/C][C]151[/C][C]152.922687653636[/C][C]-1.92268765363627[/C][/ROW]
[ROW][C]18[/C][C]163[/C][C]164.873316013435[/C][C]-1.87331601343536[/C][/ROW]
[ROW][C]19[/C][C]158[/C][C]162.862598332247[/C][C]-4.86259833224653[/C][/ROW]
[ROW][C]20[/C][C]152[/C][C]148.46142794204[/C][C]3.53857205795993[/C][/ROW]
[ROW][C]21[/C][C]176[/C][C]176.060060692617[/C][C]-0.0600606926173839[/C][/ROW]
[ROW][C]22[/C][C]170[/C][C]173.29944269689[/C][C]-3.2994426968898[/C][/ROW]
[ROW][C]23[/C][C]168[/C][C]176.405929556026[/C][C]-8.40592955602571[/C][/ROW]
[ROW][C]24[/C][C]164[/C][C]158.489304047142[/C][C]5.51069595285847[/C][/ROW]
[ROW][C]25[/C][C]185[/C][C]190.518261825438[/C][C]-5.51826182543761[/C][/ROW]
[ROW][C]26[/C][C]186[/C][C]191.600547777861[/C][C]-5.60054777786058[/C][/ROW]
[ROW][C]27[/C][C]184[/C][C]179.573138221568[/C][C]4.42686177843231[/C][/ROW]
[ROW][C]28[/C][C]179[/C][C]177.029518581964[/C][C]1.97048141803569[/C][/ROW]
[ROW][C]29[/C][C]171[/C][C]168.96166371623[/C][C]2.03833628377001[/C][/ROW]
[ROW][C]30[/C][C]187[/C][C]183.27188673354[/C][C]3.72811326645953[/C][/ROW]
[ROW][C]31[/C][C]191[/C][C]185.183707328696[/C][C]5.81629267130444[/C][/ROW]
[ROW][C]32[/C][C]176[/C][C]181.55331987906[/C][C]-5.55331987905967[/C][/ROW]
[ROW][C]33[/C][C]204[/C][C]200.299876596675[/C][C]3.70012340332531[/C][/ROW]
[ROW][C]34[/C][C]196[/C][C]200.309513754014[/C][C]-4.30951375401381[/C][/ROW]
[ROW][C]35[/C][C]193[/C][C]201.689325247976[/C][C]-8.68932524797589[/C][/ROW]
[ROW][C]36[/C][C]179[/C][C]185.051014808082[/C][C]-6.0510148080815[/C][/ROW]
[ROW][C]37[/C][C]195[/C][C]204.30234563926[/C][C]-9.30234563925984[/C][/ROW]
[ROW][C]38[/C][C]201[/C][C]200.437978259309[/C][C]0.562021740691108[/C][/ROW]
[ROW][C]39[/C][C]192[/C][C]193.994181471391[/C][C]-1.99418147139085[/C][/ROW]
[ROW][C]40[/C][C]181[/C][C]183.876436669793[/C][C]-2.87643666979326[/C][/ROW]
[ROW][C]41[/C][C]171[/C][C]169.485369024861[/C][C]1.51463097513852[/C][/ROW]
[ROW][C]42[/C][C]177[/C][C]181.407546570152[/C][C]-4.40754657015239[/C][/ROW]
[ROW][C]43[/C][C]176[/C][C]173.584809518029[/C][C]2.41519048197102[/C][/ROW]
[ROW][C]44[/C][C]155[/C][C]162.352559564808[/C][C]-7.35255956480839[/C][/ROW]
[ROW][C]45[/C][C]173[/C][C]177.330201360827[/C][C]-4.33020136082749[/C][/ROW]
[ROW][C]46[/C][C]167[/C][C]165.216757462987[/C][C]1.78324253701294[/C][/ROW]
[ROW][C]47[/C][C]164[/C][C]167.831774385888[/C][C]-3.83177438588831[/C][/ROW]
[ROW][C]48[/C][C]152[/C][C]152.676706986618[/C][C]-0.676706986617916[/C][/ROW]
[ROW][C]49[/C][C]173[/C][C]173.612286895238[/C][C]-0.612286895238213[/C][/ROW]
[ROW][C]50[/C][C]162[/C][C]176.776119903521[/C][C]-14.7761199035211[/C][/ROW]
[ROW][C]51[/C][C]158[/C][C]153.392699974185[/C][C]4.60730002581508[/C][/ROW]
[ROW][C]52[/C][C]154[/C][C]146.325928294044[/C][C]7.67407170595615[/C][/ROW]
[ROW][C]53[/C][C]151[/C][C]140.065648919928[/C][C]10.934351080072[/C][/ROW]
[ROW][C]54[/C][C]160[/C][C]158.692098430905[/C][C]1.30790156909526[/C][/ROW]
[ROW][C]55[/C][C]160[/C][C]156.463158041378[/C][C]3.53684195862209[/C][/ROW]
[ROW][C]56[/C][C]143[/C][C]144.822560123293[/C][C]-1.82256012329285[/C][/ROW]
[ROW][C]57[/C][C]170[/C][C]165.361061736334[/C][C]4.6389382636664[/C][/ROW]
[ROW][C]58[/C][C]166[/C][C]163.02330320914[/C][C]2.97669679085985[/C][/ROW]
[ROW][C]59[/C][C]153[/C][C]167.249564125411[/C][C]-14.2495641254107[/C][/ROW]
[ROW][C]60[/C][C]144[/C][C]143.709389103903[/C][C]0.290610896097007[/C][/ROW]
[/TABLE]
Source: https://freestatistics.org/blog/index.php?pk=&T=2

Globally Unique Identifier (entire table): ba.freestatistics.org/blog/index.php?pk=&T=2

As an alternative you can also use a QR Code:  

The GUIDs for individual cells are displayed in the table below:

Interpolation Forecasts of Exponential Smoothing
tObservedFittedResiduals
13165149.55795940170915.4420405982906
14173172.6400253875460.359974612453669
15167168.363982316763-1.36398231676347
16161162.581464983391-1.58146498339147
17151152.922687653636-1.92268765363627
18163164.873316013435-1.87331601343536
19158162.862598332247-4.86259833224653
20152148.461427942043.53857205795993
21176176.060060692617-0.0600606926173839
22170173.29944269689-3.2994426968898
23168176.405929556026-8.40592955602571
24164158.4893040471425.51069595285847
25185190.518261825438-5.51826182543761
26186191.600547777861-5.60054777786058
27184179.5731382215684.42686177843231
28179177.0295185819641.97048141803569
29171168.961663716232.03833628377001
30187183.271886733543.72811326645953
31191185.1837073286965.81629267130444
32176181.55331987906-5.55331987905967
33204200.2998765966753.70012340332531
34196200.309513754014-4.30951375401381
35193201.689325247976-8.68932524797589
36179185.051014808082-6.0510148080815
37195204.30234563926-9.30234563925984
38201200.4379782593090.562021740691108
39192193.994181471391-1.99418147139085
40181183.876436669793-2.87643666979326
41171169.4853690248611.51463097513852
42177181.407546570152-4.40754657015239
43176173.5848095180292.41519048197102
44155162.352559564808-7.35255956480839
45173177.330201360827-4.33020136082749
46167165.2167574629871.78324253701294
47164167.831774385888-3.83177438588831
48152152.676706986618-0.676706986617916
49173173.612286895238-0.612286895238213
50162176.776119903521-14.7761199035211
51158153.3926999741854.60730002581508
52154146.3259282940447.67407170595615
53151140.06564891992810.934351080072
54160158.6920984309051.30790156909526
55160156.4631580413783.53684195862209
56143144.822560123293-1.82256012329285
57170165.3610617363344.6389382636664
58166163.023303209142.97669679085985
59153167.249564125411-14.2495641254107
60144143.7093891039030.290610896097007


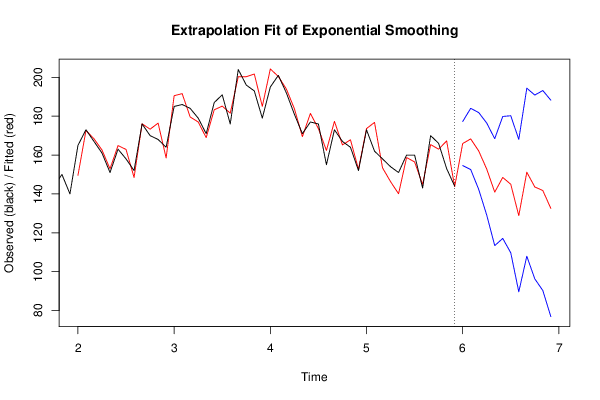
Extrapolation Forecasts of Exponential Smoothing
tForecast95% Lower Bound95% Upper Bound
61165.910312036243154.582293908862177.238330163624
62168.29324212888152.547453780263184.039030477497
63162.083961125261142.304006467522181.863915783
64152.773157048524129.100030424598176.446283672451
65140.911478356038113.387244175592168.435712536484
66148.464835629067117.081896023371179.847775234764
67144.950455728853109.673326024091180.227585433615
68128.79736323120389.5738106666367168.02091579577
69151.163046875532107.930360770447194.395732980617
70143.55776926232496.2465363544522190.869002170195
71141.73733525382590.273828058712193.200842448937
72132.50987657793276.8176217181563188.202131437708

\begin{tabular}{lllllllll}
\hline
Extrapolation Forecasts of Exponential Smoothing \tabularnewline
t & Forecast & 95% Lower Bound & 95% Upper Bound \tabularnewline
61 & 165.910312036243 & 154.582293908862 & 177.238330163624 \tabularnewline
62 & 168.29324212888 & 152.547453780263 & 184.039030477497 \tabularnewline
63 & 162.083961125261 & 142.304006467522 & 181.863915783 \tabularnewline
64 & 152.773157048524 & 129.100030424598 & 176.446283672451 \tabularnewline
65 & 140.911478356038 & 113.387244175592 & 168.435712536484 \tabularnewline
66 & 148.464835629067 & 117.081896023371 & 179.847775234764 \tabularnewline
67 & 144.950455728853 & 109.673326024091 & 180.227585433615 \tabularnewline
68 & 128.797363231203 & 89.5738106666367 & 168.02091579577 \tabularnewline
69 & 151.163046875532 & 107.930360770447 & 194.395732980617 \tabularnewline
70 & 143.557769262324 & 96.2465363544522 & 190.869002170195 \tabularnewline
71 & 141.737335253825 & 90.273828058712 & 193.200842448937 \tabularnewline
72 & 132.509876577932 & 76.8176217181563 & 188.202131437708 \tabularnewline
\hline
\end{tabular}
%Source: https://freestatistics.org/blog/index.php?pk=&T=3

[TABLE]
[ROW][C]Extrapolation Forecasts of Exponential Smoothing[/C][/ROW]
[ROW][C]t[/C][C]Forecast[/C][C]95% Lower Bound[/C][C]95% Upper Bound[/C][/ROW]
[ROW][C]61[/C][C]165.910312036243[/C][C]154.582293908862[/C][C]177.238330163624[/C][/ROW]
[ROW][C]62[/C][C]168.29324212888[/C][C]152.547453780263[/C][C]184.039030477497[/C][/ROW]
[ROW][C]63[/C][C]162.083961125261[/C][C]142.304006467522[/C][C]181.863915783[/C][/ROW]
[ROW][C]64[/C][C]152.773157048524[/C][C]129.100030424598[/C][C]176.446283672451[/C][/ROW]
[ROW][C]65[/C][C]140.911478356038[/C][C]113.387244175592[/C][C]168.435712536484[/C][/ROW]
[ROW][C]66[/C][C]148.464835629067[/C][C]117.081896023371[/C][C]179.847775234764[/C][/ROW]
[ROW][C]67[/C][C]144.950455728853[/C][C]109.673326024091[/C][C]180.227585433615[/C][/ROW]
[ROW][C]68[/C][C]128.797363231203[/C][C]89.5738106666367[/C][C]168.02091579577[/C][/ROW]
[ROW][C]69[/C][C]151.163046875532[/C][C]107.930360770447[/C][C]194.395732980617[/C][/ROW]
[ROW][C]70[/C][C]143.557769262324[/C][C]96.2465363544522[/C][C]190.869002170195[/C][/ROW]
[ROW][C]71[/C][C]141.737335253825[/C][C]90.273828058712[/C][C]193.200842448937[/C][/ROW]
[ROW][C]72[/C][C]132.509876577932[/C][C]76.8176217181563[/C][C]188.202131437708[/C][/ROW]
[/TABLE]
Source: https://freestatistics.org/blog/index.php?pk=&T=3

Globally Unique Identifier (entire table): ba.freestatistics.org/blog/index.php?pk=&T=3

As an alternative you can also use a QR Code:  

The GUIDs for individual cells are displayed in the table below:

Extrapolation Forecasts of Exponential Smoothing
tForecast95% Lower Bound95% Upper Bound
61165.910312036243154.582293908862177.238330163624
62168.29324212888152.547453780263184.039030477497
63162.083961125261142.304006467522181.863915783
64152.773157048524129.100030424598176.446283672451
65140.911478356038113.387244175592168.435712536484
66148.464835629067117.081896023371179.847775234764
67144.950455728853109.673326024091180.227585433615
68128.79736323120389.5738106666367168.02091579577
69151.163046875532107.930360770447194.395732980617
70143.55776926232496.2465363544522190.869002170195
71141.73733525382590.273828058712193.200842448937
72132.50987657793276.8176217181563188.202131437708


Parameters (Session):
par1 = 12 ; par2 = Triple ; par3 = additive ;
Parameters (R input):
par1 = 12 ; par2 = Triple ; par3 = additive ;
R code (references can be found in the software module):
par1 <- as.numeric(par1)
if (par2 == 'Single') K <- 1
if (par2 == 'Double') K <- 2
if (par2 == 'Triple') K <- par1
nx <- length(x)
nxmK <- nx - K
x <- ts(x, frequency = par1)
if (par2 == 'Single') fit <- HoltWinters(x, gamma=F, beta=F)
if (par2 == 'Double') fit <- HoltWinters(x, gamma=F)
if (par2 == 'Triple') fit <- HoltWinters(x, seasonal=par3)
fit
myresid <- x - fit$fitted[,'xhat']
bitmap(file='test1.png')
op <- par(mfrow=c(2,1))
plot(fit,ylab='Observed (black) / Fitted (red)',main='Interpolation Fit of Exponential Smoothing')
plot(myresid,ylab='Residuals',main='Interpolation Prediction Errors')
par(op)
dev.off()
bitmap(file='test2.png')
p <- predict(fit, par1, prediction.interval=TRUE)
np <- length(p[,1])
plot(fit,p,ylab='Observed (black) / Fitted (red)',main='Extrapolation Fit of Exponential Smoothing')
dev.off()
bitmap(file='test3.png')
op <- par(mfrow = c(2,2))
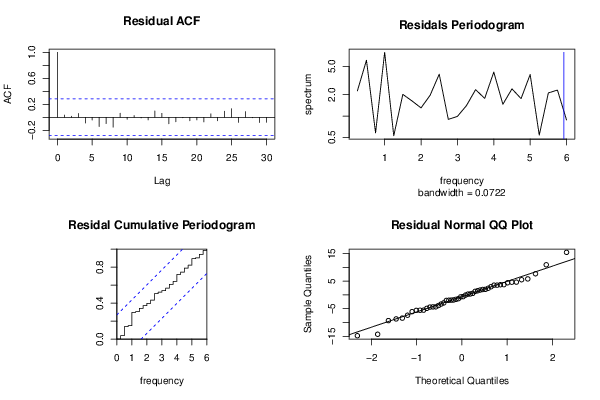
acf(as.numeric(myresid),lag.max = nx/2,main='Residual ACF')
spectrum(myresid,main='Residals Periodogram')
cpgram(myresid,main='Residal Cumulative Periodogram')
qqnorm(myresid,main='Residual Normal QQ Plot')
qqline(myresid)
par(op)
dev.off()
load(file='createtable')
a<-table.start()
a<-table.row.start(a)
a<-table.element(a,'Estimated Parameters of Exponential Smoothing',2,TRUE)
a<-table.row.end(a)
a<-table.row.start(a)
a<-table.element(a,'Parameter',header=TRUE)
a<-table.element(a,'Value',header=TRUE)
a<-table.row.end(a)
a<-table.row.start(a)
a<-table.element(a,'alpha',header=TRUE)
a<-table.element(a,fit$alpha)
a<-table.row.end(a)
a<-table.row.start(a)
a<-table.element(a,'beta',header=TRUE)
a<-table.element(a,fit$beta)
a<-table.row.end(a)
a<-table.row.start(a)
a<-table.element(a,'gamma',header=TRUE)
a<-table.element(a,fit$gamma)
a<-table.row.end(a)
a<-table.end(a)
table.save(a,file='mytable.tab')
a<-table.start()
a<-table.row.start(a)
a<-table.element(a,'Interpolation Forecasts of Exponential Smoothing',4,TRUE)
a<-table.row.end(a)
a<-table.row.start(a)
a<-table.element(a,'t',header=TRUE)
a<-table.element(a,'Observed',header=TRUE)
a<-table.element(a,'Fitted',header=TRUE)
a<-table.element(a,'Residuals',header=TRUE)
a<-table.row.end(a)
for (i in 1:nxmK) {
a<-table.row.start(a)
a<-table.element(a,i+K,header=TRUE)
a<-table.element(a,x[i+K])
a<-table.element(a,fit$fitted[i,'xhat'])
a<-table.element(a,myresid[i])
a<-table.row.end(a)
}
a<-table.end(a)
table.save(a,file='mytable1.tab')
a<-table.start()
a<-table.row.start(a)
a<-table.element(a,'Extrapolation Forecasts of Exponential Smoothing',4,TRUE)
a<-table.row.end(a)
a<-table.row.start(a)
a<-table.element(a,'t',header=TRUE)
a<-table.element(a,'Forecast',header=TRUE)
a<-table.element(a,'95% Lower Bound',header=TRUE)
a<-table.element(a,'95% Upper Bound',header=TRUE)
a<-table.row.end(a)
for (i in 1:np) {
a<-table.row.start(a)
a<-table.element(a,nx+i,header=TRUE)
a<-table.element(a,p[i,'fit'])
a<-table.element(a,p[i,'lwr'])
a<-table.element(a,p[i,'upr'])
a<-table.row.end(a)
}
a<-table.end(a)
table.save(a,file='mytable2.tab')