Free Statistics

of Irreproducible Research!

Author's title

Author*The author of this computation has been verified*
R Software Modulerwasp_exponentialsmoothing.wasp
Title produced by softwareExponential Smoothing
Date of computationTue, 20 Dec 2016 20:47:16 +0100
Cite this page as followsStatistical Computations at FreeStatistics.org, Office for Research Development and Education, URL https://freestatistics.org/blog/index.php?v=date/2016/Dec/20/t14822632806o4so2g5n9gwwvn.htm/, Retrieved Sat, 27 Apr 2024 18:01:38 +0000
Statistical Computations at FreeStatistics.org, Office for Research Development and Education, URL https://freestatistics.org/blog/index.php?pk=301793, Retrieved Sat, 27 Apr 2024 18:01:38 +0000
QR Codes:

Original text written by user:
IsPrivate?No (this computation is public)
User-defined keywords
Estimated Impact49
Family? (F = Feedback message, R = changed R code, M = changed R Module, P = changed Parameters, D = changed Data)
-       [Exponential Smoothing] [] [2016-12-20 19:47:16] [672675941468e072e71d9fb024f2b817] [Current]
Feedback Forum

Post a new message
Dataseries X:
1932.8
1861.4
2170.2
1999.6
2225.5
2195.7
2713.1
2412
2568.3
2623.7
3185.5
2722.6
3046.3
2854.2
3337.6
2920.3
3058.3
2933.7
3773.4
3193.5
3472.2
3345.5
4028.4
3463.1
3675.4
3500.8
4142.1
3598
3765.3
3557.7
4303.6
3620.1
3691.1
3678.1
4505.8
3695
3894.1
3718.9
4749.8
3855.9
4011.7
3907.6
4812.5
4071.3
4163.4
4077.6
5109.2
4207.6
4320.8
4396.9
5358.8


Summary of computational transaction
Raw Input view raw input (R code)
Raw Outputview raw output of R engine
Computing time1 seconds
R ServerBig Analytics Cloud Computing Center

\begin{tabular}{lllllllll}
\hline
Summary of computational transaction \tabularnewline
Raw Input view raw input (R code)  \tabularnewline
Raw Outputview raw output of R engine  \tabularnewline
Computing time1 seconds \tabularnewline
R ServerBig Analytics Cloud Computing Center \tabularnewline
\hline
\end{tabular}
%Source: https://freestatistics.org/blog/index.php?pk=301793&T=0

[TABLE]
[ROW]
Summary of computational transaction[/C][/ROW] [ROW]Raw Input[/C] view raw input (R code) [/C][/ROW] [ROW]Raw Output[/C]view raw output of R engine [/C][/ROW] [ROW]Computing time[/C]1 seconds[/C][/ROW] [ROW]R Server[/C]Big Analytics Cloud Computing Center[/C][/ROW] [/TABLE] Source: https://freestatistics.org/blog/index.php?pk=301793&T=0

Globally Unique Identifier (entire table): ba.freestatistics.org/blog/index.php?pk=301793&T=0

As an alternative you can also use a QR Code:  

The GUIDs for individual cells are displayed in the table below:

Summary of computational transaction
Raw Input view raw input (R code)
Raw Outputview raw output of R engine
Computing time1 seconds
R ServerBig Analytics Cloud Computing Center


Estimated Parameters of Exponential Smoothing
ParameterValue
alpha0.416602346657151
beta0.204423070254419
gamma0.904356657313918

\begin{tabular}{lllllllll}
\hline
Estimated Parameters of Exponential Smoothing \tabularnewline
Parameter & Value \tabularnewline
alpha & 0.416602346657151 \tabularnewline
beta & 0.204423070254419 \tabularnewline
gamma & 0.904356657313918 \tabularnewline
\hline
\end{tabular}
%Source: https://freestatistics.org/blog/index.php?pk=301793&T=1

[TABLE]
[ROW][C]Estimated Parameters of Exponential Smoothing[/C][/ROW]
[ROW][C]Parameter[/C][C]Value[/C][/ROW]
[ROW][C]alpha[/C][C]0.416602346657151[/C][/ROW]
[ROW][C]beta[/C][C]0.204423070254419[/C][/ROW]
[ROW][C]gamma[/C][C]0.904356657313918[/C][/ROW]
[/TABLE]
Source: https://freestatistics.org/blog/index.php?pk=301793&T=1

Globally Unique Identifier (entire table): ba.freestatistics.org/blog/index.php?pk=301793&T=1

As an alternative you can also use a QR Code:  

The GUIDs for individual cells are displayed in the table below:

Estimated Parameters of Exponential Smoothing
ParameterValue
alpha0.416602346657151
beta0.204423070254419
gamma0.904356657313918


Interpolation Forecasts of Exponential Smoothing
tObservedFittedResiduals
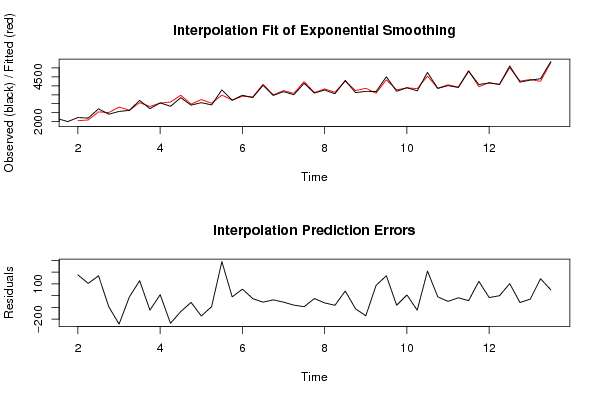
52225.52049.436875176.063125000001
62195.72091.7630229745103.9369770255
72713.12544.04284681466169.057153185337
824122506.93682530356-94.9368253035641
92568.32809.88100139577-241.581001395773
102623.72634.75202604016-11.0520260401645
113185.53058.28183673166127.218163268336
122722.62845.69664939941-123.096649399413
133046.33038.37595660187.92404339820041
142854.23088.90296468267-234.702964682674
153337.63473.24835748439-135.648357484393
162920.32977.73764002025-57.4376400202545
173058.33231.14009239935-172.840092399349
182933.73027.19898590563-93.4989859056263
193773.43483.50537615679289.894623843208
203193.53203.65529754302-10.1552975430154
213472.23417.0106096901655.1893903098357
223345.53370.48836474443-24.9883647444349
234028.44084.0102278754-55.6102278753956
243463.13498.88702910259-35.7870291025852
253675.43730.82826708882-55.4282670888206
263500.83581.28849018675-80.4884901867472
274142.14236.17401643599-94.0740164359868
2835983622.85095409337-24.8509540933733
293765.33827.28235884308-61.9823588430827
303557.73639.5290830988-81.8290830987999
314303.64264.3129421811239.2870578188795
323620.13732.05246413435-111.952464134352
333691.13862.17081676635-171.07081676635
343678.13590.7737498914387.3262501085674
354505.84336.60857640127169.191423598733
3636953776.41535751152-81.4153575115206
373894.13888.408059192225.69194080778107
383718.93842.3779535115-123.477953511496
394749.84541.02754192979208.772458070211
403855.93865.91895333346-10.018953333461
414011.74060.50878119021-48.8087811902105
423907.63925.87756149733-18.2775614973339
434812.54854.86223602885-42.3622360288527
444071.33949.52186492398121.778135076016
454163.44179.60319692914-16.2031969291384
464077.64078.49061523245-0.890615232451637
475109.25007.31921293022101.880787069783
484207.64266.26294141764-58.6629414176441
494320.84350.59801309919-29.7980130991882
504396.94252.96773769487143.932262305133
515358.85309.7526288354849.04737116452

\begin{tabular}{lllllllll}
\hline
Interpolation Forecasts of Exponential Smoothing \tabularnewline
t & Observed & Fitted & Residuals \tabularnewline
5 & 2225.5 & 2049.436875 & 176.063125000001 \tabularnewline
6 & 2195.7 & 2091.7630229745 & 103.9369770255 \tabularnewline
7 & 2713.1 & 2544.04284681466 & 169.057153185337 \tabularnewline
8 & 2412 & 2506.93682530356 & -94.9368253035641 \tabularnewline
9 & 2568.3 & 2809.88100139577 & -241.581001395773 \tabularnewline
10 & 2623.7 & 2634.75202604016 & -11.0520260401645 \tabularnewline
11 & 3185.5 & 3058.28183673166 & 127.218163268336 \tabularnewline
12 & 2722.6 & 2845.69664939941 & -123.096649399413 \tabularnewline
13 & 3046.3 & 3038.3759566018 & 7.92404339820041 \tabularnewline
14 & 2854.2 & 3088.90296468267 & -234.702964682674 \tabularnewline
15 & 3337.6 & 3473.24835748439 & -135.648357484393 \tabularnewline
16 & 2920.3 & 2977.73764002025 & -57.4376400202545 \tabularnewline
17 & 3058.3 & 3231.14009239935 & -172.840092399349 \tabularnewline
18 & 2933.7 & 3027.19898590563 & -93.4989859056263 \tabularnewline
19 & 3773.4 & 3483.50537615679 & 289.894623843208 \tabularnewline
20 & 3193.5 & 3203.65529754302 & -10.1552975430154 \tabularnewline
21 & 3472.2 & 3417.01060969016 & 55.1893903098357 \tabularnewline
22 & 3345.5 & 3370.48836474443 & -24.9883647444349 \tabularnewline
23 & 4028.4 & 4084.0102278754 & -55.6102278753956 \tabularnewline
24 & 3463.1 & 3498.88702910259 & -35.7870291025852 \tabularnewline
25 & 3675.4 & 3730.82826708882 & -55.4282670888206 \tabularnewline
26 & 3500.8 & 3581.28849018675 & -80.4884901867472 \tabularnewline
27 & 4142.1 & 4236.17401643599 & -94.0740164359868 \tabularnewline
28 & 3598 & 3622.85095409337 & -24.8509540933733 \tabularnewline
29 & 3765.3 & 3827.28235884308 & -61.9823588430827 \tabularnewline
30 & 3557.7 & 3639.5290830988 & -81.8290830987999 \tabularnewline
31 & 4303.6 & 4264.31294218112 & 39.2870578188795 \tabularnewline
32 & 3620.1 & 3732.05246413435 & -111.952464134352 \tabularnewline
33 & 3691.1 & 3862.17081676635 & -171.07081676635 \tabularnewline
34 & 3678.1 & 3590.77374989143 & 87.3262501085674 \tabularnewline
35 & 4505.8 & 4336.60857640127 & 169.191423598733 \tabularnewline
36 & 3695 & 3776.41535751152 & -81.4153575115206 \tabularnewline
37 & 3894.1 & 3888.40805919222 & 5.69194080778107 \tabularnewline
38 & 3718.9 & 3842.3779535115 & -123.477953511496 \tabularnewline
39 & 4749.8 & 4541.02754192979 & 208.772458070211 \tabularnewline
40 & 3855.9 & 3865.91895333346 & -10.018953333461 \tabularnewline
41 & 4011.7 & 4060.50878119021 & -48.8087811902105 \tabularnewline
42 & 3907.6 & 3925.87756149733 & -18.2775614973339 \tabularnewline
43 & 4812.5 & 4854.86223602885 & -42.3622360288527 \tabularnewline
44 & 4071.3 & 3949.52186492398 & 121.778135076016 \tabularnewline
45 & 4163.4 & 4179.60319692914 & -16.2031969291384 \tabularnewline
46 & 4077.6 & 4078.49061523245 & -0.890615232451637 \tabularnewline
47 & 5109.2 & 5007.31921293022 & 101.880787069783 \tabularnewline
48 & 4207.6 & 4266.26294141764 & -58.6629414176441 \tabularnewline
49 & 4320.8 & 4350.59801309919 & -29.7980130991882 \tabularnewline
50 & 4396.9 & 4252.96773769487 & 143.932262305133 \tabularnewline
51 & 5358.8 & 5309.75262883548 & 49.04737116452 \tabularnewline
\hline
\end{tabular}
%Source: https://freestatistics.org/blog/index.php?pk=301793&T=2

[TABLE]
[ROW][C]Interpolation Forecasts of Exponential Smoothing[/C][/ROW]
[ROW][C]t[/C][C]Observed[/C][C]Fitted[/C][C]Residuals[/C][/ROW]
[ROW][C]5[/C][C]2225.5[/C][C]2049.436875[/C][C]176.063125000001[/C][/ROW]
[ROW][C]6[/C][C]2195.7[/C][C]2091.7630229745[/C][C]103.9369770255[/C][/ROW]
[ROW][C]7[/C][C]2713.1[/C][C]2544.04284681466[/C][C]169.057153185337[/C][/ROW]
[ROW][C]8[/C][C]2412[/C][C]2506.93682530356[/C][C]-94.9368253035641[/C][/ROW]
[ROW][C]9[/C][C]2568.3[/C][C]2809.88100139577[/C][C]-241.581001395773[/C][/ROW]
[ROW][C]10[/C][C]2623.7[/C][C]2634.75202604016[/C][C]-11.0520260401645[/C][/ROW]
[ROW][C]11[/C][C]3185.5[/C][C]3058.28183673166[/C][C]127.218163268336[/C][/ROW]
[ROW][C]12[/C][C]2722.6[/C][C]2845.69664939941[/C][C]-123.096649399413[/C][/ROW]
[ROW][C]13[/C][C]3046.3[/C][C]3038.3759566018[/C][C]7.92404339820041[/C][/ROW]
[ROW][C]14[/C][C]2854.2[/C][C]3088.90296468267[/C][C]-234.702964682674[/C][/ROW]
[ROW][C]15[/C][C]3337.6[/C][C]3473.24835748439[/C][C]-135.648357484393[/C][/ROW]
[ROW][C]16[/C][C]2920.3[/C][C]2977.73764002025[/C][C]-57.4376400202545[/C][/ROW]
[ROW][C]17[/C][C]3058.3[/C][C]3231.14009239935[/C][C]-172.840092399349[/C][/ROW]
[ROW][C]18[/C][C]2933.7[/C][C]3027.19898590563[/C][C]-93.4989859056263[/C][/ROW]
[ROW][C]19[/C][C]3773.4[/C][C]3483.50537615679[/C][C]289.894623843208[/C][/ROW]
[ROW][C]20[/C][C]3193.5[/C][C]3203.65529754302[/C][C]-10.1552975430154[/C][/ROW]
[ROW][C]21[/C][C]3472.2[/C][C]3417.01060969016[/C][C]55.1893903098357[/C][/ROW]
[ROW][C]22[/C][C]3345.5[/C][C]3370.48836474443[/C][C]-24.9883647444349[/C][/ROW]
[ROW][C]23[/C][C]4028.4[/C][C]4084.0102278754[/C][C]-55.6102278753956[/C][/ROW]
[ROW][C]24[/C][C]3463.1[/C][C]3498.88702910259[/C][C]-35.7870291025852[/C][/ROW]
[ROW][C]25[/C][C]3675.4[/C][C]3730.82826708882[/C][C]-55.4282670888206[/C][/ROW]
[ROW][C]26[/C][C]3500.8[/C][C]3581.28849018675[/C][C]-80.4884901867472[/C][/ROW]
[ROW][C]27[/C][C]4142.1[/C][C]4236.17401643599[/C][C]-94.0740164359868[/C][/ROW]
[ROW][C]28[/C][C]3598[/C][C]3622.85095409337[/C][C]-24.8509540933733[/C][/ROW]
[ROW][C]29[/C][C]3765.3[/C][C]3827.28235884308[/C][C]-61.9823588430827[/C][/ROW]
[ROW][C]30[/C][C]3557.7[/C][C]3639.5290830988[/C][C]-81.8290830987999[/C][/ROW]
[ROW][C]31[/C][C]4303.6[/C][C]4264.31294218112[/C][C]39.2870578188795[/C][/ROW]
[ROW][C]32[/C][C]3620.1[/C][C]3732.05246413435[/C][C]-111.952464134352[/C][/ROW]
[ROW][C]33[/C][C]3691.1[/C][C]3862.17081676635[/C][C]-171.07081676635[/C][/ROW]
[ROW][C]34[/C][C]3678.1[/C][C]3590.77374989143[/C][C]87.3262501085674[/C][/ROW]
[ROW][C]35[/C][C]4505.8[/C][C]4336.60857640127[/C][C]169.191423598733[/C][/ROW]
[ROW][C]36[/C][C]3695[/C][C]3776.41535751152[/C][C]-81.4153575115206[/C][/ROW]
[ROW][C]37[/C][C]3894.1[/C][C]3888.40805919222[/C][C]5.69194080778107[/C][/ROW]
[ROW][C]38[/C][C]3718.9[/C][C]3842.3779535115[/C][C]-123.477953511496[/C][/ROW]
[ROW][C]39[/C][C]4749.8[/C][C]4541.02754192979[/C][C]208.772458070211[/C][/ROW]
[ROW][C]40[/C][C]3855.9[/C][C]3865.91895333346[/C][C]-10.018953333461[/C][/ROW]
[ROW][C]41[/C][C]4011.7[/C][C]4060.50878119021[/C][C]-48.8087811902105[/C][/ROW]
[ROW][C]42[/C][C]3907.6[/C][C]3925.87756149733[/C][C]-18.2775614973339[/C][/ROW]
[ROW][C]43[/C][C]4812.5[/C][C]4854.86223602885[/C][C]-42.3622360288527[/C][/ROW]
[ROW][C]44[/C][C]4071.3[/C][C]3949.52186492398[/C][C]121.778135076016[/C][/ROW]
[ROW][C]45[/C][C]4163.4[/C][C]4179.60319692914[/C][C]-16.2031969291384[/C][/ROW]
[ROW][C]46[/C][C]4077.6[/C][C]4078.49061523245[/C][C]-0.890615232451637[/C][/ROW]
[ROW][C]47[/C][C]5109.2[/C][C]5007.31921293022[/C][C]101.880787069783[/C][/ROW]
[ROW][C]48[/C][C]4207.6[/C][C]4266.26294141764[/C][C]-58.6629414176441[/C][/ROW]
[ROW][C]49[/C][C]4320.8[/C][C]4350.59801309919[/C][C]-29.7980130991882[/C][/ROW]
[ROW][C]50[/C][C]4396.9[/C][C]4252.96773769487[/C][C]143.932262305133[/C][/ROW]
[ROW][C]51[/C][C]5358.8[/C][C]5309.75262883548[/C][C]49.04737116452[/C][/ROW]
[/TABLE]
Source: https://freestatistics.org/blog/index.php?pk=301793&T=2

Globally Unique Identifier (entire table): ba.freestatistics.org/blog/index.php?pk=301793&T=2

As an alternative you can also use a QR Code:  

The GUIDs for individual cells are displayed in the table below:

Interpolation Forecasts of Exponential Smoothing
tObservedFittedResiduals
52225.52049.436875176.063125000001
62195.72091.7630229745103.9369770255
72713.12544.04284681466169.057153185337
824122506.93682530356-94.9368253035641
92568.32809.88100139577-241.581001395773
102623.72634.75202604016-11.0520260401645
113185.53058.28183673166127.218163268336
122722.62845.69664939941-123.096649399413
133046.33038.37595660187.92404339820041
142854.23088.90296468267-234.702964682674
153337.63473.24835748439-135.648357484393
162920.32977.73764002025-57.4376400202545
173058.33231.14009239935-172.840092399349
182933.73027.19898590563-93.4989859056263
193773.43483.50537615679289.894623843208
203193.53203.65529754302-10.1552975430154
213472.23417.0106096901655.1893903098357
223345.53370.48836474443-24.9883647444349
234028.44084.0102278754-55.6102278753956
243463.13498.88702910259-35.7870291025852
253675.43730.82826708882-55.4282670888206
263500.83581.28849018675-80.4884901867472
274142.14236.17401643599-94.0740164359868
2835983622.85095409337-24.8509540933733
293765.33827.28235884308-61.9823588430827
303557.73639.5290830988-81.8290830987999
314303.64264.3129421811239.2870578188795
323620.13732.05246413435-111.952464134352
333691.13862.17081676635-171.07081676635
343678.13590.7737498914387.3262501085674
354505.84336.60857640127169.191423598733
3636953776.41535751152-81.4153575115206
373894.13888.408059192225.69194080778107
383718.93842.3779535115-123.477953511496
394749.84541.02754192979208.772458070211
403855.93865.91895333346-10.018953333461
414011.74060.50878119021-48.8087811902105
423907.63925.87756149733-18.2775614973339
434812.54854.86223602885-42.3622360288527
444071.33949.52186492398121.778135076016
454163.44179.60319692914-16.2031969291384
464077.64078.49061523245-0.890615232451637
475109.25007.31921293022101.880787069783
484207.64266.26294141764-58.6629414176441
494320.84350.59801309919-29.7980130991882
504396.94252.96773769487143.932262305133
515358.85309.7526288354849.04737116452


Extrapolation Forecasts of Exponential Smoothing
tForecast95% Lower Bound95% Upper Bound
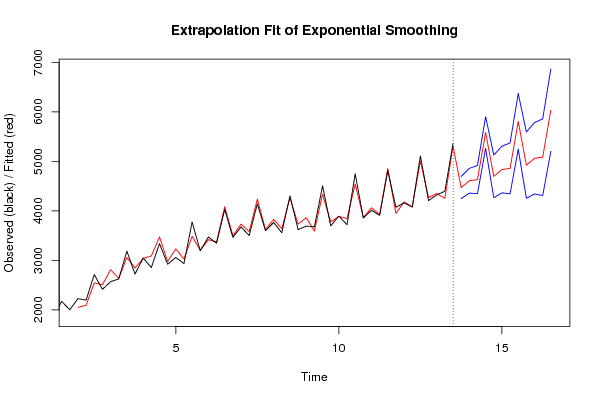
524470.884171027254246.54054989244695.22779216211
534608.784542681094357.783369596054859.78571576612
544631.662954635864348.220633611334915.10527566038
555582.601129200055261.549723195365903.65253520473
564697.422050430724265.957764629265128.88633623218
574835.322422084554364.282012355325306.36283181378
584858.200834039334343.241232218575373.16043586008
595809.139008603515246.285150811586371.99286639544
604923.959929834194253.295918537825594.62394113056
615061.860301488024340.587135383535783.13346759251
625084.738713442794309.376420838425860.10100604717
636035.676888006985202.98523224266868.36854377136

\begin{tabular}{lllllllll}
\hline
Extrapolation Forecasts of Exponential Smoothing \tabularnewline
t & Forecast & 95% Lower Bound & 95% Upper Bound \tabularnewline
52 & 4470.88417102725 & 4246.5405498924 & 4695.22779216211 \tabularnewline
53 & 4608.78454268109 & 4357.78336959605 & 4859.78571576612 \tabularnewline
54 & 4631.66295463586 & 4348.22063361133 & 4915.10527566038 \tabularnewline
55 & 5582.60112920005 & 5261.54972319536 & 5903.65253520473 \tabularnewline
56 & 4697.42205043072 & 4265.95776462926 & 5128.88633623218 \tabularnewline
57 & 4835.32242208455 & 4364.28201235532 & 5306.36283181378 \tabularnewline
58 & 4858.20083403933 & 4343.24123221857 & 5373.16043586008 \tabularnewline
59 & 5809.13900860351 & 5246.28515081158 & 6371.99286639544 \tabularnewline
60 & 4923.95992983419 & 4253.29591853782 & 5594.62394113056 \tabularnewline
61 & 5061.86030148802 & 4340.58713538353 & 5783.13346759251 \tabularnewline
62 & 5084.73871344279 & 4309.37642083842 & 5860.10100604717 \tabularnewline
63 & 6035.67688800698 & 5202.9852322426 & 6868.36854377136 \tabularnewline
\hline
\end{tabular}
%Source: https://freestatistics.org/blog/index.php?pk=301793&T=3

[TABLE]
[ROW][C]Extrapolation Forecasts of Exponential Smoothing[/C][/ROW]
[ROW][C]t[/C][C]Forecast[/C][C]95% Lower Bound[/C][C]95% Upper Bound[/C][/ROW]
[ROW][C]52[/C][C]4470.88417102725[/C][C]4246.5405498924[/C][C]4695.22779216211[/C][/ROW]
[ROW][C]53[/C][C]4608.78454268109[/C][C]4357.78336959605[/C][C]4859.78571576612[/C][/ROW]
[ROW][C]54[/C][C]4631.66295463586[/C][C]4348.22063361133[/C][C]4915.10527566038[/C][/ROW]
[ROW][C]55[/C][C]5582.60112920005[/C][C]5261.54972319536[/C][C]5903.65253520473[/C][/ROW]
[ROW][C]56[/C][C]4697.42205043072[/C][C]4265.95776462926[/C][C]5128.88633623218[/C][/ROW]
[ROW][C]57[/C][C]4835.32242208455[/C][C]4364.28201235532[/C][C]5306.36283181378[/C][/ROW]
[ROW][C]58[/C][C]4858.20083403933[/C][C]4343.24123221857[/C][C]5373.16043586008[/C][/ROW]
[ROW][C]59[/C][C]5809.13900860351[/C][C]5246.28515081158[/C][C]6371.99286639544[/C][/ROW]
[ROW][C]60[/C][C]4923.95992983419[/C][C]4253.29591853782[/C][C]5594.62394113056[/C][/ROW]
[ROW][C]61[/C][C]5061.86030148802[/C][C]4340.58713538353[/C][C]5783.13346759251[/C][/ROW]
[ROW][C]62[/C][C]5084.73871344279[/C][C]4309.37642083842[/C][C]5860.10100604717[/C][/ROW]
[ROW][C]63[/C][C]6035.67688800698[/C][C]5202.9852322426[/C][C]6868.36854377136[/C][/ROW]
[/TABLE]
Source: https://freestatistics.org/blog/index.php?pk=301793&T=3

Globally Unique Identifier (entire table): ba.freestatistics.org/blog/index.php?pk=301793&T=3

As an alternative you can also use a QR Code:  

The GUIDs for individual cells are displayed in the table below:

Extrapolation Forecasts of Exponential Smoothing
tForecast95% Lower Bound95% Upper Bound
524470.884171027254246.54054989244695.22779216211
534608.784542681094357.783369596054859.78571576612
544631.662954635864348.220633611334915.10527566038
555582.601129200055261.549723195365903.65253520473
564697.422050430724265.957764629265128.88633623218
574835.322422084554364.282012355325306.36283181378
584858.200834039334343.241232218575373.16043586008
595809.139008603515246.285150811586371.99286639544
604923.959929834194253.295918537825594.62394113056
615061.860301488024340.587135383535783.13346759251
625084.738713442794309.376420838425860.10100604717
636035.676888006985202.98523224266868.36854377136


Parameters (Session):
par1 = 12 ; par2 = Single ; par3 = multiplicative ; par4 = 12 ;
Parameters (R input):
par1 = 4 ; par2 = Triple ; par3 = additive ; par4 = 12 ;
R code (references can be found in the software module):
par4 <- '12'
par3 <- 'additive'
par2 <- 'Triple'
par1 <- '3'
par1 <- as.numeric(par1)
par4 <- as.numeric(par4)
if (par2 == 'Single') K <- 1
if (par2 == 'Double') K <- 2
if (par2 == 'Triple') K <- par1
nx <- length(x)
nxmK <- nx - K
x <- ts(x, frequency = par1)
if (par2 == 'Single') fit <- HoltWinters(x, gamma=F, beta=F)
if (par2 == 'Double') fit <- HoltWinters(x, gamma=F)
if (par2 == 'Triple') fit <- HoltWinters(x, seasonal=par3)
fit
myresid <- x - fit$fitted[,'xhat']
bitmap(file='test1.png')
op <- par(mfrow=c(2,1))
plot(fit,ylab='Observed (black) / Fitted (red)',main='Interpolation Fit of Exponential Smoothing')
plot(myresid,ylab='Residuals',main='Interpolation Prediction Errors')
par(op)
dev.off()
bitmap(file='test2.png')
p <- predict(fit, par4, prediction.interval=TRUE)
np <- length(p[,1])
plot(fit,p,ylab='Observed (black) / Fitted (red)',main='Extrapolation Fit of Exponential Smoothing')
dev.off()
bitmap(file='test3.png')
op <- par(mfrow = c(2,2))
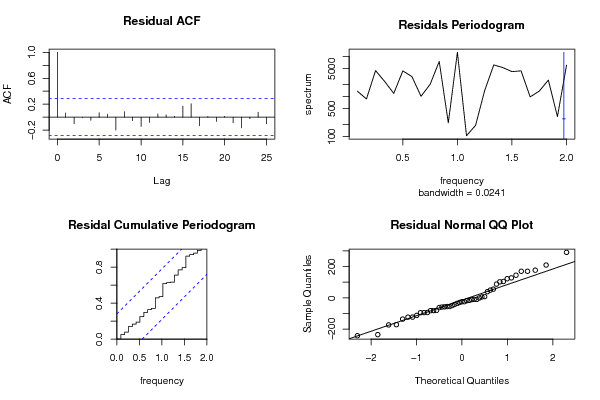
acf(as.numeric(myresid),lag.max = nx/2,main='Residual ACF')
spectrum(myresid,main='Residals Periodogram')
cpgram(myresid,main='Residal Cumulative Periodogram')
qqnorm(myresid,main='Residual Normal QQ Plot')
qqline(myresid)
par(op)
dev.off()
load(file='createtable')
a<-table.start()
a<-table.row.start(a)
a<-table.element(a,'Estimated Parameters of Exponential Smoothing',2,TRUE)
a<-table.row.end(a)
a<-table.row.start(a)
a<-table.element(a,'Parameter',header=TRUE)
a<-table.element(a,'Value',header=TRUE)
a<-table.row.end(a)
a<-table.row.start(a)
a<-table.element(a,'alpha',header=TRUE)
a<-table.element(a,fit$alpha)
a<-table.row.end(a)
a<-table.row.start(a)
a<-table.element(a,'beta',header=TRUE)
a<-table.element(a,fit$beta)
a<-table.row.end(a)
a<-table.row.start(a)
a<-table.element(a,'gamma',header=TRUE)
a<-table.element(a,fit$gamma)
a<-table.row.end(a)
a<-table.end(a)
table.save(a,file='mytable.tab')
a<-table.start()
a<-table.row.start(a)
a<-table.element(a,'Interpolation Forecasts of Exponential Smoothing',4,TRUE)
a<-table.row.end(a)
a<-table.row.start(a)
a<-table.element(a,'t',header=TRUE)
a<-table.element(a,'Observed',header=TRUE)
a<-table.element(a,'Fitted',header=TRUE)
a<-table.element(a,'Residuals',header=TRUE)
a<-table.row.end(a)
for (i in 1:nxmK) {
a<-table.row.start(a)
a<-table.element(a,i+K,header=TRUE)
a<-table.element(a,x[i+K])
a<-table.element(a,fit$fitted[i,'xhat'])
a<-table.element(a,myresid[i])
a<-table.row.end(a)
}
a<-table.end(a)
table.save(a,file='mytable1.tab')
a<-table.start()
a<-table.row.start(a)
a<-table.element(a,'Extrapolation Forecasts of Exponential Smoothing',4,TRUE)
a<-table.row.end(a)
a<-table.row.start(a)
a<-table.element(a,'t',header=TRUE)
a<-table.element(a,'Forecast',header=TRUE)
a<-table.element(a,'95% Lower Bound',header=TRUE)
a<-table.element(a,'95% Upper Bound',header=TRUE)
a<-table.row.end(a)
for (i in 1:np) {
a<-table.row.start(a)
a<-table.element(a,nx+i,header=TRUE)
a<-table.element(a,p[i,'fit'])
a<-table.element(a,p[i,'lwr'])
a<-table.element(a,p[i,'upr'])
a<-table.row.end(a)
}
a<-table.end(a)
table.save(a,file='mytable2.tab')