Free Statistics

of Irreproducible Research!

Author's title

Author*The author of this computation has been verified*
R Software Modulerwasp_smp.wasp
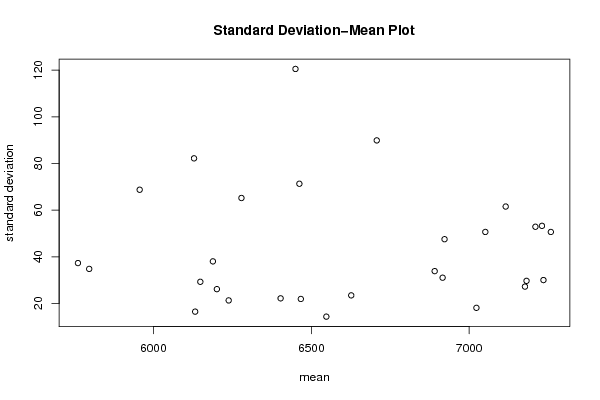
Title produced by softwareStandard Deviation-Mean Plot
Date of computationTue, 20 Dec 2016 22:14:42 +0100
Cite this page as followsStatistical Computations at FreeStatistics.org, Office for Research Development and Education, URL https://freestatistics.org/blog/index.php?v=date/2016/Dec/20/t1482268513afelgcejwvfufbs.htm/, Retrieved Sun, 28 Apr 2024 02:35:12 +0000
Statistical Computations at FreeStatistics.org, Office for Research Development and Education, URL https://freestatistics.org/blog/index.php?pk=301809, Retrieved Sun, 28 Apr 2024 02:35:12 +0000
QR Codes:

Original text written by user:
IsPrivate?No (this computation is public)
User-defined keywords
Estimated Impact50
Family? (F = Feedback message, R = changed R code, M = changed R Module, P = changed Parameters, D = changed Data)
-       [Standard Deviation-Mean Plot] [standard deviatio...] [2016-12-20 21:14:42] [2d1dd91c3b5ba64567b1d6b2c9fe9017] [Current]
Feedback Forum

Post a new message
Dataseries X:
5797.8
5784.3
5714.8
5748.8
5793.8
5783.2
5765
5846.1
5879.4
5922.7
5992.7
6032.5
6028.3
6096.3
6184.8
6206.1
6324
6380.6
6504.6
6591
6637.9
6653.8
6611.3
6603.1
6562.8
6554.9
6529.8
6543.4
6481.5
6489.6
6452.3
6444.5
6409.6
6427.5
6374.2
6400.5
6268.2
6239.5
6220.1
6226.6
6207.1
6217.4
6196.9
6132.9
6151.2
6115.2
6122.6
6140.9
6146.5
6126
6131.9
6190.8
6209.2
6230.8
6196.5
6168.2
6213.4
6243
6298.1
6361.4
6388.7
6416.3
6505.7
6538.7
6605.5
6668.9
6741.7
6813.2
6864.3
6870
6889.8
6938.8
7033.3
7104
7168.7
7156
7156.6
7171.8
7251.2
7258.8
7231.5
7261.7
7252.8
7194.2
7211.9
7177.8
7145.9
7170.6
7189.6
7161
7219.9
7155.3
7155.8
7232.1
7254.9
7278.8
7291.2
7298.6
7256.3
7187.7
7126.3
7034.6
7018.6
7024.4
7028.2
7042.2
7022.2
6998.7
6982.7
6936.6
6887.2
6881.1
6890.9
6947.7
6887.5
6937.1


Summary of computational transaction
Raw Input view raw input (R code)
Raw Outputview raw output of R engine
Computing time1 seconds
R ServerBig Analytics Cloud Computing Center

\begin{tabular}{lllllllll}
\hline
Summary of computational transaction \tabularnewline
Raw Input view raw input (R code)  \tabularnewline
Raw Outputview raw output of R engine  \tabularnewline
Computing time1 seconds \tabularnewline
R ServerBig Analytics Cloud Computing Center \tabularnewline
\hline
\end{tabular}
%Source: https://freestatistics.org/blog/index.php?pk=301809&T=0

[TABLE]
[ROW]
Summary of computational transaction[/C][/ROW] [ROW]Raw Input[/C] view raw input (R code) [/C][/ROW] [ROW]Raw Output[/C]view raw output of R engine [/C][/ROW] [ROW]Computing time[/C]1 seconds[/C][/ROW] [ROW]R Server[/C]Big Analytics Cloud Computing Center[/C][/ROW] [/TABLE] Source: https://freestatistics.org/blog/index.php?pk=301809&T=0

Globally Unique Identifier (entire table): ba.freestatistics.org/blog/index.php?pk=301809&T=0

As an alternative you can also use a QR Code:  

The GUIDs for individual cells are displayed in the table below:

Summary of computational transaction
Raw Input view raw input (R code)
Raw Outputview raw output of R engine
Computing time1 seconds
R ServerBig Analytics Cloud Computing Center


Standard Deviation-Mean Plot
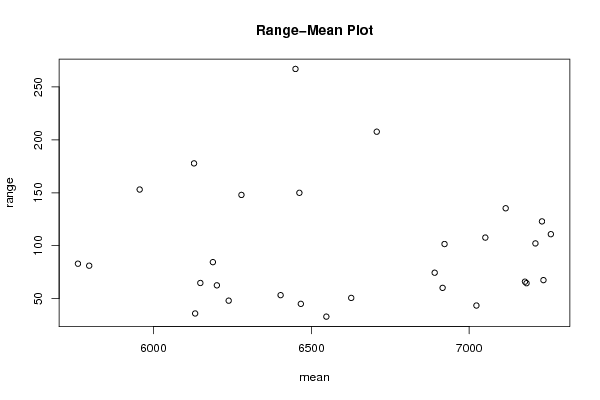
SectionMeanStandard DeviationRange
15761.42537.325985139935283
25797.02534.811336754952181.1000000000004
35956.82568.7334646781805153.1
46128.87582.1944189102886177.8
56450.05120.4913689855267
66626.52523.479405869825450.6999999999998
76547.72514.361377603373133
86466.97521.934352813186445.1000000000004
96402.9522.207281088267853.3000000000002
106238.621.316816522798548.0999999999995
116188.57538.048510702347884.5
126132.47516.508053590091436
136148.829.295847259751364.8000000000002
146201.17526.148597795420662.6000000000004
156278.97565.2020641288807148
166462.3571.3056098774843150
176707.32589.8813430770442207.7
186890.72533.861814777120374.5
197115.561.534759824563135.4
207209.652.8804941983965102.2
217235.0530.036699774331767.5
227176.5527.239738128941966
237181.4529.703254591598664.5999999999995
247230.453.2630578669055123
257258.4550.645072152514110.900000000001
267050.97550.6503290545416107.7
277022.82518.135485472777843.5
286921.947.5445755756286101.599999999999
296915.831.049422968336760.1999999999998

\begin{tabular}{lllllllll}
\hline
Standard Deviation-Mean Plot \tabularnewline
Section & Mean & Standard Deviation & Range \tabularnewline
1 & 5761.425 & 37.3259851399352 & 83 \tabularnewline
2 & 5797.025 & 34.8113367549521 & 81.1000000000004 \tabularnewline
3 & 5956.825 & 68.7334646781805 & 153.1 \tabularnewline
4 & 6128.875 & 82.1944189102886 & 177.8 \tabularnewline
5 & 6450.05 & 120.4913689855 & 267 \tabularnewline
6 & 6626.525 & 23.4794058698254 & 50.6999999999998 \tabularnewline
7 & 6547.725 & 14.3613776033731 & 33 \tabularnewline
8 & 6466.975 & 21.9343528131864 & 45.1000000000004 \tabularnewline
9 & 6402.95 & 22.2072810882678 & 53.3000000000002 \tabularnewline
10 & 6238.6 & 21.3168165227985 & 48.0999999999995 \tabularnewline
11 & 6188.575 & 38.0485107023478 & 84.5 \tabularnewline
12 & 6132.475 & 16.5080535900914 & 36 \tabularnewline
13 & 6148.8 & 29.2958472597513 & 64.8000000000002 \tabularnewline
14 & 6201.175 & 26.1485977954206 & 62.6000000000004 \tabularnewline
15 & 6278.975 & 65.2020641288807 & 148 \tabularnewline
16 & 6462.35 & 71.3056098774843 & 150 \tabularnewline
17 & 6707.325 & 89.8813430770442 & 207.7 \tabularnewline
18 & 6890.725 & 33.8618147771203 & 74.5 \tabularnewline
19 & 7115.5 & 61.534759824563 & 135.4 \tabularnewline
20 & 7209.6 & 52.8804941983965 & 102.2 \tabularnewline
21 & 7235.05 & 30.0366997743317 & 67.5 \tabularnewline
22 & 7176.55 & 27.2397381289419 & 66 \tabularnewline
23 & 7181.45 & 29.7032545915986 & 64.5999999999995 \tabularnewline
24 & 7230.4 & 53.2630578669055 & 123 \tabularnewline
25 & 7258.45 & 50.645072152514 & 110.900000000001 \tabularnewline
26 & 7050.975 & 50.6503290545416 & 107.7 \tabularnewline
27 & 7022.825 & 18.1354854727778 & 43.5 \tabularnewline
28 & 6921.9 & 47.5445755756286 & 101.599999999999 \tabularnewline
29 & 6915.8 & 31.0494229683367 & 60.1999999999998 \tabularnewline
\hline
\end{tabular}
%Source: https://freestatistics.org/blog/index.php?pk=301809&T=1

[TABLE]
[ROW][C]Standard Deviation-Mean Plot[/C][/ROW]
[ROW][C]Section[/C][C]Mean[/C][C]Standard Deviation[/C][C]Range[/C][/ROW]
[ROW][C]1[/C][C]5761.425[/C][C]37.3259851399352[/C][C]83[/C][/ROW]
[ROW][C]2[/C][C]5797.025[/C][C]34.8113367549521[/C][C]81.1000000000004[/C][/ROW]
[ROW][C]3[/C][C]5956.825[/C][C]68.7334646781805[/C][C]153.1[/C][/ROW]
[ROW][C]4[/C][C]6128.875[/C][C]82.1944189102886[/C][C]177.8[/C][/ROW]
[ROW][C]5[/C][C]6450.05[/C][C]120.4913689855[/C][C]267[/C][/ROW]
[ROW][C]6[/C][C]6626.525[/C][C]23.4794058698254[/C][C]50.6999999999998[/C][/ROW]
[ROW][C]7[/C][C]6547.725[/C][C]14.3613776033731[/C][C]33[/C][/ROW]
[ROW][C]8[/C][C]6466.975[/C][C]21.9343528131864[/C][C]45.1000000000004[/C][/ROW]
[ROW][C]9[/C][C]6402.95[/C][C]22.2072810882678[/C][C]53.3000000000002[/C][/ROW]
[ROW][C]10[/C][C]6238.6[/C][C]21.3168165227985[/C][C]48.0999999999995[/C][/ROW]
[ROW][C]11[/C][C]6188.575[/C][C]38.0485107023478[/C][C]84.5[/C][/ROW]
[ROW][C]12[/C][C]6132.475[/C][C]16.5080535900914[/C][C]36[/C][/ROW]
[ROW][C]13[/C][C]6148.8[/C][C]29.2958472597513[/C][C]64.8000000000002[/C][/ROW]
[ROW][C]14[/C][C]6201.175[/C][C]26.1485977954206[/C][C]62.6000000000004[/C][/ROW]
[ROW][C]15[/C][C]6278.975[/C][C]65.2020641288807[/C][C]148[/C][/ROW]
[ROW][C]16[/C][C]6462.35[/C][C]71.3056098774843[/C][C]150[/C][/ROW]
[ROW][C]17[/C][C]6707.325[/C][C]89.8813430770442[/C][C]207.7[/C][/ROW]
[ROW][C]18[/C][C]6890.725[/C][C]33.8618147771203[/C][C]74.5[/C][/ROW]
[ROW][C]19[/C][C]7115.5[/C][C]61.534759824563[/C][C]135.4[/C][/ROW]
[ROW][C]20[/C][C]7209.6[/C][C]52.8804941983965[/C][C]102.2[/C][/ROW]
[ROW][C]21[/C][C]7235.05[/C][C]30.0366997743317[/C][C]67.5[/C][/ROW]
[ROW][C]22[/C][C]7176.55[/C][C]27.2397381289419[/C][C]66[/C][/ROW]
[ROW][C]23[/C][C]7181.45[/C][C]29.7032545915986[/C][C]64.5999999999995[/C][/ROW]
[ROW][C]24[/C][C]7230.4[/C][C]53.2630578669055[/C][C]123[/C][/ROW]
[ROW][C]25[/C][C]7258.45[/C][C]50.645072152514[/C][C]110.900000000001[/C][/ROW]
[ROW][C]26[/C][C]7050.975[/C][C]50.6503290545416[/C][C]107.7[/C][/ROW]
[ROW][C]27[/C][C]7022.825[/C][C]18.1354854727778[/C][C]43.5[/C][/ROW]
[ROW][C]28[/C][C]6921.9[/C][C]47.5445755756286[/C][C]101.599999999999[/C][/ROW]
[ROW][C]29[/C][C]6915.8[/C][C]31.0494229683367[/C][C]60.1999999999998[/C][/ROW]
[/TABLE]
Source: https://freestatistics.org/blog/index.php?pk=301809&T=1

Globally Unique Identifier (entire table): ba.freestatistics.org/blog/index.php?pk=301809&T=1

As an alternative you can also use a QR Code:  

The GUIDs for individual cells are displayed in the table below:

Standard Deviation-Mean Plot
SectionMeanStandard DeviationRange
15761.42537.325985139935283
25797.02534.811336754952181.1000000000004
35956.82568.7334646781805153.1
46128.87582.1944189102886177.8
56450.05120.4913689855267
66626.52523.479405869825450.6999999999998
76547.72514.361377603373133
86466.97521.934352813186445.1000000000004
96402.9522.207281088267853.3000000000002
106238.621.316816522798548.0999999999995
116188.57538.048510702347884.5
126132.47516.508053590091436
136148.829.295847259751364.8000000000002
146201.17526.148597795420662.6000000000004
156278.97565.2020641288807148
166462.3571.3056098774843150
176707.32589.8813430770442207.7
186890.72533.861814777120374.5
197115.561.534759824563135.4
207209.652.8804941983965102.2
217235.0530.036699774331767.5
227176.5527.239738128941966
237181.4529.703254591598664.5999999999995
247230.453.2630578669055123
257258.4550.645072152514110.900000000001
267050.97550.6503290545416107.7
277022.82518.135485472777843.5
286921.947.5445755756286101.599999999999
296915.831.049422968336760.1999999999998


Regression: S.E.(k) = alpha + beta * Mean(k)
alpha52.7127196595841
beta-0.00135039330925542
S.D.0.010189828258748
T-STAT-0.132523657412587
p-value0.895552823669707

\begin{tabular}{lllllllll}
\hline
Regression: S.E.(k) = alpha + beta * Mean(k) \tabularnewline
alpha & 52.7127196595841 \tabularnewline
beta & -0.00135039330925542 \tabularnewline
S.D. & 0.010189828258748 \tabularnewline
T-STAT & -0.132523657412587 \tabularnewline
p-value & 0.895552823669707 \tabularnewline
\hline
\end{tabular}
%Source: https://freestatistics.org/blog/index.php?pk=301809&T=2

[TABLE]
[ROW][C]Regression: S.E.(k) = alpha + beta * Mean(k)[/C][/ROW]
[ROW][C]alpha[/C][C]52.7127196595841[/C][/ROW]
[ROW][C]beta[/C][C]-0.00135039330925542[/C][/ROW]
[ROW][C]S.D.[/C][C]0.010189828258748[/C][/ROW]
[ROW][C]T-STAT[/C][C]-0.132523657412587[/C][/ROW]
[ROW][C]p-value[/C][C]0.895552823669707[/C][/ROW]
[/TABLE]
Source: https://freestatistics.org/blog/index.php?pk=301809&T=2

Globally Unique Identifier (entire table): ba.freestatistics.org/blog/index.php?pk=301809&T=2

As an alternative you can also use a QR Code:  

The GUIDs for individual cells are displayed in the table below:

Regression: S.E.(k) = alpha + beta * Mean(k)
alpha52.7127196595841
beta-0.00135039330925542
S.D.0.010189828258748
T-STAT-0.132523657412587
p-value0.895552823669707


Regression: ln S.E.(k) = alpha + beta * ln Mean(k)
alpha1.56600289798322
beta0.2353132096901
S.D.1.44351876040846
T-STAT0.163013613777707
p-value0.871721708268906
Lambda0.7646867903099

\begin{tabular}{lllllllll}
\hline
Regression: ln S.E.(k) = alpha + beta * ln Mean(k) \tabularnewline
alpha & 1.56600289798322 \tabularnewline
beta & 0.2353132096901 \tabularnewline
S.D. & 1.44351876040846 \tabularnewline
T-STAT & 0.163013613777707 \tabularnewline
p-value & 0.871721708268906 \tabularnewline
Lambda & 0.7646867903099 \tabularnewline
\hline
\end{tabular}
%Source: https://freestatistics.org/blog/index.php?pk=301809&T=3

[TABLE]
[ROW][C]Regression: ln S.E.(k) = alpha + beta * ln Mean(k)[/C][/ROW]
[ROW][C]alpha[/C][C]1.56600289798322[/C][/ROW]
[ROW][C]beta[/C][C]0.2353132096901[/C][/ROW]
[ROW][C]S.D.[/C][C]1.44351876040846[/C][/ROW]
[ROW][C]T-STAT[/C][C]0.163013613777707[/C][/ROW]
[ROW][C]p-value[/C][C]0.871721708268906[/C][/ROW]
[ROW][C]Lambda[/C][C]0.7646867903099[/C][/ROW]
[/TABLE]
Source: https://freestatistics.org/blog/index.php?pk=301809&T=3

Globally Unique Identifier (entire table): ba.freestatistics.org/blog/index.php?pk=301809&T=3

As an alternative you can also use a QR Code:  

The GUIDs for individual cells are displayed in the table below:

Regression: ln S.E.(k) = alpha + beta * ln Mean(k)
alpha1.56600289798322
beta0.2353132096901
S.D.1.44351876040846
T-STAT0.163013613777707
p-value0.871721708268906
Lambda0.7646867903099


Parameters (Session):
par1 = 12 ; par2 = Triple ; par3 = additive ; par4 = 12 ;
Parameters (R input):
par1 = 4 ;
R code (references can be found in the software module):
par1 <- as.numeric(par1)
(n <- length(x))
(np <- floor(n / par1))
arr <- array(NA,dim=c(par1,np))
j <- 0
k <- 1
for (i in 1:(np*par1))
{
j = j + 1
arr[j,k] <- x[i]
if (j == par1) {
j = 0
k=k+1
}
}
arr
arr.mean <- array(NA,dim=np)
arr.sd <- array(NA,dim=np)
arr.range <- array(NA,dim=np)
for (j in 1:np)
{
arr.mean[j] <- mean(arr[,j],na.rm=TRUE)
arr.sd[j] <- sd(arr[,j],na.rm=TRUE)
arr.range[j] <- max(arr[,j],na.rm=TRUE) - min(arr[,j],na.rm=TRUE)
}
arr.mean
arr.sd
arr.range
(lm1 <- lm(arr.sd~arr.mean))
(lnlm1 <- lm(log(arr.sd)~log(arr.mean)))
(lm2 <- lm(arr.range~arr.mean))
bitmap(file='test1.png')
plot(arr.mean,arr.sd,main='Standard Deviation-Mean Plot',xlab='mean',ylab='standard deviation')
dev.off()
bitmap(file='test2.png')
plot(arr.mean,arr.range,main='Range-Mean Plot',xlab='mean',ylab='range')
dev.off()
load(file='createtable')
a<-table.start()
a<-table.row.start(a)
a<-table.element(a,'Standard Deviation-Mean Plot',4,TRUE)
a<-table.row.end(a)
a<-table.row.start(a)
a<-table.element(a,'Section',header=TRUE)
a<-table.element(a,'Mean',header=TRUE)
a<-table.element(a,'Standard Deviation',header=TRUE)
a<-table.element(a,'Range',header=TRUE)
a<-table.row.end(a)
for (j in 1:np) {
a<-table.row.start(a)
a<-table.element(a,j,header=TRUE)
a<-table.element(a,arr.mean[j])
a<-table.element(a,arr.sd[j] )
a<-table.element(a,arr.range[j] )
a<-table.row.end(a)
}
a<-table.end(a)
table.save(a,file='mytable.tab')
a<-table.start()
a<-table.row.start(a)
a<-table.element(a,'Regression: S.E.(k) = alpha + beta * Mean(k)',2,TRUE)
a<-table.row.end(a)
a<-table.row.start(a)
a<-table.element(a,'alpha',header=TRUE)
a<-table.element(a,lm1$coefficients[[1]])
a<-table.row.end(a)
a<-table.row.start(a)
a<-table.element(a,'beta',header=TRUE)
a<-table.element(a,lm1$coefficients[[2]])
a<-table.row.end(a)
a<-table.row.start(a)
a<-table.element(a,'S.D.',header=TRUE)
a<-table.element(a,summary(lm1)$coefficients[2,2])
a<-table.row.end(a)
a<-table.row.start(a)
a<-table.element(a,'T-STAT',header=TRUE)
a<-table.element(a,summary(lm1)$coefficients[2,3])
a<-table.row.end(a)
a<-table.row.start(a)
a<-table.element(a,'p-value',header=TRUE)
a<-table.element(a,summary(lm1)$coefficients[2,4])
a<-table.row.end(a)
a<-table.end(a)
table.save(a,file='mytable1.tab')
a<-table.start()
a<-table.row.start(a)
a<-table.element(a,'Regression: ln S.E.(k) = alpha + beta * ln Mean(k)',2,TRUE)
a<-table.row.end(a)
a<-table.row.start(a)
a<-table.element(a,'alpha',header=TRUE)
a<-table.element(a,lnlm1$coefficients[[1]])
a<-table.row.end(a)
a<-table.row.start(a)
a<-table.element(a,'beta',header=TRUE)
a<-table.element(a,lnlm1$coefficients[[2]])
a<-table.row.end(a)
a<-table.row.start(a)
a<-table.element(a,'S.D.',header=TRUE)
a<-table.element(a,summary(lnlm1)$coefficients[2,2])
a<-table.row.end(a)
a<-table.row.start(a)
a<-table.element(a,'T-STAT',header=TRUE)
a<-table.element(a,summary(lnlm1)$coefficients[2,3])
a<-table.row.end(a)
a<-table.row.start(a)
a<-table.element(a,'p-value',header=TRUE)
a<-table.element(a,summary(lnlm1)$coefficients[2,4])
a<-table.row.end(a)
a<-table.row.start(a)
a<-table.element(a,'Lambda',header=TRUE)
a<-table.element(a,1-lnlm1$coefficients[[2]])
a<-table.row.end(a)
a<-table.end(a)
table.save(a,file='mytable2.tab')