Free Statistics

of Irreproducible Research!

Author's title

Author*The author of this computation has been verified*
R Software Modulerwasp_arimabackwardselection.wasp
Title produced by softwareARIMA Backward Selection
Date of computationWed, 21 Dec 2016 00:27:16 +0100
Cite this page as followsStatistical Computations at FreeStatistics.org, Office for Research Development and Education, URL https://freestatistics.org/blog/index.php?v=date/2016/Dec/21/t14822764620likel91e54yfu0.htm/, Retrieved Mon, 06 May 2024 13:00:49 +0000
Statistical Computations at FreeStatistics.org, Office for Research Development and Education, URL https://freestatistics.org/blog/index.php?pk=301832, Retrieved Mon, 06 May 2024 13:00:49 +0000
QR Codes:

Original text written by user:
IsPrivate?No (this computation is public)
User-defined keywords
Estimated Impact107
Family? (F = Feedback message, R = changed R code, M = changed R Module, P = changed Parameters, D = changed Data)
-     [Exponential Smoothing] [] [2016-12-18 12:31:12] [683f400e1b95307fc738e729f07c4fce]
- R  D  [Exponential Smoothing] [] [2016-12-18 13:29:07] [683f400e1b95307fc738e729f07c4fce]
- RMP       [ARIMA Backward Selection] [] [2016-12-20 23:27:16] [404ac5ee4f7301873f6a96ef36861981] [Current]
Feedback Forum

Post a new message
Dataseries X:
2280
3640
3950
3860
3500
4740
3690
4810
6150
4530
4760
4670
3510
2990
3240
2700
2610
3280
3170
3440
4710
4320
3650
3340
3050
2960
2810
2670
2440
2580
2520
2860
3500
3460
3310
3050
2730
2760
2800
2490
2310
2350
2370
2560
2740
2830
3010
2500
2630
2270
2410
2210
2330
2690
3150
2330
2260
2330
2240
2230
2270
2220
2290
2240
2110
2240
2230
2320
2320
2540
2530
2400
2470
2290
2110
2050
2170
2070
2330
2190
2260
2300
2220
2220
2380
2280
2150
2190
2080
2120
2140
2130
2210
2210
2190
2160
2290
2270
2200
2120
2050
2080
2180
2070
2170
2240
2320
2250


Summary of computational transaction
Raw Input view raw input (R code)
Raw Outputview raw output of R engine
Computing time3 seconds
R ServerBig Analytics Cloud Computing Center

\begin{tabular}{lllllllll}
\hline
Summary of computational transaction \tabularnewline
Raw Input view raw input (R code)  \tabularnewline
Raw Outputview raw output of R engine  \tabularnewline
Computing time3 seconds \tabularnewline
R ServerBig Analytics Cloud Computing Center \tabularnewline
\hline
\end{tabular}
%Source: https://freestatistics.org/blog/index.php?pk=301832&T=0

[TABLE]
[ROW]
Summary of computational transaction[/C][/ROW] [ROW]Raw Input[/C] view raw input (R code) [/C][/ROW] [ROW]Raw Output[/C]view raw output of R engine [/C][/ROW] [ROW]Computing time[/C]3 seconds[/C][/ROW] [ROW]R Server[/C]Big Analytics Cloud Computing Center[/C][/ROW] [/TABLE] Source: https://freestatistics.org/blog/index.php?pk=301832&T=0

Globally Unique Identifier (entire table): ba.freestatistics.org/blog/index.php?pk=301832&T=0

As an alternative you can also use a QR Code:  

The GUIDs for individual cells are displayed in the table below:

Summary of computational transaction
Raw Input view raw input (R code)
Raw Outputview raw output of R engine
Computing time3 seconds
R ServerBig Analytics Cloud Computing Center


ARIMA Parameter Estimation and Backward Selection
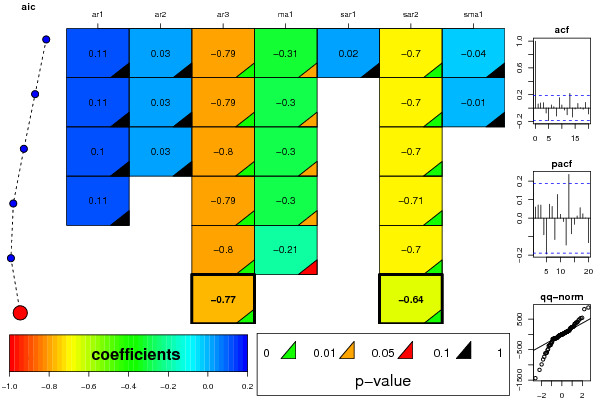
Iterationar1ar2ar3ma1sar1sar2sma1
Estimates ( 1 )0.10870.0268-0.7883-0.30670.0221-0.6976-0.0385
(p-val)(0.251 )(0.7386 )(0 )(0.0424 )(0.8664 )(0 )(0.8478 )
Estimates ( 2 )0.10550.0283-0.7906-0.29620-0.6953-0.0134
(p-val)(0.2488 )(0.7202 )(0 )(0.0268 )(NA )(0 )(0.9228 )
Estimates ( 3 )0.10420.0281-0.7959-0.29530-0.69740
(p-val)(0.2426 )(0.7189 )(0 )(0.0261 )(NA )(0 )(NA )
Estimates ( 4 )0.11130-0.7898-0.30080-0.70620
(p-val)(0.2105 )(NA )(0 )(0.0231 )(NA )(0 )(NA )
Estimates ( 5 )00-0.8042-0.20560-0.6960
(p-val)(NA )(NA )(0 )(0.0644 )(NA )(0 )(NA )
Estimates ( 6 )00-0.771300-0.64440
(p-val)(NA )(NA )(0 )(NA )(NA )(0 )(NA )
Estimates ( 7 )NANANANANANANA
(p-val)(NA )(NA )(NA )(NA )(NA )(NA )(NA )
Estimates ( 8 )NANANANANANANA
(p-val)(NA )(NA )(NA )(NA )(NA )(NA )(NA )
Estimates ( 9 )NANANANANANANA
(p-val)(NA )(NA )(NA )(NA )(NA )(NA )(NA )
Estimates ( 10 )NANANANANANANA
(p-val)(NA )(NA )(NA )(NA )(NA )(NA )(NA )
Estimates ( 11 )NANANANANANANA
(p-val)(NA )(NA )(NA )(NA )(NA )(NA )(NA )
Estimates ( 12 )NANANANANANANA
(p-val)(NA )(NA )(NA )(NA )(NA )(NA )(NA )
Estimates ( 13 )NANANANANANANA
(p-val)(NA )(NA )(NA )(NA )(NA )(NA )(NA )

\begin{tabular}{lllllllll}
\hline
ARIMA Parameter Estimation and Backward Selection \tabularnewline
Iteration & ar1 & ar2 & ar3 & ma1 & sar1 & sar2 & sma1 \tabularnewline
Estimates ( 1 ) & 0.1087 & 0.0268 & -0.7883 & -0.3067 & 0.0221 & -0.6976 & -0.0385 \tabularnewline
(p-val) & (0.251 ) & (0.7386 ) & (0 ) & (0.0424 ) & (0.8664 ) & (0 ) & (0.8478 ) \tabularnewline
Estimates ( 2 ) & 0.1055 & 0.0283 & -0.7906 & -0.2962 & 0 & -0.6953 & -0.0134 \tabularnewline
(p-val) & (0.2488 ) & (0.7202 ) & (0 ) & (0.0268 ) & (NA ) & (0 ) & (0.9228 ) \tabularnewline
Estimates ( 3 ) & 0.1042 & 0.0281 & -0.7959 & -0.2953 & 0 & -0.6974 & 0 \tabularnewline
(p-val) & (0.2426 ) & (0.7189 ) & (0 ) & (0.0261 ) & (NA ) & (0 ) & (NA ) \tabularnewline
Estimates ( 4 ) & 0.1113 & 0 & -0.7898 & -0.3008 & 0 & -0.7062 & 0 \tabularnewline
(p-val) & (0.2105 ) & (NA ) & (0 ) & (0.0231 ) & (NA ) & (0 ) & (NA ) \tabularnewline
Estimates ( 5 ) & 0 & 0 & -0.8042 & -0.2056 & 0 & -0.696 & 0 \tabularnewline
(p-val) & (NA ) & (NA ) & (0 ) & (0.0644 ) & (NA ) & (0 ) & (NA ) \tabularnewline
Estimates ( 6 ) & 0 & 0 & -0.7713 & 0 & 0 & -0.6444 & 0 \tabularnewline
(p-val) & (NA ) & (NA ) & (0 ) & (NA ) & (NA ) & (0 ) & (NA ) \tabularnewline
Estimates ( 7 ) & NA & NA & NA & NA & NA & NA & NA \tabularnewline
(p-val) & (NA ) & (NA ) & (NA ) & (NA ) & (NA ) & (NA ) & (NA ) \tabularnewline
Estimates ( 8 ) & NA & NA & NA & NA & NA & NA & NA \tabularnewline
(p-val) & (NA ) & (NA ) & (NA ) & (NA ) & (NA ) & (NA ) & (NA ) \tabularnewline
Estimates ( 9 ) & NA & NA & NA & NA & NA & NA & NA \tabularnewline
(p-val) & (NA ) & (NA ) & (NA ) & (NA ) & (NA ) & (NA ) & (NA ) \tabularnewline
Estimates ( 10 ) & NA & NA & NA & NA & NA & NA & NA \tabularnewline
(p-val) & (NA ) & (NA ) & (NA ) & (NA ) & (NA ) & (NA ) & (NA ) \tabularnewline
Estimates ( 11 ) & NA & NA & NA & NA & NA & NA & NA \tabularnewline
(p-val) & (NA ) & (NA ) & (NA ) & (NA ) & (NA ) & (NA ) & (NA ) \tabularnewline
Estimates ( 12 ) & NA & NA & NA & NA & NA & NA & NA \tabularnewline
(p-val) & (NA ) & (NA ) & (NA ) & (NA ) & (NA ) & (NA ) & (NA ) \tabularnewline
Estimates ( 13 ) & NA & NA & NA & NA & NA & NA & NA \tabularnewline
(p-val) & (NA ) & (NA ) & (NA ) & (NA ) & (NA ) & (NA ) & (NA ) \tabularnewline
\hline
\end{tabular}
%Source: https://freestatistics.org/blog/index.php?pk=301832&T=1

[TABLE]
[ROW][C]ARIMA Parameter Estimation and Backward Selection[/C][/ROW]
[ROW][C]Iteration[/C][C]ar1[/C][C]ar2[/C][C]ar3[/C][C]ma1[/C][C]sar1[/C][C]sar2[/C][C]sma1[/C][/ROW]
[ROW][C]Estimates ( 1 )[/C][C]0.1087[/C][C]0.0268[/C][C]-0.7883[/C][C]-0.3067[/C][C]0.0221[/C][C]-0.6976[/C][C]-0.0385[/C][/ROW]
[ROW][C](p-val)[/C][C](0.251 )[/C][C](0.7386 )[/C][C](0 )[/C][C](0.0424 )[/C][C](0.8664 )[/C][C](0 )[/C][C](0.8478 )[/C][/ROW]
[ROW][C]Estimates ( 2 )[/C][C]0.1055[/C][C]0.0283[/C][C]-0.7906[/C][C]-0.2962[/C][C]0[/C][C]-0.6953[/C][C]-0.0134[/C][/ROW]
[ROW][C](p-val)[/C][C](0.2488 )[/C][C](0.7202 )[/C][C](0 )[/C][C](0.0268 )[/C][C](NA )[/C][C](0 )[/C][C](0.9228 )[/C][/ROW]
[ROW][C]Estimates ( 3 )[/C][C]0.1042[/C][C]0.0281[/C][C]-0.7959[/C][C]-0.2953[/C][C]0[/C][C]-0.6974[/C][C]0[/C][/ROW]
[ROW][C](p-val)[/C][C](0.2426 )[/C][C](0.7189 )[/C][C](0 )[/C][C](0.0261 )[/C][C](NA )[/C][C](0 )[/C][C](NA )[/C][/ROW]
[ROW][C]Estimates ( 4 )[/C][C]0.1113[/C][C]0[/C][C]-0.7898[/C][C]-0.3008[/C][C]0[/C][C]-0.7062[/C][C]0[/C][/ROW]
[ROW][C](p-val)[/C][C](0.2105 )[/C][C](NA )[/C][C](0 )[/C][C](0.0231 )[/C][C](NA )[/C][C](0 )[/C][C](NA )[/C][/ROW]
[ROW][C]Estimates ( 5 )[/C][C]0[/C][C]0[/C][C]-0.8042[/C][C]-0.2056[/C][C]0[/C][C]-0.696[/C][C]0[/C][/ROW]
[ROW][C](p-val)[/C][C](NA )[/C][C](NA )[/C][C](0 )[/C][C](0.0644 )[/C][C](NA )[/C][C](0 )[/C][C](NA )[/C][/ROW]
[ROW][C]Estimates ( 6 )[/C][C]0[/C][C]0[/C][C]-0.7713[/C][C]0[/C][C]0[/C][C]-0.6444[/C][C]0[/C][/ROW]
[ROW][C](p-val)[/C][C](NA )[/C][C](NA )[/C][C](0 )[/C][C](NA )[/C][C](NA )[/C][C](0 )[/C][C](NA )[/C][/ROW]
[ROW][C]Estimates ( 7 )[/C][C]NA[/C][C]NA[/C][C]NA[/C][C]NA[/C][C]NA[/C][C]NA[/C][C]NA[/C][/ROW]
[ROW][C](p-val)[/C][C](NA )[/C][C](NA )[/C][C](NA )[/C][C](NA )[/C][C](NA )[/C][C](NA )[/C][C](NA )[/C][/ROW]
[ROW][C]Estimates ( 8 )[/C][C]NA[/C][C]NA[/C][C]NA[/C][C]NA[/C][C]NA[/C][C]NA[/C][C]NA[/C][/ROW]
[ROW][C](p-val)[/C][C](NA )[/C][C](NA )[/C][C](NA )[/C][C](NA )[/C][C](NA )[/C][C](NA )[/C][C](NA )[/C][/ROW]
[ROW][C]Estimates ( 9 )[/C][C]NA[/C][C]NA[/C][C]NA[/C][C]NA[/C][C]NA[/C][C]NA[/C][C]NA[/C][/ROW]
[ROW][C](p-val)[/C][C](NA )[/C][C](NA )[/C][C](NA )[/C][C](NA )[/C][C](NA )[/C][C](NA )[/C][C](NA )[/C][/ROW]
[ROW][C]Estimates ( 10 )[/C][C]NA[/C][C]NA[/C][C]NA[/C][C]NA[/C][C]NA[/C][C]NA[/C][C]NA[/C][/ROW]
[ROW][C](p-val)[/C][C](NA )[/C][C](NA )[/C][C](NA )[/C][C](NA )[/C][C](NA )[/C][C](NA )[/C][C](NA )[/C][/ROW]
[ROW][C]Estimates ( 11 )[/C][C]NA[/C][C]NA[/C][C]NA[/C][C]NA[/C][C]NA[/C][C]NA[/C][C]NA[/C][/ROW]
[ROW][C](p-val)[/C][C](NA )[/C][C](NA )[/C][C](NA )[/C][C](NA )[/C][C](NA )[/C][C](NA )[/C][C](NA )[/C][/ROW]
[ROW][C]Estimates ( 12 )[/C][C]NA[/C][C]NA[/C][C]NA[/C][C]NA[/C][C]NA[/C][C]NA[/C][C]NA[/C][/ROW]
[ROW][C](p-val)[/C][C](NA )[/C][C](NA )[/C][C](NA )[/C][C](NA )[/C][C](NA )[/C][C](NA )[/C][C](NA )[/C][/ROW]
[ROW][C]Estimates ( 13 )[/C][C]NA[/C][C]NA[/C][C]NA[/C][C]NA[/C][C]NA[/C][C]NA[/C][C]NA[/C][/ROW]
[ROW][C](p-val)[/C][C](NA )[/C][C](NA )[/C][C](NA )[/C][C](NA )[/C][C](NA )[/C][C](NA )[/C][C](NA )[/C][/ROW]
[/TABLE]
Source: https://freestatistics.org/blog/index.php?pk=301832&T=1

Globally Unique Identifier (entire table): ba.freestatistics.org/blog/index.php?pk=301832&T=1

As an alternative you can also use a QR Code:  

The GUIDs for individual cells are displayed in the table below:

ARIMA Parameter Estimation and Backward Selection
Iterationar1ar2ar3ma1sar1sar2sma1
Estimates ( 1 )0.10870.0268-0.7883-0.30670.0221-0.6976-0.0385
(p-val)(0.251 )(0.7386 )(0 )(0.0424 )(0.8664 )(0 )(0.8478 )
Estimates ( 2 )0.10550.0283-0.7906-0.29620-0.6953-0.0134
(p-val)(0.2488 )(0.7202 )(0 )(0.0268 )(NA )(0 )(0.9228 )
Estimates ( 3 )0.10420.0281-0.7959-0.29530-0.69740
(p-val)(0.2426 )(0.7189 )(0 )(0.0261 )(NA )(0 )(NA )
Estimates ( 4 )0.11130-0.7898-0.30080-0.70620
(p-val)(0.2105 )(NA )(0 )(0.0231 )(NA )(0 )(NA )
Estimates ( 5 )00-0.8042-0.20560-0.6960
(p-val)(NA )(NA )(0 )(0.0644 )(NA )(0 )(NA )
Estimates ( 6 )00-0.771300-0.64440
(p-val)(NA )(NA )(0 )(NA )(NA )(0 )(NA )
Estimates ( 7 )NANANANANANANA
(p-val)(NA )(NA )(NA )(NA )(NA )(NA )(NA )
Estimates ( 8 )NANANANANANANA
(p-val)(NA )(NA )(NA )(NA )(NA )(NA )(NA )
Estimates ( 9 )NANANANANANANA
(p-val)(NA )(NA )(NA )(NA )(NA )(NA )(NA )
Estimates ( 10 )NANANANANANANA
(p-val)(NA )(NA )(NA )(NA )(NA )(NA )(NA )
Estimates ( 11 )NANANANANANANA
(p-val)(NA )(NA )(NA )(NA )(NA )(NA )(NA )
Estimates ( 12 )NANANANANANANA
(p-val)(NA )(NA )(NA )(NA )(NA )(NA )(NA )
Estimates ( 13 )NANANANANANANA
(p-val)(NA )(NA )(NA )(NA )(NA )(NA )(NA )


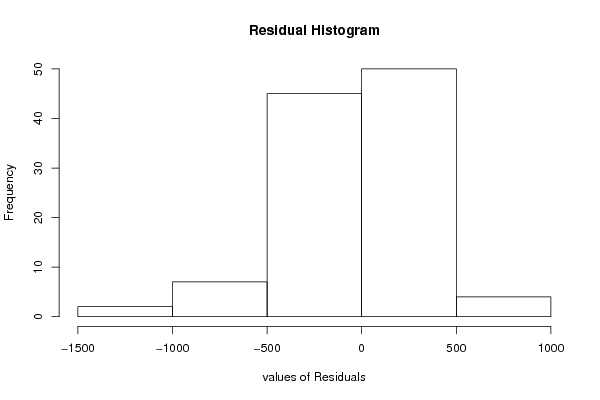
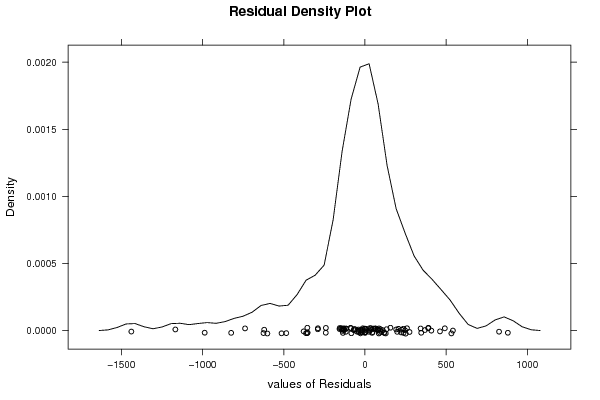
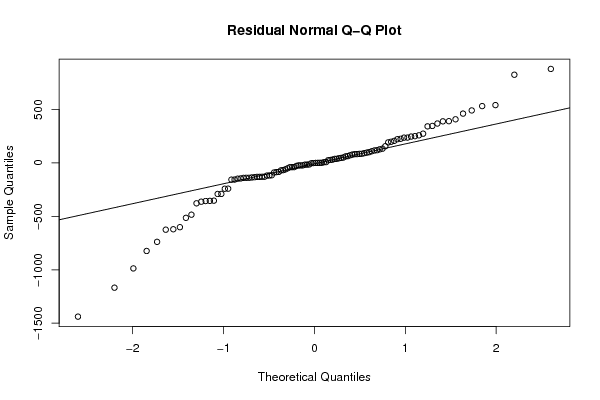
Estimated ARIMA Residuals
Value
-2.5361230066298
-1167.65344382866
409.037833297093
-484.335385279503
462.233836126465
491.91589062608
-620.606733008894
-624.861991159603
-987.123291948008
-290.185696856841
-1438.80942204715
-513.70011518906
-49.6699264223161
25.5802740115895
-240.567492450406
880.261046265739
-133.30678257655
346.612850874244
826.03918715703
-601.153763812746
-738.472822292851
369.263331677508
391.185049215719
-377.568407209139
198.591128893087
-85.4387166899801
-362.695627056203
38.9374268459169
342.955414305597
30.7609074936536
251.026583162897
247.206549565716
-155.684007607392
-156.293510279374
72.1422666020389
101.33897378733
-135.647323207267
-115.124644997036
-128.924206903302
127.857950146494
78.4239489385741
-138.818106618233
157.090224720454
274.451489306187
-353.069574362891
258.96527962996
-354.826813045891
119.573113868617
-39.8267357210079
237.667373294856
389.747127002733
541.764113574675
-824.004022929678
-356.315189820667
-139.762844503442
-22.8717306738063
226.405258152408
-22.4563969556803
236.90758836906
0.833192657066775
-15.977527470925
-69.1829743613444
-88.8020368164003
-289.800544146609
532.498451128331
116.999242258411
206.796847703594
86.1570280886945
-130.298617135054
-14.3568059568465
-145.037059746441
-241.261837746044
-117.777735260283
192.605841915108
-83.8454856723829
222.549922449841
-147.262216870766
96.4987058642123
-117.241987320072
-59.5612061615807
82.1615454104049
109.914089075809
37.8121523966088
-15.4300628974197
-0.674612956086548
-129.987709803081
85.1576050375034
-138.614871153563
83.1200767902337
64.1517289003546
-39.2453952193332
44.1981719056553
-23.1913064905043
28.0638127025568
61.7275206993609
7.21657992872133
-129.082064650182
-27.5300219236974
8.00309690275572
92.0424755653012
-66.8826926135889
47.2634980825451
51.0846926711447
133.536873616195
-39.0402830392595

\begin{tabular}{lllllllll}
\hline
Estimated ARIMA Residuals \tabularnewline
Value \tabularnewline
-2.5361230066298 \tabularnewline
-1167.65344382866 \tabularnewline
409.037833297093 \tabularnewline
-484.335385279503 \tabularnewline
462.233836126465 \tabularnewline
491.91589062608 \tabularnewline
-620.606733008894 \tabularnewline
-624.861991159603 \tabularnewline
-987.123291948008 \tabularnewline
-290.185696856841 \tabularnewline
-1438.80942204715 \tabularnewline
-513.70011518906 \tabularnewline
-49.6699264223161 \tabularnewline
25.5802740115895 \tabularnewline
-240.567492450406 \tabularnewline
880.261046265739 \tabularnewline
-133.30678257655 \tabularnewline
346.612850874244 \tabularnewline
826.03918715703 \tabularnewline
-601.153763812746 \tabularnewline
-738.472822292851 \tabularnewline
369.263331677508 \tabularnewline
391.185049215719 \tabularnewline
-377.568407209139 \tabularnewline
198.591128893087 \tabularnewline
-85.4387166899801 \tabularnewline
-362.695627056203 \tabularnewline
38.9374268459169 \tabularnewline
342.955414305597 \tabularnewline
30.7609074936536 \tabularnewline
251.026583162897 \tabularnewline
247.206549565716 \tabularnewline
-155.684007607392 \tabularnewline
-156.293510279374 \tabularnewline
72.1422666020389 \tabularnewline
101.33897378733 \tabularnewline
-135.647323207267 \tabularnewline
-115.124644997036 \tabularnewline
-128.924206903302 \tabularnewline
127.857950146494 \tabularnewline
78.4239489385741 \tabularnewline
-138.818106618233 \tabularnewline
157.090224720454 \tabularnewline
274.451489306187 \tabularnewline
-353.069574362891 \tabularnewline
258.96527962996 \tabularnewline
-354.826813045891 \tabularnewline
119.573113868617 \tabularnewline
-39.8267357210079 \tabularnewline
237.667373294856 \tabularnewline
389.747127002733 \tabularnewline
541.764113574675 \tabularnewline
-824.004022929678 \tabularnewline
-356.315189820667 \tabularnewline
-139.762844503442 \tabularnewline
-22.8717306738063 \tabularnewline
226.405258152408 \tabularnewline
-22.4563969556803 \tabularnewline
236.90758836906 \tabularnewline
0.833192657066775 \tabularnewline
-15.977527470925 \tabularnewline
-69.1829743613444 \tabularnewline
-88.8020368164003 \tabularnewline
-289.800544146609 \tabularnewline
532.498451128331 \tabularnewline
116.999242258411 \tabularnewline
206.796847703594 \tabularnewline
86.1570280886945 \tabularnewline
-130.298617135054 \tabularnewline
-14.3568059568465 \tabularnewline
-145.037059746441 \tabularnewline
-241.261837746044 \tabularnewline
-117.777735260283 \tabularnewline
192.605841915108 \tabularnewline
-83.8454856723829 \tabularnewline
222.549922449841 \tabularnewline
-147.262216870766 \tabularnewline
96.4987058642123 \tabularnewline
-117.241987320072 \tabularnewline
-59.5612061615807 \tabularnewline
82.1615454104049 \tabularnewline
109.914089075809 \tabularnewline
37.8121523966088 \tabularnewline
-15.4300628974197 \tabularnewline
-0.674612956086548 \tabularnewline
-129.987709803081 \tabularnewline
85.1576050375034 \tabularnewline
-138.614871153563 \tabularnewline
83.1200767902337 \tabularnewline
64.1517289003546 \tabularnewline
-39.2453952193332 \tabularnewline
44.1981719056553 \tabularnewline
-23.1913064905043 \tabularnewline
28.0638127025568 \tabularnewline
61.7275206993609 \tabularnewline
7.21657992872133 \tabularnewline
-129.082064650182 \tabularnewline
-27.5300219236974 \tabularnewline
8.00309690275572 \tabularnewline
92.0424755653012 \tabularnewline
-66.8826926135889 \tabularnewline
47.2634980825451 \tabularnewline
51.0846926711447 \tabularnewline
133.536873616195 \tabularnewline
-39.0402830392595 \tabularnewline
\hline
\end{tabular}
%Source: https://freestatistics.org/blog/index.php?pk=301832&T=2

[TABLE]
[ROW][C]Estimated ARIMA Residuals[/C][/ROW]
[ROW][C]Value[/C][/ROW]
[ROW][C]-2.5361230066298[/C][/ROW]
[ROW][C]-1167.65344382866[/C][/ROW]
[ROW][C]409.037833297093[/C][/ROW]
[ROW][C]-484.335385279503[/C][/ROW]
[ROW][C]462.233836126465[/C][/ROW]
[ROW][C]491.91589062608[/C][/ROW]
[ROW][C]-620.606733008894[/C][/ROW]
[ROW][C]-624.861991159603[/C][/ROW]
[ROW][C]-987.123291948008[/C][/ROW]
[ROW][C]-290.185696856841[/C][/ROW]
[ROW][C]-1438.80942204715[/C][/ROW]
[ROW][C]-513.70011518906[/C][/ROW]
[ROW][C]-49.6699264223161[/C][/ROW]
[ROW][C]25.5802740115895[/C][/ROW]
[ROW][C]-240.567492450406[/C][/ROW]
[ROW][C]880.261046265739[/C][/ROW]
[ROW][C]-133.30678257655[/C][/ROW]
[ROW][C]346.612850874244[/C][/ROW]
[ROW][C]826.03918715703[/C][/ROW]
[ROW][C]-601.153763812746[/C][/ROW]
[ROW][C]-738.472822292851[/C][/ROW]
[ROW][C]369.263331677508[/C][/ROW]
[ROW][C]391.185049215719[/C][/ROW]
[ROW][C]-377.568407209139[/C][/ROW]
[ROW][C]198.591128893087[/C][/ROW]
[ROW][C]-85.4387166899801[/C][/ROW]
[ROW][C]-362.695627056203[/C][/ROW]
[ROW][C]38.9374268459169[/C][/ROW]
[ROW][C]342.955414305597[/C][/ROW]
[ROW][C]30.7609074936536[/C][/ROW]
[ROW][C]251.026583162897[/C][/ROW]
[ROW][C]247.206549565716[/C][/ROW]
[ROW][C]-155.684007607392[/C][/ROW]
[ROW][C]-156.293510279374[/C][/ROW]
[ROW][C]72.1422666020389[/C][/ROW]
[ROW][C]101.33897378733[/C][/ROW]
[ROW][C]-135.647323207267[/C][/ROW]
[ROW][C]-115.124644997036[/C][/ROW]
[ROW][C]-128.924206903302[/C][/ROW]
[ROW][C]127.857950146494[/C][/ROW]
[ROW][C]78.4239489385741[/C][/ROW]
[ROW][C]-138.818106618233[/C][/ROW]
[ROW][C]157.090224720454[/C][/ROW]
[ROW][C]274.451489306187[/C][/ROW]
[ROW][C]-353.069574362891[/C][/ROW]
[ROW][C]258.96527962996[/C][/ROW]
[ROW][C]-354.826813045891[/C][/ROW]
[ROW][C]119.573113868617[/C][/ROW]
[ROW][C]-39.8267357210079[/C][/ROW]
[ROW][C]237.667373294856[/C][/ROW]
[ROW][C]389.747127002733[/C][/ROW]
[ROW][C]541.764113574675[/C][/ROW]
[ROW][C]-824.004022929678[/C][/ROW]
[ROW][C]-356.315189820667[/C][/ROW]
[ROW][C]-139.762844503442[/C][/ROW]
[ROW][C]-22.8717306738063[/C][/ROW]
[ROW][C]226.405258152408[/C][/ROW]
[ROW][C]-22.4563969556803[/C][/ROW]
[ROW][C]236.90758836906[/C][/ROW]
[ROW][C]0.833192657066775[/C][/ROW]
[ROW][C]-15.977527470925[/C][/ROW]
[ROW][C]-69.1829743613444[/C][/ROW]
[ROW][C]-88.8020368164003[/C][/ROW]
[ROW][C]-289.800544146609[/C][/ROW]
[ROW][C]532.498451128331[/C][/ROW]
[ROW][C]116.999242258411[/C][/ROW]
[ROW][C]206.796847703594[/C][/ROW]
[ROW][C]86.1570280886945[/C][/ROW]
[ROW][C]-130.298617135054[/C][/ROW]
[ROW][C]-14.3568059568465[/C][/ROW]
[ROW][C]-145.037059746441[/C][/ROW]
[ROW][C]-241.261837746044[/C][/ROW]
[ROW][C]-117.777735260283[/C][/ROW]
[ROW][C]192.605841915108[/C][/ROW]
[ROW][C]-83.8454856723829[/C][/ROW]
[ROW][C]222.549922449841[/C][/ROW]
[ROW][C]-147.262216870766[/C][/ROW]
[ROW][C]96.4987058642123[/C][/ROW]
[ROW][C]-117.241987320072[/C][/ROW]
[ROW][C]-59.5612061615807[/C][/ROW]
[ROW][C]82.1615454104049[/C][/ROW]
[ROW][C]109.914089075809[/C][/ROW]
[ROW][C]37.8121523966088[/C][/ROW]
[ROW][C]-15.4300628974197[/C][/ROW]
[ROW][C]-0.674612956086548[/C][/ROW]
[ROW][C]-129.987709803081[/C][/ROW]
[ROW][C]85.1576050375034[/C][/ROW]
[ROW][C]-138.614871153563[/C][/ROW]
[ROW][C]83.1200767902337[/C][/ROW]
[ROW][C]64.1517289003546[/C][/ROW]
[ROW][C]-39.2453952193332[/C][/ROW]
[ROW][C]44.1981719056553[/C][/ROW]
[ROW][C]-23.1913064905043[/C][/ROW]
[ROW][C]28.0638127025568[/C][/ROW]
[ROW][C]61.7275206993609[/C][/ROW]
[ROW][C]7.21657992872133[/C][/ROW]
[ROW][C]-129.082064650182[/C][/ROW]
[ROW][C]-27.5300219236974[/C][/ROW]
[ROW][C]8.00309690275572[/C][/ROW]
[ROW][C]92.0424755653012[/C][/ROW]
[ROW][C]-66.8826926135889[/C][/ROW]
[ROW][C]47.2634980825451[/C][/ROW]
[ROW][C]51.0846926711447[/C][/ROW]
[ROW][C]133.536873616195[/C][/ROW]
[ROW][C]-39.0402830392595[/C][/ROW]
[/TABLE]
Source: https://freestatistics.org/blog/index.php?pk=301832&T=2

Globally Unique Identifier (entire table): ba.freestatistics.org/blog/index.php?pk=301832&T=2

As an alternative you can also use a QR Code:  

The GUIDs for individual cells are displayed in the table below:

Estimated ARIMA Residuals
Value
-2.5361230066298
-1167.65344382866
409.037833297093
-484.335385279503
462.233836126465
491.91589062608
-620.606733008894
-624.861991159603
-987.123291948008
-290.185696856841
-1438.80942204715
-513.70011518906
-49.6699264223161
25.5802740115895
-240.567492450406
880.261046265739
-133.30678257655
346.612850874244
826.03918715703
-601.153763812746
-738.472822292851
369.263331677508
391.185049215719
-377.568407209139
198.591128893087
-85.4387166899801
-362.695627056203
38.9374268459169
342.955414305597
30.7609074936536
251.026583162897
247.206549565716
-155.684007607392
-156.293510279374
72.1422666020389
101.33897378733
-135.647323207267
-115.124644997036
-128.924206903302
127.857950146494
78.4239489385741
-138.818106618233
157.090224720454
274.451489306187
-353.069574362891
258.96527962996
-354.826813045891
119.573113868617
-39.8267357210079
237.667373294856
389.747127002733
541.764113574675
-824.004022929678
-356.315189820667
-139.762844503442
-22.8717306738063
226.405258152408
-22.4563969556803
236.90758836906
0.833192657066775
-15.977527470925
-69.1829743613444
-88.8020368164003
-289.800544146609
532.498451128331
116.999242258411
206.796847703594
86.1570280886945
-130.298617135054
-14.3568059568465
-145.037059746441
-241.261837746044
-117.777735260283
192.605841915108
-83.8454856723829
222.549922449841
-147.262216870766
96.4987058642123
-117.241987320072
-59.5612061615807
82.1615454104049
109.914089075809
37.8121523966088
-15.4300628974197
-0.674612956086548
-129.987709803081
85.1576050375034
-138.614871153563
83.1200767902337
64.1517289003546
-39.2453952193332
44.1981719056553
-23.1913064905043
28.0638127025568
61.7275206993609
7.21657992872133
-129.082064650182
-27.5300219236974
8.00309690275572
92.0424755653012
-66.8826926135889
47.2634980825451
51.0846926711447
133.536873616195
-39.0402830392595


Parameters (Session):
par1 = FALSE ; par2 = 1 ; par3 = 1 ; par4 = 1 ; par5 = 3 ; par6 = 3 ; par7 = 1 ; par8 = 2 ; par9 = 1 ;
Parameters (R input):
par1 = FALSE ; par2 = 1 ; par3 = 1 ; par4 = 1 ; par5 = 3 ; par6 = 3 ; par7 = 1 ; par8 = 2 ; par9 = 1 ;
R code (references can be found in the software module):
library(lattice)
if (par1 == 'TRUE') par1 <- TRUE
if (par1 == 'FALSE') par1 <- FALSE
par2 <- as.numeric(par2) #Box-Cox lambda transformation parameter
par3 <- as.numeric(par3) #degree of non-seasonal differencing
par4 <- as.numeric(par4) #degree of seasonal differencing
par5 <- as.numeric(par5) #seasonal period
par6 <- as.numeric(par6) #degree (p) of the non-seasonal AR(p) polynomial
par7 <- as.numeric(par7) #degree (q) of the non-seasonal MA(q) polynomial
par8 <- as.numeric(par8) #degree (P) of the seasonal AR(P) polynomial
par9 <- as.numeric(par9) #degree (Q) of the seasonal MA(Q) polynomial
armaGR <- function(arima.out, names, n){
try1 <- arima.out$coef
try2 <- sqrt(diag(arima.out$var.coef))
try.data.frame <- data.frame(matrix(NA,ncol=4,nrow=length(names)))
dimnames(try.data.frame) <- list(names,c('coef','std','tstat','pv'))
try.data.frame[,1] <- try1
for(i in 1:length(try2)) try.data.frame[which(rownames(try.data.frame)==names(try2)[i]),2] <- try2[i]
try.data.frame[,3] <- try.data.frame[,1] / try.data.frame[,2]
try.data.frame[,4] <- round((1-pt(abs(try.data.frame[,3]),df=n-(length(try2)+1)))*2,5)
vector <- rep(NA,length(names))
vector[is.na(try.data.frame[,4])] <- 0
maxi <- which.max(try.data.frame[,4])
continue <- max(try.data.frame[,4],na.rm=TRUE) > .05
vector[maxi] <- 0
list(summary=try.data.frame,next.vector=vector,continue=continue)
}
arimaSelect <- function(series, order=c(13,0,0), seasonal=list(order=c(2,0,0),period=12), include.mean=F){
nrc <- order[1]+order[3]+seasonal$order[1]+seasonal$order[3]
coeff <- matrix(NA, nrow=nrc*2, ncol=nrc)
pval <- matrix(NA, nrow=nrc*2, ncol=nrc)
mylist <- rep(list(NULL), nrc)
names <- NULL
if(order[1] > 0) names <- paste('ar',1:order[1],sep='')
if(order[3] > 0) names <- c( names , paste('ma',1:order[3],sep='') )
if(seasonal$order[1] > 0) names <- c(names, paste('sar',1:seasonal$order[1],sep=''))
if(seasonal$order[3] > 0) names <- c(names, paste('sma',1:seasonal$order[3],sep=''))
arima.out <- arima(series, order=order, seasonal=seasonal, include.mean=include.mean, method='ML')
mylist[[1]] <- arima.out
last.arma <- armaGR(arima.out, names, length(series))
mystop <- FALSE
i <- 1
coeff[i,] <- last.arma[[1]][,1]
pval [i,] <- last.arma[[1]][,4]
i <- 2
aic <- arima.out$aic
while(!mystop){
mylist[[i]] <- arima.out
arima.out <- arima(series, order=order, seasonal=seasonal, include.mean=include.mean, method='ML', fixed=last.arma$next.vector)
aic <- c(aic, arima.out$aic)
last.arma <- armaGR(arima.out, names, length(series))
mystop <- !last.arma$continue
coeff[i,] <- last.arma[[1]][,1]
pval [i,] <- last.arma[[1]][,4]
i <- i+1
}
list(coeff, pval, mylist, aic=aic)
}
arimaSelectplot <- function(arimaSelect.out,noms,choix){
noms <- names(arimaSelect.out[[3]][[1]]$coef)
coeff <- arimaSelect.out[[1]]
k <- min(which(is.na(coeff[,1])))-1
coeff <- coeff[1:k,]
pval <- arimaSelect.out[[2]][1:k,]
aic <- arimaSelect.out$aic[1:k]
coeff[coeff==0] <- NA
n <- ncol(coeff)
if(missing(choix)) choix <- k
layout(matrix(c(1,1,1,2,
3,3,3,2,
3,3,3,4,
5,6,7,7),nr=4),
widths=c(10,35,45,15),
heights=c(30,30,15,15))
couleurs <- rainbow(75)[1:50]#(50)
ticks <- pretty(coeff)
par(mar=c(1,1,3,1))
plot(aic,k:1-.5,type='o',pch=21,bg='blue',cex=2,axes=F,lty=2,xpd=NA)
points(aic[choix],k-choix+.5,pch=21,cex=4,bg=2,xpd=NA)
title('aic',line=2)
par(mar=c(3,0,0,0))
plot(0,axes=F,xlab='',ylab='',xlim=range(ticks),ylim=c(.1,1))
rect(xleft = min(ticks) + (0:49)/50*(max(ticks)-min(ticks)),
xright = min(ticks) + (1:50)/50*(max(ticks)-min(ticks)),
ytop = rep(1,50),
ybottom= rep(0,50),col=couleurs,border=NA)
axis(1,ticks)
rect(xleft=min(ticks),xright=max(ticks),ytop=1,ybottom=0)
text(mean(coeff,na.rm=T),.5,'coefficients',cex=2,font=2)
par(mar=c(1,1,3,1))
image(1:n,1:k,t(coeff[k:1,]),axes=F,col=couleurs,zlim=range(ticks))
for(i in 1:n) for(j in 1:k) if(!is.na(coeff[j,i])) {
if(pval[j,i]<.01) symb = 'green'
else if( (pval[j,i]<.05) & (pval[j,i]>=.01)) symb = 'orange'
else if( (pval[j,i]<.1) & (pval[j,i]>=.05)) symb = 'red'
else symb = 'black'
polygon(c(i+.5 ,i+.2 ,i+.5 ,i+.5),
c(k-j+0.5,k-j+0.5,k-j+0.8,k-j+0.5),
col=symb)
if(j==choix) {
rect(xleft=i-.5,
xright=i+.5,
ybottom=k-j+1.5,
ytop=k-j+.5,
lwd=4)
text(i,
k-j+1,
round(coeff[j,i],2),
cex=1.2,
font=2)
}
else{
rect(xleft=i-.5,xright=i+.5,ybottom=k-j+1.5,ytop=k-j+.5)
text(i,k-j+1,round(coeff[j,i],2),cex=1.2,font=1)
}
}
axis(3,1:n,noms)
par(mar=c(0.5,0,0,0.5))
plot(0,axes=F,xlab='',ylab='',type='n',xlim=c(0,8),ylim=c(-.2,.8))
cols <- c('green','orange','red','black')
niv <- c('0','0.01','0.05','0.1')
for(i in 0:3){
polygon(c(1+2*i ,1+2*i ,1+2*i-.5 ,1+2*i),
c(.4 ,.7 , .4 , .4),
col=cols[i+1])
text(2*i,0.5,niv[i+1],cex=1.5)
}
text(8,.5,1,cex=1.5)
text(4,0,'p-value',cex=2)
box()
residus <- arimaSelect.out[[3]][[choix]]$res
par(mar=c(1,2,4,1))
acf(residus,main='')
title('acf',line=.5)
par(mar=c(1,2,4,1))
pacf(residus,main='')
title('pacf',line=.5)
par(mar=c(2,2,4,1))
qqnorm(residus,main='')
title('qq-norm',line=.5)
qqline(residus)
residus
}
if (par2 == 0) x <- log(x)
if (par2 != 0) x <- x^par2
(selection <- arimaSelect(x, order=c(par6,par3,par7), seasonal=list(order=c(par8,par4,par9), period=par5)))
bitmap(file='test1.png')
resid <- arimaSelectplot(selection)
dev.off()
resid
bitmap(file='test2.png')
acf(resid,length(resid)/2, main='Residual Autocorrelation Function')
dev.off()
bitmap(file='test3.png')
pacf(resid,length(resid)/2, main='Residual Partial Autocorrelation Function')
dev.off()
bitmap(file='test4.png')
cpgram(resid, main='Residual Cumulative Periodogram')
dev.off()
bitmap(file='test5.png')
hist(resid, main='Residual Histogram', xlab='values of Residuals')
dev.off()
bitmap(file='test6.png')
densityplot(~resid,col='black',main='Residual Density Plot', xlab='values of Residuals')
dev.off()
bitmap(file='test7.png')
qqnorm(resid, main='Residual Normal Q-Q Plot')
qqline(resid)
dev.off()
ncols <- length(selection[[1]][1,])
nrows <- length(selection[[2]][,1])-1
load(file='createtable')
a<-table.start()
a<-table.row.start(a)
a<-table.element(a,'ARIMA Parameter Estimation and Backward Selection', ncols+1,TRUE)
a<-table.row.end(a)
a<-table.row.start(a)
a<-table.element(a,'Iteration', header=TRUE)
for (i in 1:ncols) {
a<-table.element(a,names(selection[[3]][[1]]$coef)[i],header=TRUE)
}
a<-table.row.end(a)
for (j in 1:nrows) {
a<-table.row.start(a)
mydum <- 'Estimates ('
mydum <- paste(mydum,j)
mydum <- paste(mydum,')')
a<-table.element(a,mydum, header=TRUE)
for (i in 1:ncols) {
a<-table.element(a,round(selection[[1]][j,i],4))
}
a<-table.row.end(a)
a<-table.row.start(a)
a<-table.element(a,'(p-val)', header=TRUE)
for (i in 1:ncols) {
mydum <- '('
mydum <- paste(mydum,round(selection[[2]][j,i],4),sep='')
mydum <- paste(mydum,')')
a<-table.element(a,mydum)
}
a<-table.row.end(a)
}
a<-table.end(a)
table.save(a,file='mytable.tab')
a<-table.start()
a<-table.row.start(a)
a<-table.element(a,'Estimated ARIMA Residuals', 1,TRUE)
a<-table.row.end(a)
a<-table.row.start(a)
a<-table.element(a,'Value', 1,TRUE)
a<-table.row.end(a)
for (i in (par4*par5+par3):length(resid)) {
a<-table.row.start(a)
a<-table.element(a,resid[i])
a<-table.row.end(a)
}
a<-table.end(a)
table.save(a,file='mytable1.tab')