Free Statistics

of Irreproducible Research!

Author's title

Author*The author of this computation has been verified*
R Software Modulerwasp_autocorrelation.wasp
Title produced by software(Partial) Autocorrelation Function
Date of computationWed, 21 Dec 2016 02:49:15 +0100
Cite this page as followsStatistical Computations at FreeStatistics.org, Office for Research Development and Education, URL https://freestatistics.org/blog/index.php?v=date/2016/Dec/21/t14822849735n00nizssx5aq9v.htm/, Retrieved Mon, 06 May 2024 21:30:54 +0000
Statistical Computations at FreeStatistics.org, Office for Research Development and Education, URL https://freestatistics.org/blog/index.php?pk=301842, Retrieved Mon, 06 May 2024 21:30:54 +0000
QR Codes:

Original text written by user:
IsPrivate?No (this computation is public)
User-defined keywords
Estimated Impact85
Family? (F = Feedback message, R = changed R code, M = changed R Module, P = changed Parameters, D = changed Data)
-       [(Partial) Autocorrelation Function] [] [2016-12-21 01:49:15] [361c8dad91b3f1ef2e651cd04783c23b] [Current]
Feedback Forum

Post a new message
Dataseries X:
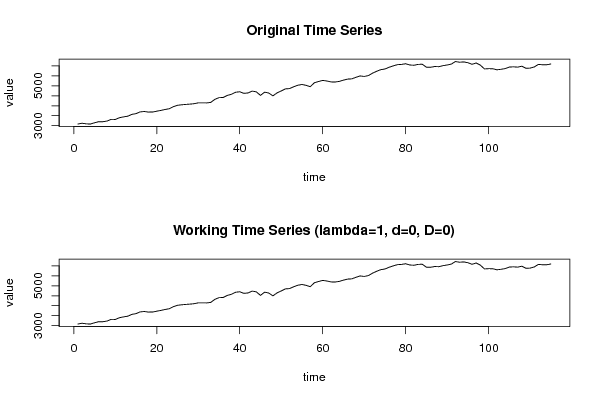
3082.8
3122.55
3092.15
3081
3146.5
3199.55
3198.7
3232.75
3316
3312.5
3398.5
3442.8
3475.85
3567.8
3605.3
3692.5
3711.25
3682.65
3684.2
3727.6
3766.5
3813.35
3849.45
3953.7
4023.9
4049
4067.85
4082.35
4104.2
4145.55
4146.55
4142.15
4168.2
4320.8
4408.2
4415.75
4520.65
4575.15
4679.45
4702.6
4623.3
4644.2
4737.45
4697.75
4521.1
4684.45
4638.7
4499.15
4646.65
4744.25
4848.45
4861.7
4954.4
5030.55
5068.35
5027.1
4957.3
5156.45
5218
5274.05
5243.5
5198.25
5192.95
5223.25
5287.25
5338.9
5350.9
5427.75
5498.3
5472.65
5514.55
5634.5
5732.6
5812.55
5846.8
5933.4
6002
6064.1
6077.35
6110.35
6047.95
6034.65
6078
6085.8
5938.15
5933.35
5971.6
5962.25
6013.15
6048.85
6092.85
6221.15
6186.8
6202.1
6163.5
6083.3
6147.2
6042.3
5849.45
5863.5
5860.95
5805.75
5832.5
5866.4
5943.6
5956.6
5939.3
5986.95
5881.6
5891
5948.65
6078.75
6058.8
6059.85
6097.95


Summary of computational transaction
Raw Input view raw input (R code)
Raw Outputview raw output of R engine
Computing time1 seconds
R ServerBig Analytics Cloud Computing Center

\begin{tabular}{lllllllll}
\hline
Summary of computational transaction \tabularnewline
Raw Input view raw input (R code)  \tabularnewline
Raw Outputview raw output of R engine  \tabularnewline
Computing time1 seconds \tabularnewline
R ServerBig Analytics Cloud Computing Center \tabularnewline
\hline
\end{tabular}
%Source: https://freestatistics.org/blog/index.php?pk=301842&T=0

[TABLE]
[ROW]
Summary of computational transaction[/C][/ROW] [ROW]Raw Input[/C] view raw input (R code) [/C][/ROW] [ROW]Raw Output[/C]view raw output of R engine [/C][/ROW] [ROW]Computing time[/C]1 seconds[/C][/ROW] [ROW]R Server[/C]Big Analytics Cloud Computing Center[/C][/ROW] [/TABLE] Source: https://freestatistics.org/blog/index.php?pk=301842&T=0

Globally Unique Identifier (entire table): ba.freestatistics.org/blog/index.php?pk=301842&T=0

As an alternative you can also use a QR Code:  

The GUIDs for individual cells are displayed in the table below:

Summary of computational transaction
Raw Input view raw input (R code)
Raw Outputview raw output of R engine
Computing time1 seconds
R ServerBig Analytics Cloud Computing Center


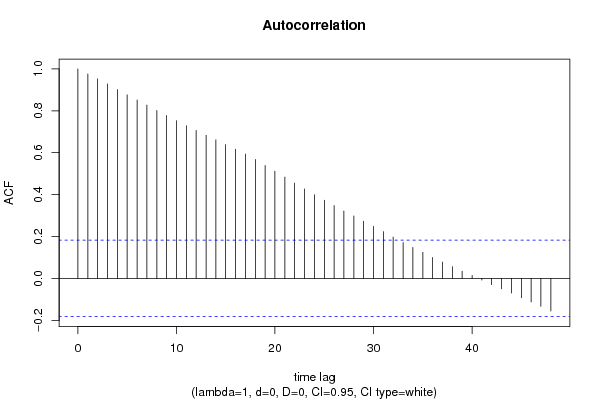
Autocorrelation Function
Time lag kACF(k)T-STATP-value
10.97627310.46940
20.95247510.21420
30.9279839.95150
40.9014869.66740
50.8762729.3970
60.8518889.13550
70.8274288.87320
80.8028.60050
90.7778278.34130
100.7526928.07170
110.7288147.81570
120.7058377.56930
130.682997.32420
140.6615687.09450
150.6388436.85080
160.616226.60820
170.593216.36150
180.567276.08330
190.5393155.78350
200.5117765.48820
210.4834355.18430
220.4549764.87912e-06
230.4266484.57536e-06
240.3989994.27882e-05
250.3732084.00225.6e-05
260.3475193.72670.000151
270.3219963.4530.000388
280.29753.19030.000916
290.2727122.92450.002078
300.248182.66140.004447
310.2233982.39570.009102
320.1970372.1130.018383
330.170881.83250.034733
340.1472621.57920.058517
350.1240661.33050.092999
360.1000131.07250.142867
370.0778040.83440.202906
380.0554680.59480.276564
390.0343660.36850.356577
400.0137070.1470.441697
41-0.008188-0.08780.465091
42-0.029962-0.32130.37428
43-0.049881-0.53490.296873
44-0.070074-0.75150.226956
45-0.092552-0.99250.161515
46-0.112199-1.20320.115684
47-0.133098-1.42730.078099
48-0.15577-1.67050.048775

\begin{tabular}{lllllllll}
\hline
Autocorrelation Function \tabularnewline
Time lag k & ACF(k) & T-STAT & P-value \tabularnewline
1 & 0.976273 & 10.4694 & 0 \tabularnewline
2 & 0.952475 & 10.2142 & 0 \tabularnewline
3 & 0.927983 & 9.9515 & 0 \tabularnewline
4 & 0.901486 & 9.6674 & 0 \tabularnewline
5 & 0.876272 & 9.397 & 0 \tabularnewline
6 & 0.851888 & 9.1355 & 0 \tabularnewline
7 & 0.827428 & 8.8732 & 0 \tabularnewline
8 & 0.802 & 8.6005 & 0 \tabularnewline
9 & 0.777827 & 8.3413 & 0 \tabularnewline
10 & 0.752692 & 8.0717 & 0 \tabularnewline
11 & 0.728814 & 7.8157 & 0 \tabularnewline
12 & 0.705837 & 7.5693 & 0 \tabularnewline
13 & 0.68299 & 7.3242 & 0 \tabularnewline
14 & 0.661568 & 7.0945 & 0 \tabularnewline
15 & 0.638843 & 6.8508 & 0 \tabularnewline
16 & 0.61622 & 6.6082 & 0 \tabularnewline
17 & 0.59321 & 6.3615 & 0 \tabularnewline
18 & 0.56727 & 6.0833 & 0 \tabularnewline
19 & 0.539315 & 5.7835 & 0 \tabularnewline
20 & 0.511776 & 5.4882 & 0 \tabularnewline
21 & 0.483435 & 5.1843 & 0 \tabularnewline
22 & 0.454976 & 4.8791 & 2e-06 \tabularnewline
23 & 0.426648 & 4.5753 & 6e-06 \tabularnewline
24 & 0.398999 & 4.2788 & 2e-05 \tabularnewline
25 & 0.373208 & 4.0022 & 5.6e-05 \tabularnewline
26 & 0.347519 & 3.7267 & 0.000151 \tabularnewline
27 & 0.321996 & 3.453 & 0.000388 \tabularnewline
28 & 0.2975 & 3.1903 & 0.000916 \tabularnewline
29 & 0.272712 & 2.9245 & 0.002078 \tabularnewline
30 & 0.24818 & 2.6614 & 0.004447 \tabularnewline
31 & 0.223398 & 2.3957 & 0.009102 \tabularnewline
32 & 0.197037 & 2.113 & 0.018383 \tabularnewline
33 & 0.17088 & 1.8325 & 0.034733 \tabularnewline
34 & 0.147262 & 1.5792 & 0.058517 \tabularnewline
35 & 0.124066 & 1.3305 & 0.092999 \tabularnewline
36 & 0.100013 & 1.0725 & 0.142867 \tabularnewline
37 & 0.077804 & 0.8344 & 0.202906 \tabularnewline
38 & 0.055468 & 0.5948 & 0.276564 \tabularnewline
39 & 0.034366 & 0.3685 & 0.356577 \tabularnewline
40 & 0.013707 & 0.147 & 0.441697 \tabularnewline
41 & -0.008188 & -0.0878 & 0.465091 \tabularnewline
42 & -0.029962 & -0.3213 & 0.37428 \tabularnewline
43 & -0.049881 & -0.5349 & 0.296873 \tabularnewline
44 & -0.070074 & -0.7515 & 0.226956 \tabularnewline
45 & -0.092552 & -0.9925 & 0.161515 \tabularnewline
46 & -0.112199 & -1.2032 & 0.115684 \tabularnewline
47 & -0.133098 & -1.4273 & 0.078099 \tabularnewline
48 & -0.15577 & -1.6705 & 0.048775 \tabularnewline
\hline
\end{tabular}
%Source: https://freestatistics.org/blog/index.php?pk=301842&T=1

[TABLE]
[ROW][C]Autocorrelation Function[/C][/ROW]
[ROW][C]Time lag k[/C][C]ACF(k)[/C][C]T-STAT[/C][C]P-value[/C][/ROW]
[ROW][C]1[/C][C]0.976273[/C][C]10.4694[/C][C]0[/C][/ROW]
[ROW][C]2[/C][C]0.952475[/C][C]10.2142[/C][C]0[/C][/ROW]
[ROW][C]3[/C][C]0.927983[/C][C]9.9515[/C][C]0[/C][/ROW]
[ROW][C]4[/C][C]0.901486[/C][C]9.6674[/C][C]0[/C][/ROW]
[ROW][C]5[/C][C]0.876272[/C][C]9.397[/C][C]0[/C][/ROW]
[ROW][C]6[/C][C]0.851888[/C][C]9.1355[/C][C]0[/C][/ROW]
[ROW][C]7[/C][C]0.827428[/C][C]8.8732[/C][C]0[/C][/ROW]
[ROW][C]8[/C][C]0.802[/C][C]8.6005[/C][C]0[/C][/ROW]
[ROW][C]9[/C][C]0.777827[/C][C]8.3413[/C][C]0[/C][/ROW]
[ROW][C]10[/C][C]0.752692[/C][C]8.0717[/C][C]0[/C][/ROW]
[ROW][C]11[/C][C]0.728814[/C][C]7.8157[/C][C]0[/C][/ROW]
[ROW][C]12[/C][C]0.705837[/C][C]7.5693[/C][C]0[/C][/ROW]
[ROW][C]13[/C][C]0.68299[/C][C]7.3242[/C][C]0[/C][/ROW]
[ROW][C]14[/C][C]0.661568[/C][C]7.0945[/C][C]0[/C][/ROW]
[ROW][C]15[/C][C]0.638843[/C][C]6.8508[/C][C]0[/C][/ROW]
[ROW][C]16[/C][C]0.61622[/C][C]6.6082[/C][C]0[/C][/ROW]
[ROW][C]17[/C][C]0.59321[/C][C]6.3615[/C][C]0[/C][/ROW]
[ROW][C]18[/C][C]0.56727[/C][C]6.0833[/C][C]0[/C][/ROW]
[ROW][C]19[/C][C]0.539315[/C][C]5.7835[/C][C]0[/C][/ROW]
[ROW][C]20[/C][C]0.511776[/C][C]5.4882[/C][C]0[/C][/ROW]
[ROW][C]21[/C][C]0.483435[/C][C]5.1843[/C][C]0[/C][/ROW]
[ROW][C]22[/C][C]0.454976[/C][C]4.8791[/C][C]2e-06[/C][/ROW]
[ROW][C]23[/C][C]0.426648[/C][C]4.5753[/C][C]6e-06[/C][/ROW]
[ROW][C]24[/C][C]0.398999[/C][C]4.2788[/C][C]2e-05[/C][/ROW]
[ROW][C]25[/C][C]0.373208[/C][C]4.0022[/C][C]5.6e-05[/C][/ROW]
[ROW][C]26[/C][C]0.347519[/C][C]3.7267[/C][C]0.000151[/C][/ROW]
[ROW][C]27[/C][C]0.321996[/C][C]3.453[/C][C]0.000388[/C][/ROW]
[ROW][C]28[/C][C]0.2975[/C][C]3.1903[/C][C]0.000916[/C][/ROW]
[ROW][C]29[/C][C]0.272712[/C][C]2.9245[/C][C]0.002078[/C][/ROW]
[ROW][C]30[/C][C]0.24818[/C][C]2.6614[/C][C]0.004447[/C][/ROW]
[ROW][C]31[/C][C]0.223398[/C][C]2.3957[/C][C]0.009102[/C][/ROW]
[ROW][C]32[/C][C]0.197037[/C][C]2.113[/C][C]0.018383[/C][/ROW]
[ROW][C]33[/C][C]0.17088[/C][C]1.8325[/C][C]0.034733[/C][/ROW]
[ROW][C]34[/C][C]0.147262[/C][C]1.5792[/C][C]0.058517[/C][/ROW]
[ROW][C]35[/C][C]0.124066[/C][C]1.3305[/C][C]0.092999[/C][/ROW]
[ROW][C]36[/C][C]0.100013[/C][C]1.0725[/C][C]0.142867[/C][/ROW]
[ROW][C]37[/C][C]0.077804[/C][C]0.8344[/C][C]0.202906[/C][/ROW]
[ROW][C]38[/C][C]0.055468[/C][C]0.5948[/C][C]0.276564[/C][/ROW]
[ROW][C]39[/C][C]0.034366[/C][C]0.3685[/C][C]0.356577[/C][/ROW]
[ROW][C]40[/C][C]0.013707[/C][C]0.147[/C][C]0.441697[/C][/ROW]
[ROW][C]41[/C][C]-0.008188[/C][C]-0.0878[/C][C]0.465091[/C][/ROW]
[ROW][C]42[/C][C]-0.029962[/C][C]-0.3213[/C][C]0.37428[/C][/ROW]
[ROW][C]43[/C][C]-0.049881[/C][C]-0.5349[/C][C]0.296873[/C][/ROW]
[ROW][C]44[/C][C]-0.070074[/C][C]-0.7515[/C][C]0.226956[/C][/ROW]
[ROW][C]45[/C][C]-0.092552[/C][C]-0.9925[/C][C]0.161515[/C][/ROW]
[ROW][C]46[/C][C]-0.112199[/C][C]-1.2032[/C][C]0.115684[/C][/ROW]
[ROW][C]47[/C][C]-0.133098[/C][C]-1.4273[/C][C]0.078099[/C][/ROW]
[ROW][C]48[/C][C]-0.15577[/C][C]-1.6705[/C][C]0.048775[/C][/ROW]
[/TABLE]
Source: https://freestatistics.org/blog/index.php?pk=301842&T=1

Globally Unique Identifier (entire table): ba.freestatistics.org/blog/index.php?pk=301842&T=1

As an alternative you can also use a QR Code:  

The GUIDs for individual cells are displayed in the table below:

Autocorrelation Function
Time lag kACF(k)T-STATP-value
10.97627310.46940
20.95247510.21420
30.9279839.95150
40.9014869.66740
50.8762729.3970
60.8518889.13550
70.8274288.87320
80.8028.60050
90.7778278.34130
100.7526928.07170
110.7288147.81570
120.7058377.56930
130.682997.32420
140.6615687.09450
150.6388436.85080
160.616226.60820
170.593216.36150
180.567276.08330
190.5393155.78350
200.5117765.48820
210.4834355.18430
220.4549764.87912e-06
230.4266484.57536e-06
240.3989994.27882e-05
250.3732084.00225.6e-05
260.3475193.72670.000151
270.3219963.4530.000388
280.29753.19030.000916
290.2727122.92450.002078
300.248182.66140.004447
310.2233982.39570.009102
320.1970372.1130.018383
330.170881.83250.034733
340.1472621.57920.058517
350.1240661.33050.092999
360.1000131.07250.142867
370.0778040.83440.202906
380.0554680.59480.276564
390.0343660.36850.356577
400.0137070.1470.441697
41-0.008188-0.08780.465091
42-0.029962-0.32130.37428
43-0.049881-0.53490.296873
44-0.070074-0.75150.226956
45-0.092552-0.99250.161515
46-0.112199-1.20320.115684
47-0.133098-1.42730.078099
48-0.15577-1.67050.048775


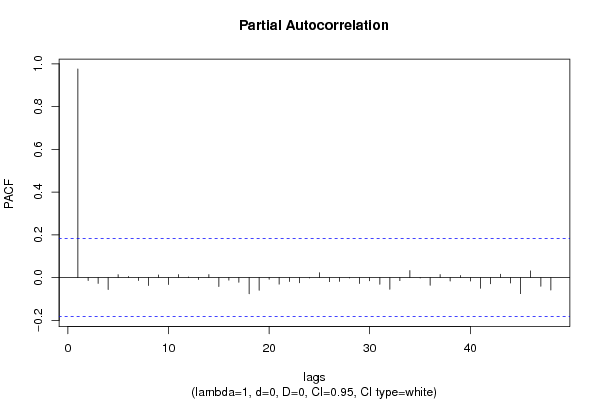
Partial Autocorrelation Function
Time lag kPACF(k)T-STATP-value
10.97627310.46940
2-0.01351-0.14490.442529
3-0.027001-0.28960.38634
4-0.055468-0.59480.276562
50.0137770.14770.441402
60.0054910.05890.476575
7-0.013838-0.14840.441147
8-0.036966-0.39640.346265
90.0120820.12960.448571
10-0.032559-0.34920.363804
110.0140470.15060.440262
120.0025210.0270.489239
13-0.009273-0.09940.460481
140.0139620.14970.44062
15-0.041481-0.44480.328639
16-0.011941-0.12810.449166
17-0.021746-0.23320.408011
18-0.075721-0.8120.209228
19-0.05939-0.63690.262732
20-0.00799-0.08570.465933
21-0.03071-0.32930.371253
22-0.018466-0.1980.421689
23-0.023849-0.25570.399302
24-0.001615-0.01730.493106
250.022340.23960.405546
26-0.019077-0.20460.419131
27-0.017769-0.19060.424606
28-0.001572-0.01690.493288
29-0.027536-0.29530.384152
30-0.015062-0.16150.435981
31-0.031392-0.33660.368499
32-0.054489-0.58430.280071
33-0.014298-0.15330.439203
340.0326890.35050.363285
35-0.002168-0.02330.490745
36-0.0355-0.38070.352066
370.0138570.14860.441066
38-0.015949-0.1710.432248
390.0101930.10930.456577
40-0.015878-0.17030.432546
41-0.050106-0.53730.296039
42-0.028603-0.30670.379803
430.0156010.16730.433715
44-0.025662-0.27520.391831
45-0.075144-0.80580.211003
460.0313010.33570.368866
47-0.040604-0.43540.332033
48-0.058362-0.62590.266324

\begin{tabular}{lllllllll}
\hline
Partial Autocorrelation Function \tabularnewline
Time lag k & PACF(k) & T-STAT & P-value \tabularnewline
1 & 0.976273 & 10.4694 & 0 \tabularnewline
2 & -0.01351 & -0.1449 & 0.442529 \tabularnewline
3 & -0.027001 & -0.2896 & 0.38634 \tabularnewline
4 & -0.055468 & -0.5948 & 0.276562 \tabularnewline
5 & 0.013777 & 0.1477 & 0.441402 \tabularnewline
6 & 0.005491 & 0.0589 & 0.476575 \tabularnewline
7 & -0.013838 & -0.1484 & 0.441147 \tabularnewline
8 & -0.036966 & -0.3964 & 0.346265 \tabularnewline
9 & 0.012082 & 0.1296 & 0.448571 \tabularnewline
10 & -0.032559 & -0.3492 & 0.363804 \tabularnewline
11 & 0.014047 & 0.1506 & 0.440262 \tabularnewline
12 & 0.002521 & 0.027 & 0.489239 \tabularnewline
13 & -0.009273 & -0.0994 & 0.460481 \tabularnewline
14 & 0.013962 & 0.1497 & 0.44062 \tabularnewline
15 & -0.041481 & -0.4448 & 0.328639 \tabularnewline
16 & -0.011941 & -0.1281 & 0.449166 \tabularnewline
17 & -0.021746 & -0.2332 & 0.408011 \tabularnewline
18 & -0.075721 & -0.812 & 0.209228 \tabularnewline
19 & -0.05939 & -0.6369 & 0.262732 \tabularnewline
20 & -0.00799 & -0.0857 & 0.465933 \tabularnewline
21 & -0.03071 & -0.3293 & 0.371253 \tabularnewline
22 & -0.018466 & -0.198 & 0.421689 \tabularnewline
23 & -0.023849 & -0.2557 & 0.399302 \tabularnewline
24 & -0.001615 & -0.0173 & 0.493106 \tabularnewline
25 & 0.02234 & 0.2396 & 0.405546 \tabularnewline
26 & -0.019077 & -0.2046 & 0.419131 \tabularnewline
27 & -0.017769 & -0.1906 & 0.424606 \tabularnewline
28 & -0.001572 & -0.0169 & 0.493288 \tabularnewline
29 & -0.027536 & -0.2953 & 0.384152 \tabularnewline
30 & -0.015062 & -0.1615 & 0.435981 \tabularnewline
31 & -0.031392 & -0.3366 & 0.368499 \tabularnewline
32 & -0.054489 & -0.5843 & 0.280071 \tabularnewline
33 & -0.014298 & -0.1533 & 0.439203 \tabularnewline
34 & 0.032689 & 0.3505 & 0.363285 \tabularnewline
35 & -0.002168 & -0.0233 & 0.490745 \tabularnewline
36 & -0.0355 & -0.3807 & 0.352066 \tabularnewline
37 & 0.013857 & 0.1486 & 0.441066 \tabularnewline
38 & -0.015949 & -0.171 & 0.432248 \tabularnewline
39 & 0.010193 & 0.1093 & 0.456577 \tabularnewline
40 & -0.015878 & -0.1703 & 0.432546 \tabularnewline
41 & -0.050106 & -0.5373 & 0.296039 \tabularnewline
42 & -0.028603 & -0.3067 & 0.379803 \tabularnewline
43 & 0.015601 & 0.1673 & 0.433715 \tabularnewline
44 & -0.025662 & -0.2752 & 0.391831 \tabularnewline
45 & -0.075144 & -0.8058 & 0.211003 \tabularnewline
46 & 0.031301 & 0.3357 & 0.368866 \tabularnewline
47 & -0.040604 & -0.4354 & 0.332033 \tabularnewline
48 & -0.058362 & -0.6259 & 0.266324 \tabularnewline
\hline
\end{tabular}
%Source: https://freestatistics.org/blog/index.php?pk=301842&T=2

[TABLE]
[ROW][C]Partial Autocorrelation Function[/C][/ROW]
[ROW][C]Time lag k[/C][C]PACF(k)[/C][C]T-STAT[/C][C]P-value[/C][/ROW]
[ROW][C]1[/C][C]0.976273[/C][C]10.4694[/C][C]0[/C][/ROW]
[ROW][C]2[/C][C]-0.01351[/C][C]-0.1449[/C][C]0.442529[/C][/ROW]
[ROW][C]3[/C][C]-0.027001[/C][C]-0.2896[/C][C]0.38634[/C][/ROW]
[ROW][C]4[/C][C]-0.055468[/C][C]-0.5948[/C][C]0.276562[/C][/ROW]
[ROW][C]5[/C][C]0.013777[/C][C]0.1477[/C][C]0.441402[/C][/ROW]
[ROW][C]6[/C][C]0.005491[/C][C]0.0589[/C][C]0.476575[/C][/ROW]
[ROW][C]7[/C][C]-0.013838[/C][C]-0.1484[/C][C]0.441147[/C][/ROW]
[ROW][C]8[/C][C]-0.036966[/C][C]-0.3964[/C][C]0.346265[/C][/ROW]
[ROW][C]9[/C][C]0.012082[/C][C]0.1296[/C][C]0.448571[/C][/ROW]
[ROW][C]10[/C][C]-0.032559[/C][C]-0.3492[/C][C]0.363804[/C][/ROW]
[ROW][C]11[/C][C]0.014047[/C][C]0.1506[/C][C]0.440262[/C][/ROW]
[ROW][C]12[/C][C]0.002521[/C][C]0.027[/C][C]0.489239[/C][/ROW]
[ROW][C]13[/C][C]-0.009273[/C][C]-0.0994[/C][C]0.460481[/C][/ROW]
[ROW][C]14[/C][C]0.013962[/C][C]0.1497[/C][C]0.44062[/C][/ROW]
[ROW][C]15[/C][C]-0.041481[/C][C]-0.4448[/C][C]0.328639[/C][/ROW]
[ROW][C]16[/C][C]-0.011941[/C][C]-0.1281[/C][C]0.449166[/C][/ROW]
[ROW][C]17[/C][C]-0.021746[/C][C]-0.2332[/C][C]0.408011[/C][/ROW]
[ROW][C]18[/C][C]-0.075721[/C][C]-0.812[/C][C]0.209228[/C][/ROW]
[ROW][C]19[/C][C]-0.05939[/C][C]-0.6369[/C][C]0.262732[/C][/ROW]
[ROW][C]20[/C][C]-0.00799[/C][C]-0.0857[/C][C]0.465933[/C][/ROW]
[ROW][C]21[/C][C]-0.03071[/C][C]-0.3293[/C][C]0.371253[/C][/ROW]
[ROW][C]22[/C][C]-0.018466[/C][C]-0.198[/C][C]0.421689[/C][/ROW]
[ROW][C]23[/C][C]-0.023849[/C][C]-0.2557[/C][C]0.399302[/C][/ROW]
[ROW][C]24[/C][C]-0.001615[/C][C]-0.0173[/C][C]0.493106[/C][/ROW]
[ROW][C]25[/C][C]0.02234[/C][C]0.2396[/C][C]0.405546[/C][/ROW]
[ROW][C]26[/C][C]-0.019077[/C][C]-0.2046[/C][C]0.419131[/C][/ROW]
[ROW][C]27[/C][C]-0.017769[/C][C]-0.1906[/C][C]0.424606[/C][/ROW]
[ROW][C]28[/C][C]-0.001572[/C][C]-0.0169[/C][C]0.493288[/C][/ROW]
[ROW][C]29[/C][C]-0.027536[/C][C]-0.2953[/C][C]0.384152[/C][/ROW]
[ROW][C]30[/C][C]-0.015062[/C][C]-0.1615[/C][C]0.435981[/C][/ROW]
[ROW][C]31[/C][C]-0.031392[/C][C]-0.3366[/C][C]0.368499[/C][/ROW]
[ROW][C]32[/C][C]-0.054489[/C][C]-0.5843[/C][C]0.280071[/C][/ROW]
[ROW][C]33[/C][C]-0.014298[/C][C]-0.1533[/C][C]0.439203[/C][/ROW]
[ROW][C]34[/C][C]0.032689[/C][C]0.3505[/C][C]0.363285[/C][/ROW]
[ROW][C]35[/C][C]-0.002168[/C][C]-0.0233[/C][C]0.490745[/C][/ROW]
[ROW][C]36[/C][C]-0.0355[/C][C]-0.3807[/C][C]0.352066[/C][/ROW]
[ROW][C]37[/C][C]0.013857[/C][C]0.1486[/C][C]0.441066[/C][/ROW]
[ROW][C]38[/C][C]-0.015949[/C][C]-0.171[/C][C]0.432248[/C][/ROW]
[ROW][C]39[/C][C]0.010193[/C][C]0.1093[/C][C]0.456577[/C][/ROW]
[ROW][C]40[/C][C]-0.015878[/C][C]-0.1703[/C][C]0.432546[/C][/ROW]
[ROW][C]41[/C][C]-0.050106[/C][C]-0.5373[/C][C]0.296039[/C][/ROW]
[ROW][C]42[/C][C]-0.028603[/C][C]-0.3067[/C][C]0.379803[/C][/ROW]
[ROW][C]43[/C][C]0.015601[/C][C]0.1673[/C][C]0.433715[/C][/ROW]
[ROW][C]44[/C][C]-0.025662[/C][C]-0.2752[/C][C]0.391831[/C][/ROW]
[ROW][C]45[/C][C]-0.075144[/C][C]-0.8058[/C][C]0.211003[/C][/ROW]
[ROW][C]46[/C][C]0.031301[/C][C]0.3357[/C][C]0.368866[/C][/ROW]
[ROW][C]47[/C][C]-0.040604[/C][C]-0.4354[/C][C]0.332033[/C][/ROW]
[ROW][C]48[/C][C]-0.058362[/C][C]-0.6259[/C][C]0.266324[/C][/ROW]
[/TABLE]
Source: https://freestatistics.org/blog/index.php?pk=301842&T=2

Globally Unique Identifier (entire table): ba.freestatistics.org/blog/index.php?pk=301842&T=2

As an alternative you can also use a QR Code:  

The GUIDs for individual cells are displayed in the table below:

Partial Autocorrelation Function
Time lag kPACF(k)T-STATP-value
10.97627310.46940
2-0.01351-0.14490.442529
3-0.027001-0.28960.38634
4-0.055468-0.59480.276562
50.0137770.14770.441402
60.0054910.05890.476575
7-0.013838-0.14840.441147
8-0.036966-0.39640.346265
90.0120820.12960.448571
10-0.032559-0.34920.363804
110.0140470.15060.440262
120.0025210.0270.489239
13-0.009273-0.09940.460481
140.0139620.14970.44062
15-0.041481-0.44480.328639
16-0.011941-0.12810.449166
17-0.021746-0.23320.408011
18-0.075721-0.8120.209228
19-0.05939-0.63690.262732
20-0.00799-0.08570.465933
21-0.03071-0.32930.371253
22-0.018466-0.1980.421689
23-0.023849-0.25570.399302
24-0.001615-0.01730.493106
250.022340.23960.405546
26-0.019077-0.20460.419131
27-0.017769-0.19060.424606
28-0.001572-0.01690.493288
29-0.027536-0.29530.384152
30-0.015062-0.16150.435981
31-0.031392-0.33660.368499
32-0.054489-0.58430.280071
33-0.014298-0.15330.439203
340.0326890.35050.363285
35-0.002168-0.02330.490745
36-0.0355-0.38070.352066
370.0138570.14860.441066
38-0.015949-0.1710.432248
390.0101930.10930.456577
40-0.015878-0.17030.432546
41-0.050106-0.53730.296039
42-0.028603-0.30670.379803
430.0156010.16730.433715
44-0.025662-0.27520.391831
45-0.075144-0.80580.211003
460.0313010.33570.368866
47-0.040604-0.43540.332033
48-0.058362-0.62590.266324


Parameters (Session):
par1 = Default ; par2 = 1 ; par3 = 2 ; par4 = 0 ; par5 = 12 ; par6 = White Noise ; par7 = 0.95 ;
Parameters (R input):
par1 = 48 ; par2 = 1 ; par3 = 0 ; par4 = 0 ; par5 = 1 ; par6 = White Noise ; par7 = 0.95 ; par8 = ;
R code (references can be found in the software module):
if (par1 == 'Default') {
par1 = 10*log10(length(x))
} else {
par1 <- as.numeric(par1)
}
par2 <- as.numeric(par2)
par3 <- as.numeric(par3)
par4 <- as.numeric(par4)
par5 <- as.numeric(par5)
if (par6 == 'White Noise') par6 <- 'white' else par6 <- 'ma'
par7 <- as.numeric(par7)
if (par8 != '') par8 <- as.numeric(par8)
x <- na.omit(x)
ox <- x
if (par8 == '') {
if (par2 == 0) {
x <- log(x)
} else {
x <- (x ^ par2 - 1) / par2
}
} else {
x <- log(x,base=par8)
}
if (par3 > 0) x <- diff(x,lag=1,difference=par3)
if (par4 > 0) x <- diff(x,lag=par5,difference=par4)
bitmap(file='picts.png')
op <- par(mfrow=c(2,1))
plot(ox,type='l',main='Original Time Series',xlab='time',ylab='value')
if (par8=='') {
mytitle <- paste('Working Time Series (lambda=',par2,', d=',par3,', D=',par4,')',sep='')
mysub <- paste('(lambda=',par2,', d=',par3,', D=',par4,', CI=', par7, ', CI type=',par6,')',sep='')
} else {
mytitle <- paste('Working Time Series (base=',par8,', d=',par3,', D=',par4,')',sep='')
mysub <- paste('(base=',par8,', d=',par3,', D=',par4,', CI=', par7, ', CI type=',par6,')',sep='')
}
plot(x,type='l', main=mytitle,xlab='time',ylab='value')
par(op)
dev.off()
bitmap(file='pic1.png')
racf <- acf(x, par1, main='Autocorrelation', xlab='time lag', ylab='ACF', ci.type=par6, ci=par7, sub=mysub)
dev.off()
bitmap(file='pic2.png')
rpacf <- pacf(x,par1,main='Partial Autocorrelation',xlab='lags',ylab='PACF',sub=mysub)
dev.off()
(myacf <- c(racf$acf))
(mypacf <- c(rpacf$acf))
lengthx <- length(x)
sqrtn <- sqrt(lengthx)
load(file='createtable')
a<-table.start()
a<-table.row.start(a)
a<-table.element(a,'Autocorrelation Function',4,TRUE)
a<-table.row.end(a)
a<-table.row.start(a)
a<-table.element(a,'Time lag k',header=TRUE)
a<-table.element(a,'ACF(k)',header=TRUE)
a<-table.element(a,'T-STAT',header=TRUE)
a<-table.element(a,'P-value',header=TRUE)
a<-table.row.end(a)
for (i in 2:(par1+1)) {
a<-table.row.start(a)
a<-table.element(a,i-1,header=TRUE)
a<-table.element(a,round(myacf[i],6))
mytstat <- myacf[i]*sqrtn
a<-table.element(a,round(mytstat,4))
a<-table.element(a,round(1-pt(abs(mytstat),lengthx),6))
a<-table.row.end(a)
}
a<-table.end(a)
table.save(a,file='mytable.tab')
a<-table.start()
a<-table.row.start(a)
a<-table.element(a,'Partial Autocorrelation Function',4,TRUE)
a<-table.row.end(a)
a<-table.row.start(a)
a<-table.element(a,'Time lag k',header=TRUE)
a<-table.element(a,'PACF(k)',header=TRUE)
a<-table.element(a,'T-STAT',header=TRUE)
a<-table.element(a,'P-value',header=TRUE)
a<-table.row.end(a)
for (i in 1:par1) {
a<-table.row.start(a)
a<-table.element(a,i,header=TRUE)
a<-table.element(a,round(mypacf[i],6))
mytstat <- mypacf[i]*sqrtn
a<-table.element(a,round(mytstat,4))
a<-table.element(a,round(1-pt(abs(mytstat),lengthx),6))
a<-table.row.end(a)
}
a<-table.end(a)
table.save(a,file='mytable1.tab')