Free Statistics

of Irreproducible Research!

Author's title

Author*The author of this computation has been verified*
R Software Modulerwasp_autocorrelation.wasp
Title produced by software(Partial) Autocorrelation Function
Date of computationWed, 21 Dec 2016 02:51:22 +0100
Cite this page as followsStatistical Computations at FreeStatistics.org, Office for Research Development and Education, URL https://freestatistics.org/blog/index.php?v=date/2016/Dec/21/t1482285095safaqaj8grodsj0.htm/, Retrieved Mon, 06 May 2024 15:14:38 +0000
Statistical Computations at FreeStatistics.org, Office for Research Development and Education, URL https://freestatistics.org/blog/index.php?pk=301843, Retrieved Mon, 06 May 2024 15:14:38 +0000
QR Codes:

Original text written by user:
IsPrivate?No (this computation is public)
User-defined keywords
Estimated Impact96
Family? (F = Feedback message, R = changed R code, M = changed R Module, P = changed Parameters, D = changed Data)
-       [(Partial) Autocorrelation Function] [] [2016-12-21 01:51:22] [361c8dad91b3f1ef2e651cd04783c23b] [Current]
Feedback Forum

Post a new message
Dataseries X:
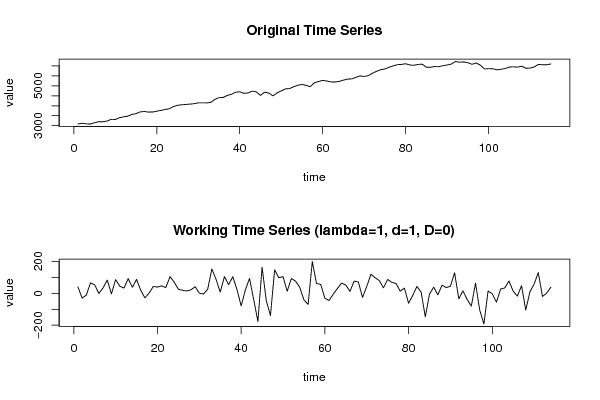
3082.8
3122.55
3092.15
3081
3146.5
3199.55
3198.7
3232.75
3316
3312.5
3398.5
3442.8
3475.85
3567.8
3605.3
3692.5
3711.25
3682.65
3684.2
3727.6
3766.5
3813.35
3849.45
3953.7
4023.9
4049
4067.85
4082.35
4104.2
4145.55
4146.55
4142.15
4168.2
4320.8
4408.2
4415.75
4520.65
4575.15
4679.45
4702.6
4623.3
4644.2
4737.45
4697.75
4521.1
4684.45
4638.7
4499.15
4646.65
4744.25
4848.45
4861.7
4954.4
5030.55
5068.35
5027.1
4957.3
5156.45
5218
5274.05
5243.5
5198.25
5192.95
5223.25
5287.25
5338.9
5350.9
5427.75
5498.3
5472.65
5514.55
5634.5
5732.6
5812.55
5846.8
5933.4
6002
6064.1
6077.35
6110.35
6047.95
6034.65
6078
6085.8
5938.15
5933.35
5971.6
5962.25
6013.15
6048.85
6092.85
6221.15
6186.8
6202.1
6163.5
6083.3
6147.2
6042.3
5849.45
5863.5
5860.95
5805.75
5832.5
5866.4
5943.6
5956.6
5939.3
5986.95
5881.6
5891
5948.65
6078.75
6058.8
6059.85
6097.95


Summary of computational transaction
Raw Input view raw input (R code)
Raw Outputview raw output of R engine
Computing time1 seconds
R ServerBig Analytics Cloud Computing Center

\begin{tabular}{lllllllll}
\hline
Summary of computational transaction \tabularnewline
Raw Input view raw input (R code)  \tabularnewline
Raw Outputview raw output of R engine  \tabularnewline
Computing time1 seconds \tabularnewline
R ServerBig Analytics Cloud Computing Center \tabularnewline
\hline
\end{tabular}
%Source: https://freestatistics.org/blog/index.php?pk=301843&T=0

[TABLE]
[ROW]
Summary of computational transaction[/C][/ROW] [ROW]Raw Input[/C] view raw input (R code) [/C][/ROW] [ROW]Raw Output[/C]view raw output of R engine [/C][/ROW] [ROW]Computing time[/C]1 seconds[/C][/ROW] [ROW]R Server[/C]Big Analytics Cloud Computing Center[/C][/ROW] [/TABLE] Source: https://freestatistics.org/blog/index.php?pk=301843&T=0

Globally Unique Identifier (entire table): ba.freestatistics.org/blog/index.php?pk=301843&T=0

As an alternative you can also use a QR Code:  

The GUIDs for individual cells are displayed in the table below:

Summary of computational transaction
Raw Input view raw input (R code)
Raw Outputview raw output of R engine
Computing time1 seconds
R ServerBig Analytics Cloud Computing Center


Autocorrelation Function
Time lag kACF(k)T-STATP-value
10.096871.03430.151595
2-0.115711-1.23550.109601
30.2094012.23580.013657
40.097741.04360.149445
5-0.007774-0.0830.466996
6-0.116772-1.24680.107516
7-0.047428-0.50640.306781
8-0.014583-0.15570.43827
90.0141560.15110.440065
10-0.082945-0.88560.188846
11-0.006762-0.07220.471287
120.0308960.32990.371047
13-0.055031-0.58760.278991
140.175841.87750.031506
150.1656911.76910.039776
160.0560730.59870.275283
17-0.028812-0.30760.379464
180.0716740.76530.222848
190.0635410.67840.249435
20-0.008623-0.09210.463403
21-0.041192-0.43980.330452
22-0.013744-0.14670.441795
230.0073310.07830.468874
24-0.010358-0.11060.456066
250.0311410.33250.370062
26-0.025673-0.27410.392246
27-0.204008-2.17820.015725
28-0.010977-0.11720.453455
290.0499440.53330.297448
30-0.088462-0.94450.173453
31-0.141619-1.51210.066641
32-0.077941-0.83220.203523
33-0.042645-0.45530.324871
340.069370.74070.230208
35-0.057874-0.61790.268929
36-0.084337-0.90050.184884
370.1357511.44940.074983
380.1316681.40580.081248
390.0227680.24310.404186
400.0600760.64140.261265
410.0097580.10420.458602
42-0.001125-0.0120.495217
430.0267760.28590.387741
440.0139960.14940.440735
45-0.039821-0.42520.335757
46-0.056431-0.60250.274015
47-0.077467-0.82710.204947
48-0.054277-0.57950.28169

\begin{tabular}{lllllllll}
\hline
Autocorrelation Function \tabularnewline
Time lag k & ACF(k) & T-STAT & P-value \tabularnewline
1 & 0.09687 & 1.0343 & 0.151595 \tabularnewline
2 & -0.115711 & -1.2355 & 0.109601 \tabularnewline
3 & 0.209401 & 2.2358 & 0.013657 \tabularnewline
4 & 0.09774 & 1.0436 & 0.149445 \tabularnewline
5 & -0.007774 & -0.083 & 0.466996 \tabularnewline
6 & -0.116772 & -1.2468 & 0.107516 \tabularnewline
7 & -0.047428 & -0.5064 & 0.306781 \tabularnewline
8 & -0.014583 & -0.1557 & 0.43827 \tabularnewline
9 & 0.014156 & 0.1511 & 0.440065 \tabularnewline
10 & -0.082945 & -0.8856 & 0.188846 \tabularnewline
11 & -0.006762 & -0.0722 & 0.471287 \tabularnewline
12 & 0.030896 & 0.3299 & 0.371047 \tabularnewline
13 & -0.055031 & -0.5876 & 0.278991 \tabularnewline
14 & 0.17584 & 1.8775 & 0.031506 \tabularnewline
15 & 0.165691 & 1.7691 & 0.039776 \tabularnewline
16 & 0.056073 & 0.5987 & 0.275283 \tabularnewline
17 & -0.028812 & -0.3076 & 0.379464 \tabularnewline
18 & 0.071674 & 0.7653 & 0.222848 \tabularnewline
19 & 0.063541 & 0.6784 & 0.249435 \tabularnewline
20 & -0.008623 & -0.0921 & 0.463403 \tabularnewline
21 & -0.041192 & -0.4398 & 0.330452 \tabularnewline
22 & -0.013744 & -0.1467 & 0.441795 \tabularnewline
23 & 0.007331 & 0.0783 & 0.468874 \tabularnewline
24 & -0.010358 & -0.1106 & 0.456066 \tabularnewline
25 & 0.031141 & 0.3325 & 0.370062 \tabularnewline
26 & -0.025673 & -0.2741 & 0.392246 \tabularnewline
27 & -0.204008 & -2.1782 & 0.015725 \tabularnewline
28 & -0.010977 & -0.1172 & 0.453455 \tabularnewline
29 & 0.049944 & 0.5333 & 0.297448 \tabularnewline
30 & -0.088462 & -0.9445 & 0.173453 \tabularnewline
31 & -0.141619 & -1.5121 & 0.066641 \tabularnewline
32 & -0.077941 & -0.8322 & 0.203523 \tabularnewline
33 & -0.042645 & -0.4553 & 0.324871 \tabularnewline
34 & 0.06937 & 0.7407 & 0.230208 \tabularnewline
35 & -0.057874 & -0.6179 & 0.268929 \tabularnewline
36 & -0.084337 & -0.9005 & 0.184884 \tabularnewline
37 & 0.135751 & 1.4494 & 0.074983 \tabularnewline
38 & 0.131668 & 1.4058 & 0.081248 \tabularnewline
39 & 0.022768 & 0.2431 & 0.404186 \tabularnewline
40 & 0.060076 & 0.6414 & 0.261265 \tabularnewline
41 & 0.009758 & 0.1042 & 0.458602 \tabularnewline
42 & -0.001125 & -0.012 & 0.495217 \tabularnewline
43 & 0.026776 & 0.2859 & 0.387741 \tabularnewline
44 & 0.013996 & 0.1494 & 0.440735 \tabularnewline
45 & -0.039821 & -0.4252 & 0.335757 \tabularnewline
46 & -0.056431 & -0.6025 & 0.274015 \tabularnewline
47 & -0.077467 & -0.8271 & 0.204947 \tabularnewline
48 & -0.054277 & -0.5795 & 0.28169 \tabularnewline
\hline
\end{tabular}
%Source: https://freestatistics.org/blog/index.php?pk=301843&T=1

[TABLE]
[ROW][C]Autocorrelation Function[/C][/ROW]
[ROW][C]Time lag k[/C][C]ACF(k)[/C][C]T-STAT[/C][C]P-value[/C][/ROW]
[ROW][C]1[/C][C]0.09687[/C][C]1.0343[/C][C]0.151595[/C][/ROW]
[ROW][C]2[/C][C]-0.115711[/C][C]-1.2355[/C][C]0.109601[/C][/ROW]
[ROW][C]3[/C][C]0.209401[/C][C]2.2358[/C][C]0.013657[/C][/ROW]
[ROW][C]4[/C][C]0.09774[/C][C]1.0436[/C][C]0.149445[/C][/ROW]
[ROW][C]5[/C][C]-0.007774[/C][C]-0.083[/C][C]0.466996[/C][/ROW]
[ROW][C]6[/C][C]-0.116772[/C][C]-1.2468[/C][C]0.107516[/C][/ROW]
[ROW][C]7[/C][C]-0.047428[/C][C]-0.5064[/C][C]0.306781[/C][/ROW]
[ROW][C]8[/C][C]-0.014583[/C][C]-0.1557[/C][C]0.43827[/C][/ROW]
[ROW][C]9[/C][C]0.014156[/C][C]0.1511[/C][C]0.440065[/C][/ROW]
[ROW][C]10[/C][C]-0.082945[/C][C]-0.8856[/C][C]0.188846[/C][/ROW]
[ROW][C]11[/C][C]-0.006762[/C][C]-0.0722[/C][C]0.471287[/C][/ROW]
[ROW][C]12[/C][C]0.030896[/C][C]0.3299[/C][C]0.371047[/C][/ROW]
[ROW][C]13[/C][C]-0.055031[/C][C]-0.5876[/C][C]0.278991[/C][/ROW]
[ROW][C]14[/C][C]0.17584[/C][C]1.8775[/C][C]0.031506[/C][/ROW]
[ROW][C]15[/C][C]0.165691[/C][C]1.7691[/C][C]0.039776[/C][/ROW]
[ROW][C]16[/C][C]0.056073[/C][C]0.5987[/C][C]0.275283[/C][/ROW]
[ROW][C]17[/C][C]-0.028812[/C][C]-0.3076[/C][C]0.379464[/C][/ROW]
[ROW][C]18[/C][C]0.071674[/C][C]0.7653[/C][C]0.222848[/C][/ROW]
[ROW][C]19[/C][C]0.063541[/C][C]0.6784[/C][C]0.249435[/C][/ROW]
[ROW][C]20[/C][C]-0.008623[/C][C]-0.0921[/C][C]0.463403[/C][/ROW]
[ROW][C]21[/C][C]-0.041192[/C][C]-0.4398[/C][C]0.330452[/C][/ROW]
[ROW][C]22[/C][C]-0.013744[/C][C]-0.1467[/C][C]0.441795[/C][/ROW]
[ROW][C]23[/C][C]0.007331[/C][C]0.0783[/C][C]0.468874[/C][/ROW]
[ROW][C]24[/C][C]-0.010358[/C][C]-0.1106[/C][C]0.456066[/C][/ROW]
[ROW][C]25[/C][C]0.031141[/C][C]0.3325[/C][C]0.370062[/C][/ROW]
[ROW][C]26[/C][C]-0.025673[/C][C]-0.2741[/C][C]0.392246[/C][/ROW]
[ROW][C]27[/C][C]-0.204008[/C][C]-2.1782[/C][C]0.015725[/C][/ROW]
[ROW][C]28[/C][C]-0.010977[/C][C]-0.1172[/C][C]0.453455[/C][/ROW]
[ROW][C]29[/C][C]0.049944[/C][C]0.5333[/C][C]0.297448[/C][/ROW]
[ROW][C]30[/C][C]-0.088462[/C][C]-0.9445[/C][C]0.173453[/C][/ROW]
[ROW][C]31[/C][C]-0.141619[/C][C]-1.5121[/C][C]0.066641[/C][/ROW]
[ROW][C]32[/C][C]-0.077941[/C][C]-0.8322[/C][C]0.203523[/C][/ROW]
[ROW][C]33[/C][C]-0.042645[/C][C]-0.4553[/C][C]0.324871[/C][/ROW]
[ROW][C]34[/C][C]0.06937[/C][C]0.7407[/C][C]0.230208[/C][/ROW]
[ROW][C]35[/C][C]-0.057874[/C][C]-0.6179[/C][C]0.268929[/C][/ROW]
[ROW][C]36[/C][C]-0.084337[/C][C]-0.9005[/C][C]0.184884[/C][/ROW]
[ROW][C]37[/C][C]0.135751[/C][C]1.4494[/C][C]0.074983[/C][/ROW]
[ROW][C]38[/C][C]0.131668[/C][C]1.4058[/C][C]0.081248[/C][/ROW]
[ROW][C]39[/C][C]0.022768[/C][C]0.2431[/C][C]0.404186[/C][/ROW]
[ROW][C]40[/C][C]0.060076[/C][C]0.6414[/C][C]0.261265[/C][/ROW]
[ROW][C]41[/C][C]0.009758[/C][C]0.1042[/C][C]0.458602[/C][/ROW]
[ROW][C]42[/C][C]-0.001125[/C][C]-0.012[/C][C]0.495217[/C][/ROW]
[ROW][C]43[/C][C]0.026776[/C][C]0.2859[/C][C]0.387741[/C][/ROW]
[ROW][C]44[/C][C]0.013996[/C][C]0.1494[/C][C]0.440735[/C][/ROW]
[ROW][C]45[/C][C]-0.039821[/C][C]-0.4252[/C][C]0.335757[/C][/ROW]
[ROW][C]46[/C][C]-0.056431[/C][C]-0.6025[/C][C]0.274015[/C][/ROW]
[ROW][C]47[/C][C]-0.077467[/C][C]-0.8271[/C][C]0.204947[/C][/ROW]
[ROW][C]48[/C][C]-0.054277[/C][C]-0.5795[/C][C]0.28169[/C][/ROW]
[/TABLE]
Source: https://freestatistics.org/blog/index.php?pk=301843&T=1

Globally Unique Identifier (entire table): ba.freestatistics.org/blog/index.php?pk=301843&T=1

As an alternative you can also use a QR Code:  

The GUIDs for individual cells are displayed in the table below:

Autocorrelation Function
Time lag kACF(k)T-STATP-value
10.096871.03430.151595
2-0.115711-1.23550.109601
30.2094012.23580.013657
40.097741.04360.149445
5-0.007774-0.0830.466996
6-0.116772-1.24680.107516
7-0.047428-0.50640.306781
8-0.014583-0.15570.43827
90.0141560.15110.440065
10-0.082945-0.88560.188846
11-0.006762-0.07220.471287
120.0308960.32990.371047
13-0.055031-0.58760.278991
140.175841.87750.031506
150.1656911.76910.039776
160.0560730.59870.275283
17-0.028812-0.30760.379464
180.0716740.76530.222848
190.0635410.67840.249435
20-0.008623-0.09210.463403
21-0.041192-0.43980.330452
22-0.013744-0.14670.441795
230.0073310.07830.468874
24-0.010358-0.11060.456066
250.0311410.33250.370062
26-0.025673-0.27410.392246
27-0.204008-2.17820.015725
28-0.010977-0.11720.453455
290.0499440.53330.297448
30-0.088462-0.94450.173453
31-0.141619-1.51210.066641
32-0.077941-0.83220.203523
33-0.042645-0.45530.324871
340.069370.74070.230208
35-0.057874-0.61790.268929
36-0.084337-0.90050.184884
370.1357511.44940.074983
380.1316681.40580.081248
390.0227680.24310.404186
400.0600760.64140.261265
410.0097580.10420.458602
42-0.001125-0.0120.495217
430.0267760.28590.387741
440.0139960.14940.440735
45-0.039821-0.42520.335757
46-0.056431-0.60250.274015
47-0.077467-0.82710.204947
48-0.054277-0.57950.28169


Partial Autocorrelation Function
Time lag kPACF(k)T-STATP-value
10.096871.03430.151595
2-0.12628-1.34830.090118
30.2403092.56580.005796
40.0300640.3210.3744
50.0377950.40350.343654
6-0.165649-1.76860.039814
7-0.041504-0.44310.329251
8-0.056672-0.60510.273161
90.0810370.86520.194362
10-0.072867-0.7780.219088
110.0592850.6330.264005
12-0.036529-0.390.348623
13-0.029183-0.31160.377961
140.1954092.08640.019587
150.1328061.4180.079463
160.092530.9880.162634
17-0.113053-1.20710.114951
180.0117480.12540.450198
19-0.041014-0.43790.331141
200.080250.85680.196668
21-0.016197-0.17290.431503
220.0455650.48650.313772
23-0.073567-0.78550.216901
240.035310.3770.353436
250.052090.55620.289592
260.0108510.11590.453986
27-0.235478-2.51420.006663
28-0.021648-0.23110.408813
29-0.065463-0.6990.243001
30-0.023457-0.25050.401343
31-0.100261-1.07050.14333
32-0.08417-0.89870.185357
33-0.129374-1.38130.084939
340.1109031.18410.119414
35-0.031348-0.33470.369232
360.0220080.2350.407322
370.0465670.49720.310003
380.0915920.97790.165089
390.028140.30050.38219
400.0636930.68010.248924
410.0103830.11090.45596
420.0413490.44150.329848
430.0264810.28270.388946
440.0641040.68440.247541
450.0747980.79860.213084
460.0149050.15910.436918
47-0.011489-0.12270.451292
48-0.090248-0.96360.168647

\begin{tabular}{lllllllll}
\hline
Partial Autocorrelation Function \tabularnewline
Time lag k & PACF(k) & T-STAT & P-value \tabularnewline
1 & 0.09687 & 1.0343 & 0.151595 \tabularnewline
2 & -0.12628 & -1.3483 & 0.090118 \tabularnewline
3 & 0.240309 & 2.5658 & 0.005796 \tabularnewline
4 & 0.030064 & 0.321 & 0.3744 \tabularnewline
5 & 0.037795 & 0.4035 & 0.343654 \tabularnewline
6 & -0.165649 & -1.7686 & 0.039814 \tabularnewline
7 & -0.041504 & -0.4431 & 0.329251 \tabularnewline
8 & -0.056672 & -0.6051 & 0.273161 \tabularnewline
9 & 0.081037 & 0.8652 & 0.194362 \tabularnewline
10 & -0.072867 & -0.778 & 0.219088 \tabularnewline
11 & 0.059285 & 0.633 & 0.264005 \tabularnewline
12 & -0.036529 & -0.39 & 0.348623 \tabularnewline
13 & -0.029183 & -0.3116 & 0.377961 \tabularnewline
14 & 0.195409 & 2.0864 & 0.019587 \tabularnewline
15 & 0.132806 & 1.418 & 0.079463 \tabularnewline
16 & 0.09253 & 0.988 & 0.162634 \tabularnewline
17 & -0.113053 & -1.2071 & 0.114951 \tabularnewline
18 & 0.011748 & 0.1254 & 0.450198 \tabularnewline
19 & -0.041014 & -0.4379 & 0.331141 \tabularnewline
20 & 0.08025 & 0.8568 & 0.196668 \tabularnewline
21 & -0.016197 & -0.1729 & 0.431503 \tabularnewline
22 & 0.045565 & 0.4865 & 0.313772 \tabularnewline
23 & -0.073567 & -0.7855 & 0.216901 \tabularnewline
24 & 0.03531 & 0.377 & 0.353436 \tabularnewline
25 & 0.05209 & 0.5562 & 0.289592 \tabularnewline
26 & 0.010851 & 0.1159 & 0.453986 \tabularnewline
27 & -0.235478 & -2.5142 & 0.006663 \tabularnewline
28 & -0.021648 & -0.2311 & 0.408813 \tabularnewline
29 & -0.065463 & -0.699 & 0.243001 \tabularnewline
30 & -0.023457 & -0.2505 & 0.401343 \tabularnewline
31 & -0.100261 & -1.0705 & 0.14333 \tabularnewline
32 & -0.08417 & -0.8987 & 0.185357 \tabularnewline
33 & -0.129374 & -1.3813 & 0.084939 \tabularnewline
34 & 0.110903 & 1.1841 & 0.119414 \tabularnewline
35 & -0.031348 & -0.3347 & 0.369232 \tabularnewline
36 & 0.022008 & 0.235 & 0.407322 \tabularnewline
37 & 0.046567 & 0.4972 & 0.310003 \tabularnewline
38 & 0.091592 & 0.9779 & 0.165089 \tabularnewline
39 & 0.02814 & 0.3005 & 0.38219 \tabularnewline
40 & 0.063693 & 0.6801 & 0.248924 \tabularnewline
41 & 0.010383 & 0.1109 & 0.45596 \tabularnewline
42 & 0.041349 & 0.4415 & 0.329848 \tabularnewline
43 & 0.026481 & 0.2827 & 0.388946 \tabularnewline
44 & 0.064104 & 0.6844 & 0.247541 \tabularnewline
45 & 0.074798 & 0.7986 & 0.213084 \tabularnewline
46 & 0.014905 & 0.1591 & 0.436918 \tabularnewline
47 & -0.011489 & -0.1227 & 0.451292 \tabularnewline
48 & -0.090248 & -0.9636 & 0.168647 \tabularnewline
\hline
\end{tabular}
%Source: https://freestatistics.org/blog/index.php?pk=301843&T=2

[TABLE]
[ROW][C]Partial Autocorrelation Function[/C][/ROW]
[ROW][C]Time lag k[/C][C]PACF(k)[/C][C]T-STAT[/C][C]P-value[/C][/ROW]
[ROW][C]1[/C][C]0.09687[/C][C]1.0343[/C][C]0.151595[/C][/ROW]
[ROW][C]2[/C][C]-0.12628[/C][C]-1.3483[/C][C]0.090118[/C][/ROW]
[ROW][C]3[/C][C]0.240309[/C][C]2.5658[/C][C]0.005796[/C][/ROW]
[ROW][C]4[/C][C]0.030064[/C][C]0.321[/C][C]0.3744[/C][/ROW]
[ROW][C]5[/C][C]0.037795[/C][C]0.4035[/C][C]0.343654[/C][/ROW]
[ROW][C]6[/C][C]-0.165649[/C][C]-1.7686[/C][C]0.039814[/C][/ROW]
[ROW][C]7[/C][C]-0.041504[/C][C]-0.4431[/C][C]0.329251[/C][/ROW]
[ROW][C]8[/C][C]-0.056672[/C][C]-0.6051[/C][C]0.273161[/C][/ROW]
[ROW][C]9[/C][C]0.081037[/C][C]0.8652[/C][C]0.194362[/C][/ROW]
[ROW][C]10[/C][C]-0.072867[/C][C]-0.778[/C][C]0.219088[/C][/ROW]
[ROW][C]11[/C][C]0.059285[/C][C]0.633[/C][C]0.264005[/C][/ROW]
[ROW][C]12[/C][C]-0.036529[/C][C]-0.39[/C][C]0.348623[/C][/ROW]
[ROW][C]13[/C][C]-0.029183[/C][C]-0.3116[/C][C]0.377961[/C][/ROW]
[ROW][C]14[/C][C]0.195409[/C][C]2.0864[/C][C]0.019587[/C][/ROW]
[ROW][C]15[/C][C]0.132806[/C][C]1.418[/C][C]0.079463[/C][/ROW]
[ROW][C]16[/C][C]0.09253[/C][C]0.988[/C][C]0.162634[/C][/ROW]
[ROW][C]17[/C][C]-0.113053[/C][C]-1.2071[/C][C]0.114951[/C][/ROW]
[ROW][C]18[/C][C]0.011748[/C][C]0.1254[/C][C]0.450198[/C][/ROW]
[ROW][C]19[/C][C]-0.041014[/C][C]-0.4379[/C][C]0.331141[/C][/ROW]
[ROW][C]20[/C][C]0.08025[/C][C]0.8568[/C][C]0.196668[/C][/ROW]
[ROW][C]21[/C][C]-0.016197[/C][C]-0.1729[/C][C]0.431503[/C][/ROW]
[ROW][C]22[/C][C]0.045565[/C][C]0.4865[/C][C]0.313772[/C][/ROW]
[ROW][C]23[/C][C]-0.073567[/C][C]-0.7855[/C][C]0.216901[/C][/ROW]
[ROW][C]24[/C][C]0.03531[/C][C]0.377[/C][C]0.353436[/C][/ROW]
[ROW][C]25[/C][C]0.05209[/C][C]0.5562[/C][C]0.289592[/C][/ROW]
[ROW][C]26[/C][C]0.010851[/C][C]0.1159[/C][C]0.453986[/C][/ROW]
[ROW][C]27[/C][C]-0.235478[/C][C]-2.5142[/C][C]0.006663[/C][/ROW]
[ROW][C]28[/C][C]-0.021648[/C][C]-0.2311[/C][C]0.408813[/C][/ROW]
[ROW][C]29[/C][C]-0.065463[/C][C]-0.699[/C][C]0.243001[/C][/ROW]
[ROW][C]30[/C][C]-0.023457[/C][C]-0.2505[/C][C]0.401343[/C][/ROW]
[ROW][C]31[/C][C]-0.100261[/C][C]-1.0705[/C][C]0.14333[/C][/ROW]
[ROW][C]32[/C][C]-0.08417[/C][C]-0.8987[/C][C]0.185357[/C][/ROW]
[ROW][C]33[/C][C]-0.129374[/C][C]-1.3813[/C][C]0.084939[/C][/ROW]
[ROW][C]34[/C][C]0.110903[/C][C]1.1841[/C][C]0.119414[/C][/ROW]
[ROW][C]35[/C][C]-0.031348[/C][C]-0.3347[/C][C]0.369232[/C][/ROW]
[ROW][C]36[/C][C]0.022008[/C][C]0.235[/C][C]0.407322[/C][/ROW]
[ROW][C]37[/C][C]0.046567[/C][C]0.4972[/C][C]0.310003[/C][/ROW]
[ROW][C]38[/C][C]0.091592[/C][C]0.9779[/C][C]0.165089[/C][/ROW]
[ROW][C]39[/C][C]0.02814[/C][C]0.3005[/C][C]0.38219[/C][/ROW]
[ROW][C]40[/C][C]0.063693[/C][C]0.6801[/C][C]0.248924[/C][/ROW]
[ROW][C]41[/C][C]0.010383[/C][C]0.1109[/C][C]0.45596[/C][/ROW]
[ROW][C]42[/C][C]0.041349[/C][C]0.4415[/C][C]0.329848[/C][/ROW]
[ROW][C]43[/C][C]0.026481[/C][C]0.2827[/C][C]0.388946[/C][/ROW]
[ROW][C]44[/C][C]0.064104[/C][C]0.6844[/C][C]0.247541[/C][/ROW]
[ROW][C]45[/C][C]0.074798[/C][C]0.7986[/C][C]0.213084[/C][/ROW]
[ROW][C]46[/C][C]0.014905[/C][C]0.1591[/C][C]0.436918[/C][/ROW]
[ROW][C]47[/C][C]-0.011489[/C][C]-0.1227[/C][C]0.451292[/C][/ROW]
[ROW][C]48[/C][C]-0.090248[/C][C]-0.9636[/C][C]0.168647[/C][/ROW]
[/TABLE]
Source: https://freestatistics.org/blog/index.php?pk=301843&T=2

Globally Unique Identifier (entire table): ba.freestatistics.org/blog/index.php?pk=301843&T=2

As an alternative you can also use a QR Code:  

The GUIDs for individual cells are displayed in the table below:

Partial Autocorrelation Function
Time lag kPACF(k)T-STATP-value
10.096871.03430.151595
2-0.12628-1.34830.090118
30.2403092.56580.005796
40.0300640.3210.3744
50.0377950.40350.343654
6-0.165649-1.76860.039814
7-0.041504-0.44310.329251
8-0.056672-0.60510.273161
90.0810370.86520.194362
10-0.072867-0.7780.219088
110.0592850.6330.264005
12-0.036529-0.390.348623
13-0.029183-0.31160.377961
140.1954092.08640.019587
150.1328061.4180.079463
160.092530.9880.162634
17-0.113053-1.20710.114951
180.0117480.12540.450198
19-0.041014-0.43790.331141
200.080250.85680.196668
21-0.016197-0.17290.431503
220.0455650.48650.313772
23-0.073567-0.78550.216901
240.035310.3770.353436
250.052090.55620.289592
260.0108510.11590.453986
27-0.235478-2.51420.006663
28-0.021648-0.23110.408813
29-0.065463-0.6990.243001
30-0.023457-0.25050.401343
31-0.100261-1.07050.14333
32-0.08417-0.89870.185357
33-0.129374-1.38130.084939
340.1109031.18410.119414
35-0.031348-0.33470.369232
360.0220080.2350.407322
370.0465670.49720.310003
380.0915920.97790.165089
390.028140.30050.38219
400.0636930.68010.248924
410.0103830.11090.45596
420.0413490.44150.329848
430.0264810.28270.388946
440.0641040.68440.247541
450.0747980.79860.213084
460.0149050.15910.436918
47-0.011489-0.12270.451292
48-0.090248-0.96360.168647


Parameters (Session):
par1 = Default ; par2 = 1 ; par3 = 2 ; par4 = 0 ; par5 = 12 ; par6 = White Noise ; par7 = 0.95 ;
Parameters (R input):
par1 = 48 ; par2 = 1 ; par3 = 1 ; par4 = 0 ; par5 = 1 ; par6 = White Noise ; par7 = 0.95 ; par8 = ;
R code (references can be found in the software module):
if (par1 == 'Default') {
par1 = 10*log10(length(x))
} else {
par1 <- as.numeric(par1)
}
par2 <- as.numeric(par2)
par3 <- as.numeric(par3)
par4 <- as.numeric(par4)
par5 <- as.numeric(par5)
if (par6 == 'White Noise') par6 <- 'white' else par6 <- 'ma'
par7 <- as.numeric(par7)
if (par8 != '') par8 <- as.numeric(par8)
x <- na.omit(x)
ox <- x
if (par8 == '') {
if (par2 == 0) {
x <- log(x)
} else {
x <- (x ^ par2 - 1) / par2
}
} else {
x <- log(x,base=par8)
}
if (par3 > 0) x <- diff(x,lag=1,difference=par3)
if (par4 > 0) x <- diff(x,lag=par5,difference=par4)
bitmap(file='picts.png')
op <- par(mfrow=c(2,1))
plot(ox,type='l',main='Original Time Series',xlab='time',ylab='value')
if (par8=='') {
mytitle <- paste('Working Time Series (lambda=',par2,', d=',par3,', D=',par4,')',sep='')
mysub <- paste('(lambda=',par2,', d=',par3,', D=',par4,', CI=', par7, ', CI type=',par6,')',sep='')
} else {
mytitle <- paste('Working Time Series (base=',par8,', d=',par3,', D=',par4,')',sep='')
mysub <- paste('(base=',par8,', d=',par3,', D=',par4,', CI=', par7, ', CI type=',par6,')',sep='')
}
plot(x,type='l', main=mytitle,xlab='time',ylab='value')
par(op)
dev.off()
bitmap(file='pic1.png')
racf <- acf(x, par1, main='Autocorrelation', xlab='time lag', ylab='ACF', ci.type=par6, ci=par7, sub=mysub)
dev.off()
bitmap(file='pic2.png')
rpacf <- pacf(x,par1,main='Partial Autocorrelation',xlab='lags',ylab='PACF',sub=mysub)
dev.off()
(myacf <- c(racf$acf))
(mypacf <- c(rpacf$acf))
lengthx <- length(x)
sqrtn <- sqrt(lengthx)
load(file='createtable')
a<-table.start()
a<-table.row.start(a)
a<-table.element(a,'Autocorrelation Function',4,TRUE)
a<-table.row.end(a)
a<-table.row.start(a)
a<-table.element(a,'Time lag k',header=TRUE)
a<-table.element(a,'ACF(k)',header=TRUE)
a<-table.element(a,'T-STAT',header=TRUE)
a<-table.element(a,'P-value',header=TRUE)
a<-table.row.end(a)
for (i in 2:(par1+1)) {
a<-table.row.start(a)
a<-table.element(a,i-1,header=TRUE)
a<-table.element(a,round(myacf[i],6))
mytstat <- myacf[i]*sqrtn
a<-table.element(a,round(mytstat,4))
a<-table.element(a,round(1-pt(abs(mytstat),lengthx),6))
a<-table.row.end(a)
}
a<-table.end(a)
table.save(a,file='mytable.tab')
a<-table.start()
a<-table.row.start(a)
a<-table.element(a,'Partial Autocorrelation Function',4,TRUE)
a<-table.row.end(a)
a<-table.row.start(a)
a<-table.element(a,'Time lag k',header=TRUE)
a<-table.element(a,'PACF(k)',header=TRUE)
a<-table.element(a,'T-STAT',header=TRUE)
a<-table.element(a,'P-value',header=TRUE)
a<-table.row.end(a)
for (i in 1:par1) {
a<-table.row.start(a)
a<-table.element(a,i,header=TRUE)
a<-table.element(a,round(mypacf[i],6))
mytstat <- mypacf[i]*sqrtn
a<-table.element(a,round(mytstat,4))
a<-table.element(a,round(1-pt(abs(mytstat),lengthx),6))
a<-table.row.end(a)
}
a<-table.end(a)
table.save(a,file='mytable1.tab')