Free Statistics

of Irreproducible Research!

Author's title

Author*The author of this computation has been verified*
R Software Modulerwasp_autocorrelation.wasp
Title produced by software(Partial) Autocorrelation Function
Date of computationWed, 21 Dec 2016 10:19:35 +0100
Cite this page as followsStatistical Computations at FreeStatistics.org, Office for Research Development and Education, URL https://freestatistics.org/blog/index.php?v=date/2016/Dec/21/t1482311997zrbjoa9nza0ja4h.htm/, Retrieved Mon, 06 May 2024 16:29:10 +0000
Statistical Computations at FreeStatistics.org, Office for Research Development and Education, URL https://freestatistics.org/blog/index.php?pk=301939, Retrieved Mon, 06 May 2024 16:29:10 +0000
QR Codes:

Original text written by user:
IsPrivate?No (this computation is public)
User-defined keywords
Estimated Impact57
Family? (F = Feedback message, R = changed R code, M = changed R Module, P = changed Parameters, D = changed Data)
-       [(Partial) Autocorrelation Function] [] [2016-12-21 09:19:35] [f20c721eaecf28dbff8d9b9768e8b0c7] [Current]
Feedback Forum

Post a new message
Dataseries X:
3904,45
4137,2
4334,5
4188,6
4304,1
4570,45
4178,85
4515,15
4740,55
4582,2
4493,6
4437
4294
4581,35
4780,15
4632
4648,2
4834,85
4465,25
4671,65
4871,3
4707,8
4580,45
4562,25
4329,7
4646,1
4844,1
4623
4707,2
4844,9
4436,75
4680,85
4873,8
4735,15
4681,9
4607
4436,4
4614,1
4619,25
4507,1
4515,85
4725,4
4250,85
4591,6
4898,15
4675,45
4568,95
4531,05
4387,35
4826,1
4954,35
4814,85
4821,55
5148,05
4810,75
4988,05
5322,65
5157
5006,65
4910,2
4764,05
5093,7
5312,2
5157,6
5192,4
5546,6
5092,05
5423,25
5647,2
5450,05
5360,3
5309,25
5181
5488,6
5668,15
5560,8
5590,45
5850,7
5252,2
5626,1
5819,8
5676,35
5525,5
5359,55
5296,85
5623,75
5899,3
5672,6
5724,75
5995,1
5475,2
6143,95
6366,95
6306,1
6077
5672,4
5458,6
5716,9
5828,1
5706,85
5888,3
6007,7
5581,85
5970,95
6190,4
6079,15
5902,2
5554,4
5320,45
5683,1
5987,9
5843,7
5917,5
6299,45
5846,75
5998,1


Summary of computational transaction
Raw Input view raw input (R code)
Raw Outputview raw output of R engine
Computing time2 seconds
R ServerBig Analytics Cloud Computing Center

\begin{tabular}{lllllllll}
\hline
Summary of computational transaction \tabularnewline
Raw Input view raw input (R code)  \tabularnewline
Raw Outputview raw output of R engine  \tabularnewline
Computing time2 seconds \tabularnewline
R ServerBig Analytics Cloud Computing Center \tabularnewline
\hline
\end{tabular}
%Source: https://freestatistics.org/blog/index.php?pk=301939&T=0

[TABLE]
[ROW]
Summary of computational transaction[/C][/ROW] [ROW]Raw Input[/C] view raw input (R code) [/C][/ROW] [ROW]Raw Output[/C]view raw output of R engine [/C][/ROW] [ROW]Computing time[/C]2 seconds[/C][/ROW] [ROW]R Server[/C]Big Analytics Cloud Computing Center[/C][/ROW] [/TABLE] Source: https://freestatistics.org/blog/index.php?pk=301939&T=0

Globally Unique Identifier (entire table): ba.freestatistics.org/blog/index.php?pk=301939&T=0

As an alternative you can also use a QR Code:  

The GUIDs for individual cells are displayed in the table below:

Summary of computational transaction
Raw Input view raw input (R code)
Raw Outputview raw output of R engine
Computing time2 seconds
R ServerBig Analytics Cloud Computing Center


Autocorrelation Function
Time lag kACF(k)T-STATP-value
1-0.035357-0.35880.360226
2-0.0246-0.24970.401675
30.0709660.72020.236509
4-0.165857-1.68330.047676
50.0334890.33990.36732
6-0.12682-1.28710.100474
7-0.027001-0.2740.392307
80.080360.81560.208316
90.0184010.18670.426112
10-0.029251-0.29690.383582
11-0.005678-0.05760.47708
12-0.291893-2.96240.001895
130.0167880.17040.432523
140.0263430.26740.394865
15-0.134322-1.36320.087893
160.0028830.02930.488357
17-0.005865-0.05950.476325
180.148261.50470.067734
190.078460.79630.21385
200.0570660.57920.281876
210.1634911.65930.050053
22-0.006816-0.06920.472492
230.0411950.41810.338377
24-0.092101-0.93470.176059
25-0.126899-1.28790.100337
260.0558710.5670.285964
27-0.073677-0.74770.22816
280.0330550.33550.368974
29-0.021395-0.21710.414267
30-0.125527-1.2740.102772
31-0.029821-0.30260.381385
32-0.00127-0.01290.494869
33-0.134733-1.36740.08724
34-0.065638-0.66620.253401
350.042950.43590.331913
36-0.032065-0.32540.372759
370.1488331.51050.066991
38-0.00587-0.05960.476304
390.0371580.37710.353432
400.0704440.71490.238136
41-0.021801-0.22130.412667
420.1271721.29070.099857
430.0350190.35540.361507
44-0.043856-0.44510.328596
45-0.073383-0.74480.229058
46-0.028531-0.28960.386367
47-0.028622-0.29050.386017
48-0.06954-0.70580.240968

\begin{tabular}{lllllllll}
\hline
Autocorrelation Function \tabularnewline
Time lag k & ACF(k) & T-STAT & P-value \tabularnewline
1 & -0.035357 & -0.3588 & 0.360226 \tabularnewline
2 & -0.0246 & -0.2497 & 0.401675 \tabularnewline
3 & 0.070966 & 0.7202 & 0.236509 \tabularnewline
4 & -0.165857 & -1.6833 & 0.047676 \tabularnewline
5 & 0.033489 & 0.3399 & 0.36732 \tabularnewline
6 & -0.12682 & -1.2871 & 0.100474 \tabularnewline
7 & -0.027001 & -0.274 & 0.392307 \tabularnewline
8 & 0.08036 & 0.8156 & 0.208316 \tabularnewline
9 & 0.018401 & 0.1867 & 0.426112 \tabularnewline
10 & -0.029251 & -0.2969 & 0.383582 \tabularnewline
11 & -0.005678 & -0.0576 & 0.47708 \tabularnewline
12 & -0.291893 & -2.9624 & 0.001895 \tabularnewline
13 & 0.016788 & 0.1704 & 0.432523 \tabularnewline
14 & 0.026343 & 0.2674 & 0.394865 \tabularnewline
15 & -0.134322 & -1.3632 & 0.087893 \tabularnewline
16 & 0.002883 & 0.0293 & 0.488357 \tabularnewline
17 & -0.005865 & -0.0595 & 0.476325 \tabularnewline
18 & 0.14826 & 1.5047 & 0.067734 \tabularnewline
19 & 0.07846 & 0.7963 & 0.21385 \tabularnewline
20 & 0.057066 & 0.5792 & 0.281876 \tabularnewline
21 & 0.163491 & 1.6593 & 0.050053 \tabularnewline
22 & -0.006816 & -0.0692 & 0.472492 \tabularnewline
23 & 0.041195 & 0.4181 & 0.338377 \tabularnewline
24 & -0.092101 & -0.9347 & 0.176059 \tabularnewline
25 & -0.126899 & -1.2879 & 0.100337 \tabularnewline
26 & 0.055871 & 0.567 & 0.285964 \tabularnewline
27 & -0.073677 & -0.7477 & 0.22816 \tabularnewline
28 & 0.033055 & 0.3355 & 0.368974 \tabularnewline
29 & -0.021395 & -0.2171 & 0.414267 \tabularnewline
30 & -0.125527 & -1.274 & 0.102772 \tabularnewline
31 & -0.029821 & -0.3026 & 0.381385 \tabularnewline
32 & -0.00127 & -0.0129 & 0.494869 \tabularnewline
33 & -0.134733 & -1.3674 & 0.08724 \tabularnewline
34 & -0.065638 & -0.6662 & 0.253401 \tabularnewline
35 & 0.04295 & 0.4359 & 0.331913 \tabularnewline
36 & -0.032065 & -0.3254 & 0.372759 \tabularnewline
37 & 0.148833 & 1.5105 & 0.066991 \tabularnewline
38 & -0.00587 & -0.0596 & 0.476304 \tabularnewline
39 & 0.037158 & 0.3771 & 0.353432 \tabularnewline
40 & 0.070444 & 0.7149 & 0.238136 \tabularnewline
41 & -0.021801 & -0.2213 & 0.412667 \tabularnewline
42 & 0.127172 & 1.2907 & 0.099857 \tabularnewline
43 & 0.035019 & 0.3554 & 0.361507 \tabularnewline
44 & -0.043856 & -0.4451 & 0.328596 \tabularnewline
45 & -0.073383 & -0.7448 & 0.229058 \tabularnewline
46 & -0.028531 & -0.2896 & 0.386367 \tabularnewline
47 & -0.028622 & -0.2905 & 0.386017 \tabularnewline
48 & -0.06954 & -0.7058 & 0.240968 \tabularnewline
\hline
\end{tabular}
%Source: https://freestatistics.org/blog/index.php?pk=301939&T=1

[TABLE]
[ROW][C]Autocorrelation Function[/C][/ROW]
[ROW][C]Time lag k[/C][C]ACF(k)[/C][C]T-STAT[/C][C]P-value[/C][/ROW]
[ROW][C]1[/C][C]-0.035357[/C][C]-0.3588[/C][C]0.360226[/C][/ROW]
[ROW][C]2[/C][C]-0.0246[/C][C]-0.2497[/C][C]0.401675[/C][/ROW]
[ROW][C]3[/C][C]0.070966[/C][C]0.7202[/C][C]0.236509[/C][/ROW]
[ROW][C]4[/C][C]-0.165857[/C][C]-1.6833[/C][C]0.047676[/C][/ROW]
[ROW][C]5[/C][C]0.033489[/C][C]0.3399[/C][C]0.36732[/C][/ROW]
[ROW][C]6[/C][C]-0.12682[/C][C]-1.2871[/C][C]0.100474[/C][/ROW]
[ROW][C]7[/C][C]-0.027001[/C][C]-0.274[/C][C]0.392307[/C][/ROW]
[ROW][C]8[/C][C]0.08036[/C][C]0.8156[/C][C]0.208316[/C][/ROW]
[ROW][C]9[/C][C]0.018401[/C][C]0.1867[/C][C]0.426112[/C][/ROW]
[ROW][C]10[/C][C]-0.029251[/C][C]-0.2969[/C][C]0.383582[/C][/ROW]
[ROW][C]11[/C][C]-0.005678[/C][C]-0.0576[/C][C]0.47708[/C][/ROW]
[ROW][C]12[/C][C]-0.291893[/C][C]-2.9624[/C][C]0.001895[/C][/ROW]
[ROW][C]13[/C][C]0.016788[/C][C]0.1704[/C][C]0.432523[/C][/ROW]
[ROW][C]14[/C][C]0.026343[/C][C]0.2674[/C][C]0.394865[/C][/ROW]
[ROW][C]15[/C][C]-0.134322[/C][C]-1.3632[/C][C]0.087893[/C][/ROW]
[ROW][C]16[/C][C]0.002883[/C][C]0.0293[/C][C]0.488357[/C][/ROW]
[ROW][C]17[/C][C]-0.005865[/C][C]-0.0595[/C][C]0.476325[/C][/ROW]
[ROW][C]18[/C][C]0.14826[/C][C]1.5047[/C][C]0.067734[/C][/ROW]
[ROW][C]19[/C][C]0.07846[/C][C]0.7963[/C][C]0.21385[/C][/ROW]
[ROW][C]20[/C][C]0.057066[/C][C]0.5792[/C][C]0.281876[/C][/ROW]
[ROW][C]21[/C][C]0.163491[/C][C]1.6593[/C][C]0.050053[/C][/ROW]
[ROW][C]22[/C][C]-0.006816[/C][C]-0.0692[/C][C]0.472492[/C][/ROW]
[ROW][C]23[/C][C]0.041195[/C][C]0.4181[/C][C]0.338377[/C][/ROW]
[ROW][C]24[/C][C]-0.092101[/C][C]-0.9347[/C][C]0.176059[/C][/ROW]
[ROW][C]25[/C][C]-0.126899[/C][C]-1.2879[/C][C]0.100337[/C][/ROW]
[ROW][C]26[/C][C]0.055871[/C][C]0.567[/C][C]0.285964[/C][/ROW]
[ROW][C]27[/C][C]-0.073677[/C][C]-0.7477[/C][C]0.22816[/C][/ROW]
[ROW][C]28[/C][C]0.033055[/C][C]0.3355[/C][C]0.368974[/C][/ROW]
[ROW][C]29[/C][C]-0.021395[/C][C]-0.2171[/C][C]0.414267[/C][/ROW]
[ROW][C]30[/C][C]-0.125527[/C][C]-1.274[/C][C]0.102772[/C][/ROW]
[ROW][C]31[/C][C]-0.029821[/C][C]-0.3026[/C][C]0.381385[/C][/ROW]
[ROW][C]32[/C][C]-0.00127[/C][C]-0.0129[/C][C]0.494869[/C][/ROW]
[ROW][C]33[/C][C]-0.134733[/C][C]-1.3674[/C][C]0.08724[/C][/ROW]
[ROW][C]34[/C][C]-0.065638[/C][C]-0.6662[/C][C]0.253401[/C][/ROW]
[ROW][C]35[/C][C]0.04295[/C][C]0.4359[/C][C]0.331913[/C][/ROW]
[ROW][C]36[/C][C]-0.032065[/C][C]-0.3254[/C][C]0.372759[/C][/ROW]
[ROW][C]37[/C][C]0.148833[/C][C]1.5105[/C][C]0.066991[/C][/ROW]
[ROW][C]38[/C][C]-0.00587[/C][C]-0.0596[/C][C]0.476304[/C][/ROW]
[ROW][C]39[/C][C]0.037158[/C][C]0.3771[/C][C]0.353432[/C][/ROW]
[ROW][C]40[/C][C]0.070444[/C][C]0.7149[/C][C]0.238136[/C][/ROW]
[ROW][C]41[/C][C]-0.021801[/C][C]-0.2213[/C][C]0.412667[/C][/ROW]
[ROW][C]42[/C][C]0.127172[/C][C]1.2907[/C][C]0.099857[/C][/ROW]
[ROW][C]43[/C][C]0.035019[/C][C]0.3554[/C][C]0.361507[/C][/ROW]
[ROW][C]44[/C][C]-0.043856[/C][C]-0.4451[/C][C]0.328596[/C][/ROW]
[ROW][C]45[/C][C]-0.073383[/C][C]-0.7448[/C][C]0.229058[/C][/ROW]
[ROW][C]46[/C][C]-0.028531[/C][C]-0.2896[/C][C]0.386367[/C][/ROW]
[ROW][C]47[/C][C]-0.028622[/C][C]-0.2905[/C][C]0.386017[/C][/ROW]
[ROW][C]48[/C][C]-0.06954[/C][C]-0.7058[/C][C]0.240968[/C][/ROW]
[/TABLE]
Source: https://freestatistics.org/blog/index.php?pk=301939&T=1

Globally Unique Identifier (entire table): ba.freestatistics.org/blog/index.php?pk=301939&T=1

As an alternative you can also use a QR Code:  

The GUIDs for individual cells are displayed in the table below:

Autocorrelation Function
Time lag kACF(k)T-STATP-value
1-0.035357-0.35880.360226
2-0.0246-0.24970.401675
30.0709660.72020.236509
4-0.165857-1.68330.047676
50.0334890.33990.36732
6-0.12682-1.28710.100474
7-0.027001-0.2740.392307
80.080360.81560.208316
90.0184010.18670.426112
10-0.029251-0.29690.383582
11-0.005678-0.05760.47708
12-0.291893-2.96240.001895
130.0167880.17040.432523
140.0263430.26740.394865
15-0.134322-1.36320.087893
160.0028830.02930.488357
17-0.005865-0.05950.476325
180.148261.50470.067734
190.078460.79630.21385
200.0570660.57920.281876
210.1634911.65930.050053
22-0.006816-0.06920.472492
230.0411950.41810.338377
24-0.092101-0.93470.176059
25-0.126899-1.28790.100337
260.0558710.5670.285964
27-0.073677-0.74770.22816
280.0330550.33550.368974
29-0.021395-0.21710.414267
30-0.125527-1.2740.102772
31-0.029821-0.30260.381385
32-0.00127-0.01290.494869
33-0.134733-1.36740.08724
34-0.065638-0.66620.253401
350.042950.43590.331913
36-0.032065-0.32540.372759
370.1488331.51050.066991
38-0.00587-0.05960.476304
390.0371580.37710.353432
400.0704440.71490.238136
41-0.021801-0.22130.412667
420.1271721.29070.099857
430.0350190.35540.361507
44-0.043856-0.44510.328596
45-0.073383-0.74480.229058
46-0.028531-0.28960.386367
47-0.028622-0.29050.386017
48-0.06954-0.70580.240968


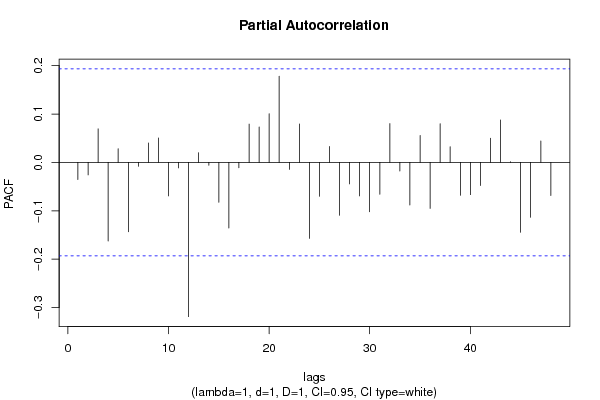
Partial Autocorrelation Function
Time lag kPACF(k)T-STATP-value
1-0.035357-0.35880.360226
2-0.025882-0.26270.396663
30.0692910.70320.24175
4-0.162626-1.65050.050946
50.0283180.28740.387192
6-0.1434-1.45540.074306
7-0.007951-0.08070.467923
80.0400090.4060.342777
90.0505250.51280.304603
10-0.069346-0.70380.241577
11-0.011355-0.11520.454238
12-0.318924-3.23670.000813
130.0199740.20270.419878
14-0.005799-0.05890.476593
15-0.082439-0.83670.202358
16-0.135725-1.37750.085679
17-0.011101-0.11270.45526
180.0790480.80220.212129
190.0731320.74220.229825
200.1004661.01960.155148
210.1782231.80880.036703
22-0.014418-0.14630.441977
230.0793860.80570.211143
24-0.157108-1.59450.056947
25-0.070134-0.71180.239105
260.0327860.33270.370004
27-0.10936-1.10990.134817
28-0.044543-0.45210.326089
29-0.06928-0.70310.241785
30-0.101967-1.03490.151581
31-0.065993-0.66980.252255
320.0800710.81260.209151
33-0.017944-0.18210.427927
34-0.088293-0.89610.186152
350.0554690.56290.287348
36-0.095169-0.96590.168189
370.0799380.81130.209539
380.0322270.32710.372139
39-0.067857-0.68870.246289
40-0.066744-0.67740.249843
41-0.047943-0.48660.3138
420.0498020.50540.307168
430.0875720.88880.188103
440.0014550.01480.494123
45-0.144573-1.46730.072676
46-0.113486-1.15180.126044
470.0442210.44880.327261
48-0.068363-0.69380.244682

\begin{tabular}{lllllllll}
\hline
Partial Autocorrelation Function \tabularnewline
Time lag k & PACF(k) & T-STAT & P-value \tabularnewline
1 & -0.035357 & -0.3588 & 0.360226 \tabularnewline
2 & -0.025882 & -0.2627 & 0.396663 \tabularnewline
3 & 0.069291 & 0.7032 & 0.24175 \tabularnewline
4 & -0.162626 & -1.6505 & 0.050946 \tabularnewline
5 & 0.028318 & 0.2874 & 0.387192 \tabularnewline
6 & -0.1434 & -1.4554 & 0.074306 \tabularnewline
7 & -0.007951 & -0.0807 & 0.467923 \tabularnewline
8 & 0.040009 & 0.406 & 0.342777 \tabularnewline
9 & 0.050525 & 0.5128 & 0.304603 \tabularnewline
10 & -0.069346 & -0.7038 & 0.241577 \tabularnewline
11 & -0.011355 & -0.1152 & 0.454238 \tabularnewline
12 & -0.318924 & -3.2367 & 0.000813 \tabularnewline
13 & 0.019974 & 0.2027 & 0.419878 \tabularnewline
14 & -0.005799 & -0.0589 & 0.476593 \tabularnewline
15 & -0.082439 & -0.8367 & 0.202358 \tabularnewline
16 & -0.135725 & -1.3775 & 0.085679 \tabularnewline
17 & -0.011101 & -0.1127 & 0.45526 \tabularnewline
18 & 0.079048 & 0.8022 & 0.212129 \tabularnewline
19 & 0.073132 & 0.7422 & 0.229825 \tabularnewline
20 & 0.100466 & 1.0196 & 0.155148 \tabularnewline
21 & 0.178223 & 1.8088 & 0.036703 \tabularnewline
22 & -0.014418 & -0.1463 & 0.441977 \tabularnewline
23 & 0.079386 & 0.8057 & 0.211143 \tabularnewline
24 & -0.157108 & -1.5945 & 0.056947 \tabularnewline
25 & -0.070134 & -0.7118 & 0.239105 \tabularnewline
26 & 0.032786 & 0.3327 & 0.370004 \tabularnewline
27 & -0.10936 & -1.1099 & 0.134817 \tabularnewline
28 & -0.044543 & -0.4521 & 0.326089 \tabularnewline
29 & -0.06928 & -0.7031 & 0.241785 \tabularnewline
30 & -0.101967 & -1.0349 & 0.151581 \tabularnewline
31 & -0.065993 & -0.6698 & 0.252255 \tabularnewline
32 & 0.080071 & 0.8126 & 0.209151 \tabularnewline
33 & -0.017944 & -0.1821 & 0.427927 \tabularnewline
34 & -0.088293 & -0.8961 & 0.186152 \tabularnewline
35 & 0.055469 & 0.5629 & 0.287348 \tabularnewline
36 & -0.095169 & -0.9659 & 0.168189 \tabularnewline
37 & 0.079938 & 0.8113 & 0.209539 \tabularnewline
38 & 0.032227 & 0.3271 & 0.372139 \tabularnewline
39 & -0.067857 & -0.6887 & 0.246289 \tabularnewline
40 & -0.066744 & -0.6774 & 0.249843 \tabularnewline
41 & -0.047943 & -0.4866 & 0.3138 \tabularnewline
42 & 0.049802 & 0.5054 & 0.307168 \tabularnewline
43 & 0.087572 & 0.8888 & 0.188103 \tabularnewline
44 & 0.001455 & 0.0148 & 0.494123 \tabularnewline
45 & -0.144573 & -1.4673 & 0.072676 \tabularnewline
46 & -0.113486 & -1.1518 & 0.126044 \tabularnewline
47 & 0.044221 & 0.4488 & 0.327261 \tabularnewline
48 & -0.068363 & -0.6938 & 0.244682 \tabularnewline
\hline
\end{tabular}
%Source: https://freestatistics.org/blog/index.php?pk=301939&T=2

[TABLE]
[ROW][C]Partial Autocorrelation Function[/C][/ROW]
[ROW][C]Time lag k[/C][C]PACF(k)[/C][C]T-STAT[/C][C]P-value[/C][/ROW]
[ROW][C]1[/C][C]-0.035357[/C][C]-0.3588[/C][C]0.360226[/C][/ROW]
[ROW][C]2[/C][C]-0.025882[/C][C]-0.2627[/C][C]0.396663[/C][/ROW]
[ROW][C]3[/C][C]0.069291[/C][C]0.7032[/C][C]0.24175[/C][/ROW]
[ROW][C]4[/C][C]-0.162626[/C][C]-1.6505[/C][C]0.050946[/C][/ROW]
[ROW][C]5[/C][C]0.028318[/C][C]0.2874[/C][C]0.387192[/C][/ROW]
[ROW][C]6[/C][C]-0.1434[/C][C]-1.4554[/C][C]0.074306[/C][/ROW]
[ROW][C]7[/C][C]-0.007951[/C][C]-0.0807[/C][C]0.467923[/C][/ROW]
[ROW][C]8[/C][C]0.040009[/C][C]0.406[/C][C]0.342777[/C][/ROW]
[ROW][C]9[/C][C]0.050525[/C][C]0.5128[/C][C]0.304603[/C][/ROW]
[ROW][C]10[/C][C]-0.069346[/C][C]-0.7038[/C][C]0.241577[/C][/ROW]
[ROW][C]11[/C][C]-0.011355[/C][C]-0.1152[/C][C]0.454238[/C][/ROW]
[ROW][C]12[/C][C]-0.318924[/C][C]-3.2367[/C][C]0.000813[/C][/ROW]
[ROW][C]13[/C][C]0.019974[/C][C]0.2027[/C][C]0.419878[/C][/ROW]
[ROW][C]14[/C][C]-0.005799[/C][C]-0.0589[/C][C]0.476593[/C][/ROW]
[ROW][C]15[/C][C]-0.082439[/C][C]-0.8367[/C][C]0.202358[/C][/ROW]
[ROW][C]16[/C][C]-0.135725[/C][C]-1.3775[/C][C]0.085679[/C][/ROW]
[ROW][C]17[/C][C]-0.011101[/C][C]-0.1127[/C][C]0.45526[/C][/ROW]
[ROW][C]18[/C][C]0.079048[/C][C]0.8022[/C][C]0.212129[/C][/ROW]
[ROW][C]19[/C][C]0.073132[/C][C]0.7422[/C][C]0.229825[/C][/ROW]
[ROW][C]20[/C][C]0.100466[/C][C]1.0196[/C][C]0.155148[/C][/ROW]
[ROW][C]21[/C][C]0.178223[/C][C]1.8088[/C][C]0.036703[/C][/ROW]
[ROW][C]22[/C][C]-0.014418[/C][C]-0.1463[/C][C]0.441977[/C][/ROW]
[ROW][C]23[/C][C]0.079386[/C][C]0.8057[/C][C]0.211143[/C][/ROW]
[ROW][C]24[/C][C]-0.157108[/C][C]-1.5945[/C][C]0.056947[/C][/ROW]
[ROW][C]25[/C][C]-0.070134[/C][C]-0.7118[/C][C]0.239105[/C][/ROW]
[ROW][C]26[/C][C]0.032786[/C][C]0.3327[/C][C]0.370004[/C][/ROW]
[ROW][C]27[/C][C]-0.10936[/C][C]-1.1099[/C][C]0.134817[/C][/ROW]
[ROW][C]28[/C][C]-0.044543[/C][C]-0.4521[/C][C]0.326089[/C][/ROW]
[ROW][C]29[/C][C]-0.06928[/C][C]-0.7031[/C][C]0.241785[/C][/ROW]
[ROW][C]30[/C][C]-0.101967[/C][C]-1.0349[/C][C]0.151581[/C][/ROW]
[ROW][C]31[/C][C]-0.065993[/C][C]-0.6698[/C][C]0.252255[/C][/ROW]
[ROW][C]32[/C][C]0.080071[/C][C]0.8126[/C][C]0.209151[/C][/ROW]
[ROW][C]33[/C][C]-0.017944[/C][C]-0.1821[/C][C]0.427927[/C][/ROW]
[ROW][C]34[/C][C]-0.088293[/C][C]-0.8961[/C][C]0.186152[/C][/ROW]
[ROW][C]35[/C][C]0.055469[/C][C]0.5629[/C][C]0.287348[/C][/ROW]
[ROW][C]36[/C][C]-0.095169[/C][C]-0.9659[/C][C]0.168189[/C][/ROW]
[ROW][C]37[/C][C]0.079938[/C][C]0.8113[/C][C]0.209539[/C][/ROW]
[ROW][C]38[/C][C]0.032227[/C][C]0.3271[/C][C]0.372139[/C][/ROW]
[ROW][C]39[/C][C]-0.067857[/C][C]-0.6887[/C][C]0.246289[/C][/ROW]
[ROW][C]40[/C][C]-0.066744[/C][C]-0.6774[/C][C]0.249843[/C][/ROW]
[ROW][C]41[/C][C]-0.047943[/C][C]-0.4866[/C][C]0.3138[/C][/ROW]
[ROW][C]42[/C][C]0.049802[/C][C]0.5054[/C][C]0.307168[/C][/ROW]
[ROW][C]43[/C][C]0.087572[/C][C]0.8888[/C][C]0.188103[/C][/ROW]
[ROW][C]44[/C][C]0.001455[/C][C]0.0148[/C][C]0.494123[/C][/ROW]
[ROW][C]45[/C][C]-0.144573[/C][C]-1.4673[/C][C]0.072676[/C][/ROW]
[ROW][C]46[/C][C]-0.113486[/C][C]-1.1518[/C][C]0.126044[/C][/ROW]
[ROW][C]47[/C][C]0.044221[/C][C]0.4488[/C][C]0.327261[/C][/ROW]
[ROW][C]48[/C][C]-0.068363[/C][C]-0.6938[/C][C]0.244682[/C][/ROW]
[/TABLE]
Source: https://freestatistics.org/blog/index.php?pk=301939&T=2

Globally Unique Identifier (entire table): ba.freestatistics.org/blog/index.php?pk=301939&T=2

As an alternative you can also use a QR Code:  

The GUIDs for individual cells are displayed in the table below:

Partial Autocorrelation Function
Time lag kPACF(k)T-STATP-value
1-0.035357-0.35880.360226
2-0.025882-0.26270.396663
30.0692910.70320.24175
4-0.162626-1.65050.050946
50.0283180.28740.387192
6-0.1434-1.45540.074306
7-0.007951-0.08070.467923
80.0400090.4060.342777
90.0505250.51280.304603
10-0.069346-0.70380.241577
11-0.011355-0.11520.454238
12-0.318924-3.23670.000813
130.0199740.20270.419878
14-0.005799-0.05890.476593
15-0.082439-0.83670.202358
16-0.135725-1.37750.085679
17-0.011101-0.11270.45526
180.0790480.80220.212129
190.0731320.74220.229825
200.1004661.01960.155148
210.1782231.80880.036703
22-0.014418-0.14630.441977
230.0793860.80570.211143
24-0.157108-1.59450.056947
25-0.070134-0.71180.239105
260.0327860.33270.370004
27-0.10936-1.10990.134817
28-0.044543-0.45210.326089
29-0.06928-0.70310.241785
30-0.101967-1.03490.151581
31-0.065993-0.66980.252255
320.0800710.81260.209151
33-0.017944-0.18210.427927
34-0.088293-0.89610.186152
350.0554690.56290.287348
36-0.095169-0.96590.168189
370.0799380.81130.209539
380.0322270.32710.372139
39-0.067857-0.68870.246289
40-0.066744-0.67740.249843
41-0.047943-0.48660.3138
420.0498020.50540.307168
430.0875720.88880.188103
440.0014550.01480.494123
45-0.144573-1.46730.072676
46-0.113486-1.15180.126044
470.0442210.44880.327261
48-0.068363-0.69380.244682


Parameters (Session):
par1 = 48 ; par2 = 1 ; par3 = 1 ; par4 = 1 ; par5 = 12 ; par6 = White Noise ; par7 = 0.95 ;
Parameters (R input):
par1 = 48 ; par2 = 1 ; par3 = 1 ; par4 = 1 ; par5 = 12 ; par6 = White Noise ; par7 = 0.95 ; par8 = ;
R code (references can be found in the software module):
if (par1 == 'Default') {
par1 = 10*log10(length(x))
} else {
par1 <- as.numeric(par1)
}
par2 <- as.numeric(par2)
par3 <- as.numeric(par3)
par4 <- as.numeric(par4)
par5 <- as.numeric(par5)
if (par6 == 'White Noise') par6 <- 'white' else par6 <- 'ma'
par7 <- as.numeric(par7)
if (par8 != '') par8 <- as.numeric(par8)
x <- na.omit(x)
ox <- x
if (par8 == '') {
if (par2 == 0) {
x <- log(x)
} else {
x <- (x ^ par2 - 1) / par2
}
} else {
x <- log(x,base=par8)
}
if (par3 > 0) x <- diff(x,lag=1,difference=par3)
if (par4 > 0) x <- diff(x,lag=par5,difference=par4)
bitmap(file='picts.png')
op <- par(mfrow=c(2,1))
plot(ox,type='l',main='Original Time Series',xlab='time',ylab='value')
if (par8=='') {
mytitle <- paste('Working Time Series (lambda=',par2,', d=',par3,', D=',par4,')',sep='')
mysub <- paste('(lambda=',par2,', d=',par3,', D=',par4,', CI=', par7, ', CI type=',par6,')',sep='')
} else {
mytitle <- paste('Working Time Series (base=',par8,', d=',par3,', D=',par4,')',sep='')
mysub <- paste('(base=',par8,', d=',par3,', D=',par4,', CI=', par7, ', CI type=',par6,')',sep='')
}
plot(x,type='l', main=mytitle,xlab='time',ylab='value')
par(op)
dev.off()
bitmap(file='pic1.png')
racf <- acf(x, par1, main='Autocorrelation', xlab='time lag', ylab='ACF', ci.type=par6, ci=par7, sub=mysub)
dev.off()
bitmap(file='pic2.png')
rpacf <- pacf(x,par1,main='Partial Autocorrelation',xlab='lags',ylab='PACF',sub=mysub)
dev.off()
(myacf <- c(racf$acf))
(mypacf <- c(rpacf$acf))
lengthx <- length(x)
sqrtn <- sqrt(lengthx)
load(file='createtable')
a<-table.start()
a<-table.row.start(a)
a<-table.element(a,'Autocorrelation Function',4,TRUE)
a<-table.row.end(a)
a<-table.row.start(a)
a<-table.element(a,'Time lag k',header=TRUE)
a<-table.element(a,'ACF(k)',header=TRUE)
a<-table.element(a,'T-STAT',header=TRUE)
a<-table.element(a,'P-value',header=TRUE)
a<-table.row.end(a)
for (i in 2:(par1+1)) {
a<-table.row.start(a)
a<-table.element(a,i-1,header=TRUE)
a<-table.element(a,round(myacf[i],6))
mytstat <- myacf[i]*sqrtn
a<-table.element(a,round(mytstat,4))
a<-table.element(a,round(1-pt(abs(mytstat),lengthx),6))
a<-table.row.end(a)
}
a<-table.end(a)
table.save(a,file='mytable.tab')
a<-table.start()
a<-table.row.start(a)
a<-table.element(a,'Partial Autocorrelation Function',4,TRUE)
a<-table.row.end(a)
a<-table.row.start(a)
a<-table.element(a,'Time lag k',header=TRUE)
a<-table.element(a,'PACF(k)',header=TRUE)
a<-table.element(a,'T-STAT',header=TRUE)
a<-table.element(a,'P-value',header=TRUE)
a<-table.row.end(a)
for (i in 1:par1) {
a<-table.row.start(a)
a<-table.element(a,i,header=TRUE)
a<-table.element(a,round(mypacf[i],6))
mytstat <- mypacf[i]*sqrtn
a<-table.element(a,round(mytstat,4))
a<-table.element(a,round(1-pt(abs(mytstat),lengthx),6))
a<-table.row.end(a)
}
a<-table.end(a)
table.save(a,file='mytable1.tab')