Free Statistics

of Irreproducible Research!

Author's title

Author*Unverified author*
R Software Modulerwasp_autocorrelation.wasp
Title produced by software(Partial) Autocorrelation Function
Date of computationWed, 21 Dec 2016 10:36:33 +0000
Cite this page as followsStatistical Computations at FreeStatistics.org, Office for Research Development and Education, URL https://freestatistics.org/blog/index.php?v=date/2016/Dec/21/t1482316615ss070ph2e2nvxi1.htm/, Retrieved Mon, 06 May 2024 14:22:17 +0200
Statistical Computations at FreeStatistics.org, Office for Research Development and Education, URL https://freestatistics.org/blog/index.php?pk=, Retrieved Mon, 06 May 2024 14:22:17 +0200
QR Codes:

Original text written by user:
IsPrivate?No (this computation is public)
User-defined keywords
Estimated Impact0
Dataseries X:
5610
3530
2370
11610
4630
8760
4130
5400
5630
7050
5620
5510
4240
3620
4220
3480
3400
4830
3060
8030
8480
7270
10030
7810
6470
5150
4580
2640
2180
6250
4310
6160
8560
6250
8940
8040
6290
2630
4760
3820
2350
2420
4780
6120
4290
5540
6120
5110
4800
2670
5120
2370
3280
4090
2250
2520
3670
6440
5490
2000
2130
1210
6770
2380
2380
3760
3860
4590
4580
8030
5880
1770
5440
4090
3360
1240
1890
3390
2980
5030
3720
3530
1620
2290
2050
2070
2760
1500
1850
2760
3360
2120
3970
3760
3630
1850
3160
2700
1080
1150
1230
2180
2310
2940
4370
4750
7810
2880


Summary of computational transaction
Raw Inputview raw input (R code)
Raw Outputview raw output of R engine
Computing time2 seconds
R Server'Sir Maurice George Kendall' @ kendall.wessa.net

\begin{tabular}{lllllllll}
\hline
Summary of computational transaction \tabularnewline
Raw Input & view raw input (R code)  \tabularnewline
Raw Output & view raw output of R engine  \tabularnewline
Computing time & 2 seconds \tabularnewline
R Server & 'Sir Maurice George Kendall' @ kendall.wessa.net \tabularnewline
\hline
\end{tabular}
%Source: https://freestatistics.org/blog/index.php?pk=&T=0

[TABLE]
[ROW][C]Summary of computational transaction[/C][/ROW]
[ROW][C]Raw Input[/C][C]view raw input (R code) [/C][/ROW]
[ROW][C]Raw Output[/C][C]view raw output of R engine [/C][/ROW]
[ROW][C]Computing time[/C][C]2 seconds[/C][/ROW]
[ROW][C]R Server[/C][C]'Sir Maurice George Kendall' @ kendall.wessa.net[/C][/ROW]
[/TABLE]
Source: https://freestatistics.org/blog/index.php?pk=&T=0

Globally Unique Identifier (entire table): ba.freestatistics.org/blog/index.php?pk=&T=0

As an alternative you can also use a QR Code:  

The GUIDs for individual cells are displayed in the table below:

Summary of computational transaction
Raw Inputview raw input (R code)
Raw Outputview raw output of R engine
Computing time2 seconds
R Server'Sir Maurice George Kendall' @ kendall.wessa.net


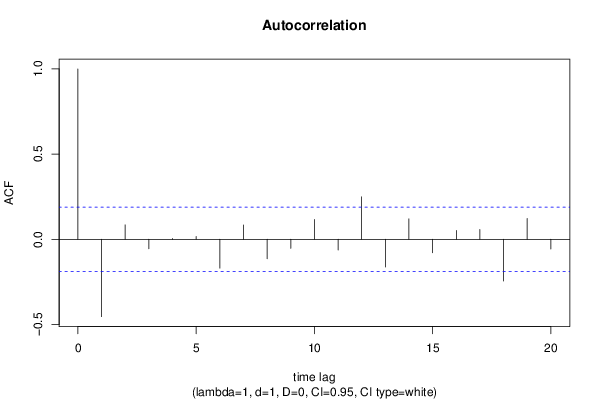
Autocorrelation Function
Time lag kACF(k)T-STATP-value
1-0.454008-4.69634e-06
20.0846710.87580.191538
3-0.05575-0.57670.282684
40.0046610.04820.480818
50.0169070.17490.430748
6-0.169181-1.750.041491
70.0836290.86510.19447
8-0.114669-1.18610.119097
9-0.053075-0.5490.292072
100.1158461.19830.11672
11-0.062861-0.65020.258467
120.2490592.57630.005675
13-0.162624-1.68220.047723
140.120111.24240.108397
15-0.078497-0.8120.209303
160.0512620.53030.298515
170.0577580.59750.275732
18-0.244773-2.5320.006398
190.1223291.26540.104241
20-0.056933-0.58890.278577

\begin{tabular}{lllllllll}
\hline
Autocorrelation Function \tabularnewline
Time lag k & ACF(k) & T-STAT & P-value \tabularnewline
1 & -0.454008 & -4.6963 & 4e-06 \tabularnewline
2 & 0.084671 & 0.8758 & 0.191538 \tabularnewline
3 & -0.05575 & -0.5767 & 0.282684 \tabularnewline
4 & 0.004661 & 0.0482 & 0.480818 \tabularnewline
5 & 0.016907 & 0.1749 & 0.430748 \tabularnewline
6 & -0.169181 & -1.75 & 0.041491 \tabularnewline
7 & 0.083629 & 0.8651 & 0.19447 \tabularnewline
8 & -0.114669 & -1.1861 & 0.119097 \tabularnewline
9 & -0.053075 & -0.549 & 0.292072 \tabularnewline
10 & 0.115846 & 1.1983 & 0.11672 \tabularnewline
11 & -0.062861 & -0.6502 & 0.258467 \tabularnewline
12 & 0.249059 & 2.5763 & 0.005675 \tabularnewline
13 & -0.162624 & -1.6822 & 0.047723 \tabularnewline
14 & 0.12011 & 1.2424 & 0.108397 \tabularnewline
15 & -0.078497 & -0.812 & 0.209303 \tabularnewline
16 & 0.051262 & 0.5303 & 0.298515 \tabularnewline
17 & 0.057758 & 0.5975 & 0.275732 \tabularnewline
18 & -0.244773 & -2.532 & 0.006398 \tabularnewline
19 & 0.122329 & 1.2654 & 0.104241 \tabularnewline
20 & -0.056933 & -0.5889 & 0.278577 \tabularnewline
\hline
\end{tabular}
%Source: https://freestatistics.org/blog/index.php?pk=&T=1

[TABLE]
[ROW][C]Autocorrelation Function[/C][/ROW]
[ROW][C]Time lag k[/C][C]ACF(k)[/C][C]T-STAT[/C][C]P-value[/C][/ROW]
[ROW][C]1[/C][C]-0.454008[/C][C]-4.6963[/C][C]4e-06[/C][/ROW]
[ROW][C]2[/C][C]0.084671[/C][C]0.8758[/C][C]0.191538[/C][/ROW]
[ROW][C]3[/C][C]-0.05575[/C][C]-0.5767[/C][C]0.282684[/C][/ROW]
[ROW][C]4[/C][C]0.004661[/C][C]0.0482[/C][C]0.480818[/C][/ROW]
[ROW][C]5[/C][C]0.016907[/C][C]0.1749[/C][C]0.430748[/C][/ROW]
[ROW][C]6[/C][C]-0.169181[/C][C]-1.75[/C][C]0.041491[/C][/ROW]
[ROW][C]7[/C][C]0.083629[/C][C]0.8651[/C][C]0.19447[/C][/ROW]
[ROW][C]8[/C][C]-0.114669[/C][C]-1.1861[/C][C]0.119097[/C][/ROW]
[ROW][C]9[/C][C]-0.053075[/C][C]-0.549[/C][C]0.292072[/C][/ROW]
[ROW][C]10[/C][C]0.115846[/C][C]1.1983[/C][C]0.11672[/C][/ROW]
[ROW][C]11[/C][C]-0.062861[/C][C]-0.6502[/C][C]0.258467[/C][/ROW]
[ROW][C]12[/C][C]0.249059[/C][C]2.5763[/C][C]0.005675[/C][/ROW]
[ROW][C]13[/C][C]-0.162624[/C][C]-1.6822[/C][C]0.047723[/C][/ROW]
[ROW][C]14[/C][C]0.12011[/C][C]1.2424[/C][C]0.108397[/C][/ROW]
[ROW][C]15[/C][C]-0.078497[/C][C]-0.812[/C][C]0.209303[/C][/ROW]
[ROW][C]16[/C][C]0.051262[/C][C]0.5303[/C][C]0.298515[/C][/ROW]
[ROW][C]17[/C][C]0.057758[/C][C]0.5975[/C][C]0.275732[/C][/ROW]
[ROW][C]18[/C][C]-0.244773[/C][C]-2.532[/C][C]0.006398[/C][/ROW]
[ROW][C]19[/C][C]0.122329[/C][C]1.2654[/C][C]0.104241[/C][/ROW]
[ROW][C]20[/C][C]-0.056933[/C][C]-0.5889[/C][C]0.278577[/C][/ROW]
[/TABLE]
Source: https://freestatistics.org/blog/index.php?pk=&T=1

Globally Unique Identifier (entire table): ba.freestatistics.org/blog/index.php?pk=&T=1

As an alternative you can also use a QR Code:  

The GUIDs for individual cells are displayed in the table below:

Autocorrelation Function
Time lag kACF(k)T-STATP-value
1-0.454008-4.69634e-06
20.0846710.87580.191538
3-0.05575-0.57670.282684
40.0046610.04820.480818
50.0169070.17490.430748
6-0.169181-1.750.041491
70.0836290.86510.19447
8-0.114669-1.18610.119097
9-0.053075-0.5490.292072
100.1158461.19830.11672
11-0.062861-0.65020.258467
120.2490592.57630.005675
13-0.162624-1.68220.047723
140.120111.24240.108397
15-0.078497-0.8120.209303
160.0512620.53030.298515
170.0577580.59750.275732
18-0.244773-2.5320.006398
190.1223291.26540.104241
20-0.056933-0.58890.278577


Partial Autocorrelation Function
Time lag kPACF(k)T-STATP-value
1-0.454008-4.69634e-06
2-0.152986-1.58250.058244
3-0.104326-1.07920.141472
4-0.071981-0.74460.229081
5-0.017707-0.18320.427508
6-0.220532-2.28120.012258
7-0.138568-1.43340.077335
8-0.215858-2.23290.01382
9-0.334413-3.45920.00039
10-0.18772-1.94180.027396
11-0.244118-2.52520.006515
120.0566210.58570.279657
13-0.036399-0.37650.353642
14-0.007387-0.07640.469618
15-0.099185-1.0260.153608
16-0.050905-0.52660.299792
170.0971961.00540.158485
18-0.124631-1.28920.100055
19-0.051555-0.53330.29747
200.0346770.35870.360264

\begin{tabular}{lllllllll}
\hline
Partial Autocorrelation Function \tabularnewline
Time lag k & PACF(k) & T-STAT & P-value \tabularnewline
1 & -0.454008 & -4.6963 & 4e-06 \tabularnewline
2 & -0.152986 & -1.5825 & 0.058244 \tabularnewline
3 & -0.104326 & -1.0792 & 0.141472 \tabularnewline
4 & -0.071981 & -0.7446 & 0.229081 \tabularnewline
5 & -0.017707 & -0.1832 & 0.427508 \tabularnewline
6 & -0.220532 & -2.2812 & 0.012258 \tabularnewline
7 & -0.138568 & -1.4334 & 0.077335 \tabularnewline
8 & -0.215858 & -2.2329 & 0.01382 \tabularnewline
9 & -0.334413 & -3.4592 & 0.00039 \tabularnewline
10 & -0.18772 & -1.9418 & 0.027396 \tabularnewline
11 & -0.244118 & -2.5252 & 0.006515 \tabularnewline
12 & 0.056621 & 0.5857 & 0.279657 \tabularnewline
13 & -0.036399 & -0.3765 & 0.353642 \tabularnewline
14 & -0.007387 & -0.0764 & 0.469618 \tabularnewline
15 & -0.099185 & -1.026 & 0.153608 \tabularnewline
16 & -0.050905 & -0.5266 & 0.299792 \tabularnewline
17 & 0.097196 & 1.0054 & 0.158485 \tabularnewline
18 & -0.124631 & -1.2892 & 0.100055 \tabularnewline
19 & -0.051555 & -0.5333 & 0.29747 \tabularnewline
20 & 0.034677 & 0.3587 & 0.360264 \tabularnewline
\hline
\end{tabular}
%Source: https://freestatistics.org/blog/index.php?pk=&T=2

[TABLE]
[ROW][C]Partial Autocorrelation Function[/C][/ROW]
[ROW][C]Time lag k[/C][C]PACF(k)[/C][C]T-STAT[/C][C]P-value[/C][/ROW]
[ROW][C]1[/C][C]-0.454008[/C][C]-4.6963[/C][C]4e-06[/C][/ROW]
[ROW][C]2[/C][C]-0.152986[/C][C]-1.5825[/C][C]0.058244[/C][/ROW]
[ROW][C]3[/C][C]-0.104326[/C][C]-1.0792[/C][C]0.141472[/C][/ROW]
[ROW][C]4[/C][C]-0.071981[/C][C]-0.7446[/C][C]0.229081[/C][/ROW]
[ROW][C]5[/C][C]-0.017707[/C][C]-0.1832[/C][C]0.427508[/C][/ROW]
[ROW][C]6[/C][C]-0.220532[/C][C]-2.2812[/C][C]0.012258[/C][/ROW]
[ROW][C]7[/C][C]-0.138568[/C][C]-1.4334[/C][C]0.077335[/C][/ROW]
[ROW][C]8[/C][C]-0.215858[/C][C]-2.2329[/C][C]0.01382[/C][/ROW]
[ROW][C]9[/C][C]-0.334413[/C][C]-3.4592[/C][C]0.00039[/C][/ROW]
[ROW][C]10[/C][C]-0.18772[/C][C]-1.9418[/C][C]0.027396[/C][/ROW]
[ROW][C]11[/C][C]-0.244118[/C][C]-2.5252[/C][C]0.006515[/C][/ROW]
[ROW][C]12[/C][C]0.056621[/C][C]0.5857[/C][C]0.279657[/C][/ROW]
[ROW][C]13[/C][C]-0.036399[/C][C]-0.3765[/C][C]0.353642[/C][/ROW]
[ROW][C]14[/C][C]-0.007387[/C][C]-0.0764[/C][C]0.469618[/C][/ROW]
[ROW][C]15[/C][C]-0.099185[/C][C]-1.026[/C][C]0.153608[/C][/ROW]
[ROW][C]16[/C][C]-0.050905[/C][C]-0.5266[/C][C]0.299792[/C][/ROW]
[ROW][C]17[/C][C]0.097196[/C][C]1.0054[/C][C]0.158485[/C][/ROW]
[ROW][C]18[/C][C]-0.124631[/C][C]-1.2892[/C][C]0.100055[/C][/ROW]
[ROW][C]19[/C][C]-0.051555[/C][C]-0.5333[/C][C]0.29747[/C][/ROW]
[ROW][C]20[/C][C]0.034677[/C][C]0.3587[/C][C]0.360264[/C][/ROW]
[/TABLE]
Source: https://freestatistics.org/blog/index.php?pk=&T=2

Globally Unique Identifier (entire table): ba.freestatistics.org/blog/index.php?pk=&T=2

As an alternative you can also use a QR Code:  

The GUIDs for individual cells are displayed in the table below:

Partial Autocorrelation Function
Time lag kPACF(k)T-STATP-value
1-0.454008-4.69634e-06
2-0.152986-1.58250.058244
3-0.104326-1.07920.141472
4-0.071981-0.74460.229081
5-0.017707-0.18320.427508
6-0.220532-2.28120.012258
7-0.138568-1.43340.077335
8-0.215858-2.23290.01382
9-0.334413-3.45920.00039
10-0.18772-1.94180.027396
11-0.244118-2.52520.006515
120.0566210.58570.279657
13-0.036399-0.37650.353642
14-0.007387-0.07640.469618
15-0.099185-1.0260.153608
16-0.050905-0.52660.299792
170.0971961.00540.158485
18-0.124631-1.28920.100055
19-0.051555-0.53330.29747
200.0346770.35870.360264


Parameters (Session):
par1 = Default ; par2 = 1 ; par3 = 1 ; par4 = 0 ; par5 = 12 ; par6 = White Noise ; par7 = 0.95 ;
Parameters (R input):
par1 = Default ; par2 = 1 ; par3 = 1 ; par4 = 0 ; par5 = 12 ; par6 = White Noise ; par7 = 0.95 ; par8 = ;
R code (references can be found in the software module):
if (par1 == 'Default') {
par1 = 10*log10(length(x))
} else {
par1 <- as.numeric(par1)
}
par2 <- as.numeric(par2)
par3 <- as.numeric(par3)
par4 <- as.numeric(par4)
par5 <- as.numeric(par5)
if (par6 == 'White Noise') par6 <- 'white' else par6 <- 'ma'
par7 <- as.numeric(par7)
if (par8 != '') par8 <- as.numeric(par8)
x <- na.omit(x)
ox <- x
if (par8 == '') {
if (par2 == 0) {
x <- log(x)
} else {
x <- (x ^ par2 - 1) / par2
}
} else {
x <- log(x,base=par8)
}
if (par3 > 0) x <- diff(x,lag=1,difference=par3)
if (par4 > 0) x <- diff(x,lag=par5,difference=par4)
bitmap(file='picts.png')
op <- par(mfrow=c(2,1))
plot(ox,type='l',main='Original Time Series',xlab='time',ylab='value')
if (par8=='') {
mytitle <- paste('Working Time Series (lambda=',par2,', d=',par3,', D=',par4,')',sep='')
mysub <- paste('(lambda=',par2,', d=',par3,', D=',par4,', CI=', par7, ', CI type=',par6,')',sep='')
} else {
mytitle <- paste('Working Time Series (base=',par8,', d=',par3,', D=',par4,')',sep='')
mysub <- paste('(base=',par8,', d=',par3,', D=',par4,', CI=', par7, ', CI type=',par6,')',sep='')
}
plot(x,type='l', main=mytitle,xlab='time',ylab='value')
par(op)
dev.off()
bitmap(file='pic1.png')
racf <- acf(x, par1, main='Autocorrelation', xlab='time lag', ylab='ACF', ci.type=par6, ci=par7, sub=mysub)
dev.off()
bitmap(file='pic2.png')
rpacf <- pacf(x,par1,main='Partial Autocorrelation',xlab='lags',ylab='PACF',sub=mysub)
dev.off()
(myacf <- c(racf$acf))
(mypacf <- c(rpacf$acf))
lengthx <- length(x)
sqrtn <- sqrt(lengthx)
load(file='createtable')
a<-table.start()
a<-table.row.start(a)
a<-table.element(a,'Autocorrelation Function',4,TRUE)
a<-table.row.end(a)
a<-table.row.start(a)
a<-table.element(a,'Time lag k',header=TRUE)
a<-table.element(a,hyperlink('basics.htm','ACF(k)','click here for more information about the Autocorrelation Function'),header=TRUE)
a<-table.element(a,'T-STAT',header=TRUE)
a<-table.element(a,'P-value',header=TRUE)
a<-table.row.end(a)
for (i in 2:(par1+1)) {
a<-table.row.start(a)
a<-table.element(a,i-1,header=TRUE)
a<-table.element(a,round(myacf[i],6))
mytstat <- myacf[i]*sqrtn
a<-table.element(a,round(mytstat,4))
a<-table.element(a,round(1-pt(abs(mytstat),lengthx),6))
a<-table.row.end(a)
}
a<-table.end(a)
table.save(a,file='mytable.tab')
a<-table.start()
a<-table.row.start(a)
a<-table.element(a,'Partial Autocorrelation Function',4,TRUE)
a<-table.row.end(a)
a<-table.row.start(a)
a<-table.element(a,'Time lag k',header=TRUE)
a<-table.element(a,hyperlink('basics.htm','PACF(k)','click here for more information about the Partial Autocorrelation Function'),header=TRUE)
a<-table.element(a,'T-STAT',header=TRUE)
a<-table.element(a,'P-value',header=TRUE)
a<-table.row.end(a)
for (i in 1:par1) {
a<-table.row.start(a)
a<-table.element(a,i,header=TRUE)
a<-table.element(a,round(mypacf[i],6))
mytstat <- mypacf[i]*sqrtn
a<-table.element(a,round(mytstat,4))
a<-table.element(a,round(1-pt(abs(mytstat),lengthx),6))
a<-table.row.end(a)
}
a<-table.end(a)
table.save(a,file='mytable1.tab')