Free Statistics

of Irreproducible Research!

Author's title

Author*The author of this computation has been verified*
R Software Modulerwasp_autocorrelation.wasp
Title produced by software(Partial) Autocorrelation Function
Date of computationWed, 21 Dec 2016 11:41:39 +0100
Cite this page as followsStatistical Computations at FreeStatistics.org, Office for Research Development and Education, URL https://freestatistics.org/blog/index.php?v=date/2016/Dec/21/t1482316940f8w5qbxpv5seins.htm/, Retrieved Mon, 06 May 2024 17:42:13 +0000
Statistical Computations at FreeStatistics.org, Office for Research Development and Education, URL https://freestatistics.org/blog/index.php?pk=302126, Retrieved Mon, 06 May 2024 17:42:13 +0000
QR Codes:

Original text written by user:
IsPrivate?No (this computation is public)
User-defined keywords
Estimated Impact53
Family? (F = Feedback message, R = changed R code, M = changed R Module, P = changed Parameters, D = changed Data)
-       [(Partial) Autocorrelation Function] [] [2016-12-21 10:41:39] [6deb082de88ded72ec069288c69f9f98] [Current]
Feedback Forum

Post a new message
Dataseries X:
1.894
1.757
3.582
5.321
5.561
5.907
4.944
4.966
3.258
1.964
1.743
1.262
2.086
1.793
3.548
5.672
6.084
4.914
4.990
5.139
3.218
2.179
2.238
1.442
2.205
2.025
3.531
4.977
7.998
4.880
5.231
5.202
3.303
2.683
2.202
1.376
2.422
1.997
3.163
5.964
5.657
6.415
6.208
4.500
2.939
2.702
2.090
1.504
2.549
1.931
3.013
6.204
5.788
5.611
5.594
4.647
3.490
2.487
1.992
1.507
2.306
2.002
3.075
5.331
5.589
5.813
4.876
4.665
3.601
2.192
2.111
1.580
2.288
1.993
3.228
5.000
5.480
5.770
4.962
4.685
3.607
2.222
2.467
1.594
2.228
1.910
3.157
4.809
6.249
4.607
4.975
4.784
3.028
2.461
2.218
1.351
2.070
1.887
3.024
4.596
6.398
4.459
5.382
4.359
2.687
2.249
2.154
1.169
2.429
1.762
2.846
5.627
5.749
4.502
5.720
4.403
2.867
2.635
2.059
1.511
2.359
1.741
2.917
6.249
5.760
6.250
5.134
4.831
3.695
2.462
2.146
1.579


Summary of computational transaction
Raw Input view raw input (R code)
Raw Outputview raw output of R engine
Computing time1 seconds
R ServerBig Analytics Cloud Computing Center

\begin{tabular}{lllllllll}
\hline
Summary of computational transaction \tabularnewline
Raw Input view raw input (R code)  \tabularnewline
Raw Outputview raw output of R engine  \tabularnewline
Computing time1 seconds \tabularnewline
R ServerBig Analytics Cloud Computing Center \tabularnewline
\hline
\end{tabular}
%Source: https://freestatistics.org/blog/index.php?pk=302126&T=0

[TABLE]
[ROW]
Summary of computational transaction[/C][/ROW] [ROW]Raw Input[/C] view raw input (R code) [/C][/ROW] [ROW]Raw Output[/C]view raw output of R engine [/C][/ROW] [ROW]Computing time[/C]1 seconds[/C][/ROW] [ROW]R Server[/C]Big Analytics Cloud Computing Center[/C][/ROW] [/TABLE] Source: https://freestatistics.org/blog/index.php?pk=302126&T=0

Globally Unique Identifier (entire table): ba.freestatistics.org/blog/index.php?pk=302126&T=0

As an alternative you can also use a QR Code:  

The GUIDs for individual cells are displayed in the table below:

Summary of computational transaction
Raw Input view raw input (R code)
Raw Outputview raw output of R engine
Computing time1 seconds
R ServerBig Analytics Cloud Computing Center


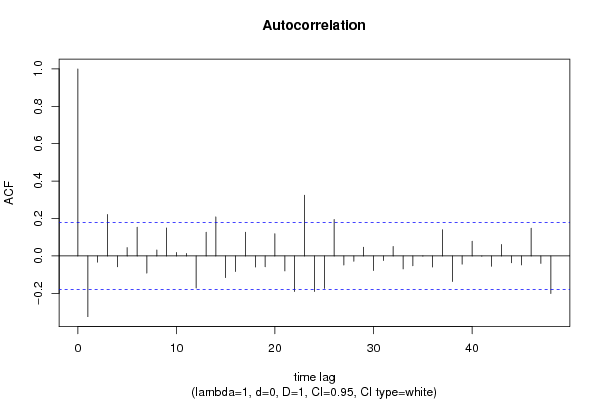
Autocorrelation Function
Time lag kACF(k)T-STATP-value
1-0.324755-3.55750.000269
2-0.033174-0.36340.35847
30.2218592.43030.008282
4-0.058108-0.63650.262818
50.0444340.48680.313661
60.1538421.68530.047269
7-0.09185-1.00620.158179
80.0320650.35130.363006
90.149581.63860.051961
100.0185040.20270.419855
110.0132610.14530.44237
12-0.171769-1.88160.031154
130.1270251.39150.083326
140.2087162.28640.011993
15-0.115876-1.26940.103386
16-0.08371-0.9170.180493
170.1265221.3860.084161
18-0.058917-0.64540.259949
19-0.058158-0.63710.262642
200.1185831.2990.098216
21-0.079943-0.87570.191462
22-0.190308-2.08470.019608
230.3249023.55910.000267
24-0.190684-2.08880.019418
25-0.173436-1.89990.029923
260.1950712.13690.017318
27-0.048871-0.53540.296698
28-0.028926-0.31690.375945
290.0465490.50990.305524
30-0.077947-0.85390.19744
31-0.024346-0.26670.39508
320.0507480.55590.289653
33-0.069234-0.75840.224842
34-0.052693-0.57720.282435
35-0.000809-0.00890.496471
36-0.059353-0.65020.25841
370.1397841.53130.064169
38-0.136665-1.49710.068498
39-0.043865-0.48050.315867
400.078590.86090.195504
41-0.00221-0.02420.490363
42-0.055035-0.60290.273862
430.0608670.66680.253103
44-0.03613-0.39580.346484
45-0.047804-0.52370.300739
460.1478761.61990.05394
47-0.039963-0.43780.33117
48-0.20103-2.20220.014782

\begin{tabular}{lllllllll}
\hline
Autocorrelation Function \tabularnewline
Time lag k & ACF(k) & T-STAT & P-value \tabularnewline
1 & -0.324755 & -3.5575 & 0.000269 \tabularnewline
2 & -0.033174 & -0.3634 & 0.35847 \tabularnewline
3 & 0.221859 & 2.4303 & 0.008282 \tabularnewline
4 & -0.058108 & -0.6365 & 0.262818 \tabularnewline
5 & 0.044434 & 0.4868 & 0.313661 \tabularnewline
6 & 0.153842 & 1.6853 & 0.047269 \tabularnewline
7 & -0.09185 & -1.0062 & 0.158179 \tabularnewline
8 & 0.032065 & 0.3513 & 0.363006 \tabularnewline
9 & 0.14958 & 1.6386 & 0.051961 \tabularnewline
10 & 0.018504 & 0.2027 & 0.419855 \tabularnewline
11 & 0.013261 & 0.1453 & 0.44237 \tabularnewline
12 & -0.171769 & -1.8816 & 0.031154 \tabularnewline
13 & 0.127025 & 1.3915 & 0.083326 \tabularnewline
14 & 0.208716 & 2.2864 & 0.011993 \tabularnewline
15 & -0.115876 & -1.2694 & 0.103386 \tabularnewline
16 & -0.08371 & -0.917 & 0.180493 \tabularnewline
17 & 0.126522 & 1.386 & 0.084161 \tabularnewline
18 & -0.058917 & -0.6454 & 0.259949 \tabularnewline
19 & -0.058158 & -0.6371 & 0.262642 \tabularnewline
20 & 0.118583 & 1.299 & 0.098216 \tabularnewline
21 & -0.079943 & -0.8757 & 0.191462 \tabularnewline
22 & -0.190308 & -2.0847 & 0.019608 \tabularnewline
23 & 0.324902 & 3.5591 & 0.000267 \tabularnewline
24 & -0.190684 & -2.0888 & 0.019418 \tabularnewline
25 & -0.173436 & -1.8999 & 0.029923 \tabularnewline
26 & 0.195071 & 2.1369 & 0.017318 \tabularnewline
27 & -0.048871 & -0.5354 & 0.296698 \tabularnewline
28 & -0.028926 & -0.3169 & 0.375945 \tabularnewline
29 & 0.046549 & 0.5099 & 0.305524 \tabularnewline
30 & -0.077947 & -0.8539 & 0.19744 \tabularnewline
31 & -0.024346 & -0.2667 & 0.39508 \tabularnewline
32 & 0.050748 & 0.5559 & 0.289653 \tabularnewline
33 & -0.069234 & -0.7584 & 0.224842 \tabularnewline
34 & -0.052693 & -0.5772 & 0.282435 \tabularnewline
35 & -0.000809 & -0.0089 & 0.496471 \tabularnewline
36 & -0.059353 & -0.6502 & 0.25841 \tabularnewline
37 & 0.139784 & 1.5313 & 0.064169 \tabularnewline
38 & -0.136665 & -1.4971 & 0.068498 \tabularnewline
39 & -0.043865 & -0.4805 & 0.315867 \tabularnewline
40 & 0.07859 & 0.8609 & 0.195504 \tabularnewline
41 & -0.00221 & -0.0242 & 0.490363 \tabularnewline
42 & -0.055035 & -0.6029 & 0.273862 \tabularnewline
43 & 0.060867 & 0.6668 & 0.253103 \tabularnewline
44 & -0.03613 & -0.3958 & 0.346484 \tabularnewline
45 & -0.047804 & -0.5237 & 0.300739 \tabularnewline
46 & 0.147876 & 1.6199 & 0.05394 \tabularnewline
47 & -0.039963 & -0.4378 & 0.33117 \tabularnewline
48 & -0.20103 & -2.2022 & 0.014782 \tabularnewline
\hline
\end{tabular}
%Source: https://freestatistics.org/blog/index.php?pk=302126&T=1

[TABLE]
[ROW][C]Autocorrelation Function[/C][/ROW]
[ROW][C]Time lag k[/C][C]ACF(k)[/C][C]T-STAT[/C][C]P-value[/C][/ROW]
[ROW][C]1[/C][C]-0.324755[/C][C]-3.5575[/C][C]0.000269[/C][/ROW]
[ROW][C]2[/C][C]-0.033174[/C][C]-0.3634[/C][C]0.35847[/C][/ROW]
[ROW][C]3[/C][C]0.221859[/C][C]2.4303[/C][C]0.008282[/C][/ROW]
[ROW][C]4[/C][C]-0.058108[/C][C]-0.6365[/C][C]0.262818[/C][/ROW]
[ROW][C]5[/C][C]0.044434[/C][C]0.4868[/C][C]0.313661[/C][/ROW]
[ROW][C]6[/C][C]0.153842[/C][C]1.6853[/C][C]0.047269[/C][/ROW]
[ROW][C]7[/C][C]-0.09185[/C][C]-1.0062[/C][C]0.158179[/C][/ROW]
[ROW][C]8[/C][C]0.032065[/C][C]0.3513[/C][C]0.363006[/C][/ROW]
[ROW][C]9[/C][C]0.14958[/C][C]1.6386[/C][C]0.051961[/C][/ROW]
[ROW][C]10[/C][C]0.018504[/C][C]0.2027[/C][C]0.419855[/C][/ROW]
[ROW][C]11[/C][C]0.013261[/C][C]0.1453[/C][C]0.44237[/C][/ROW]
[ROW][C]12[/C][C]-0.171769[/C][C]-1.8816[/C][C]0.031154[/C][/ROW]
[ROW][C]13[/C][C]0.127025[/C][C]1.3915[/C][C]0.083326[/C][/ROW]
[ROW][C]14[/C][C]0.208716[/C][C]2.2864[/C][C]0.011993[/C][/ROW]
[ROW][C]15[/C][C]-0.115876[/C][C]-1.2694[/C][C]0.103386[/C][/ROW]
[ROW][C]16[/C][C]-0.08371[/C][C]-0.917[/C][C]0.180493[/C][/ROW]
[ROW][C]17[/C][C]0.126522[/C][C]1.386[/C][C]0.084161[/C][/ROW]
[ROW][C]18[/C][C]-0.058917[/C][C]-0.6454[/C][C]0.259949[/C][/ROW]
[ROW][C]19[/C][C]-0.058158[/C][C]-0.6371[/C][C]0.262642[/C][/ROW]
[ROW][C]20[/C][C]0.118583[/C][C]1.299[/C][C]0.098216[/C][/ROW]
[ROW][C]21[/C][C]-0.079943[/C][C]-0.8757[/C][C]0.191462[/C][/ROW]
[ROW][C]22[/C][C]-0.190308[/C][C]-2.0847[/C][C]0.019608[/C][/ROW]
[ROW][C]23[/C][C]0.324902[/C][C]3.5591[/C][C]0.000267[/C][/ROW]
[ROW][C]24[/C][C]-0.190684[/C][C]-2.0888[/C][C]0.019418[/C][/ROW]
[ROW][C]25[/C][C]-0.173436[/C][C]-1.8999[/C][C]0.029923[/C][/ROW]
[ROW][C]26[/C][C]0.195071[/C][C]2.1369[/C][C]0.017318[/C][/ROW]
[ROW][C]27[/C][C]-0.048871[/C][C]-0.5354[/C][C]0.296698[/C][/ROW]
[ROW][C]28[/C][C]-0.028926[/C][C]-0.3169[/C][C]0.375945[/C][/ROW]
[ROW][C]29[/C][C]0.046549[/C][C]0.5099[/C][C]0.305524[/C][/ROW]
[ROW][C]30[/C][C]-0.077947[/C][C]-0.8539[/C][C]0.19744[/C][/ROW]
[ROW][C]31[/C][C]-0.024346[/C][C]-0.2667[/C][C]0.39508[/C][/ROW]
[ROW][C]32[/C][C]0.050748[/C][C]0.5559[/C][C]0.289653[/C][/ROW]
[ROW][C]33[/C][C]-0.069234[/C][C]-0.7584[/C][C]0.224842[/C][/ROW]
[ROW][C]34[/C][C]-0.052693[/C][C]-0.5772[/C][C]0.282435[/C][/ROW]
[ROW][C]35[/C][C]-0.000809[/C][C]-0.0089[/C][C]0.496471[/C][/ROW]
[ROW][C]36[/C][C]-0.059353[/C][C]-0.6502[/C][C]0.25841[/C][/ROW]
[ROW][C]37[/C][C]0.139784[/C][C]1.5313[/C][C]0.064169[/C][/ROW]
[ROW][C]38[/C][C]-0.136665[/C][C]-1.4971[/C][C]0.068498[/C][/ROW]
[ROW][C]39[/C][C]-0.043865[/C][C]-0.4805[/C][C]0.315867[/C][/ROW]
[ROW][C]40[/C][C]0.07859[/C][C]0.8609[/C][C]0.195504[/C][/ROW]
[ROW][C]41[/C][C]-0.00221[/C][C]-0.0242[/C][C]0.490363[/C][/ROW]
[ROW][C]42[/C][C]-0.055035[/C][C]-0.6029[/C][C]0.273862[/C][/ROW]
[ROW][C]43[/C][C]0.060867[/C][C]0.6668[/C][C]0.253103[/C][/ROW]
[ROW][C]44[/C][C]-0.03613[/C][C]-0.3958[/C][C]0.346484[/C][/ROW]
[ROW][C]45[/C][C]-0.047804[/C][C]-0.5237[/C][C]0.300739[/C][/ROW]
[ROW][C]46[/C][C]0.147876[/C][C]1.6199[/C][C]0.05394[/C][/ROW]
[ROW][C]47[/C][C]-0.039963[/C][C]-0.4378[/C][C]0.33117[/C][/ROW]
[ROW][C]48[/C][C]-0.20103[/C][C]-2.2022[/C][C]0.014782[/C][/ROW]
[/TABLE]
Source: https://freestatistics.org/blog/index.php?pk=302126&T=1

Globally Unique Identifier (entire table): ba.freestatistics.org/blog/index.php?pk=302126&T=1

As an alternative you can also use a QR Code:  

The GUIDs for individual cells are displayed in the table below:

Autocorrelation Function
Time lag kACF(k)T-STATP-value
1-0.324755-3.55750.000269
2-0.033174-0.36340.35847
30.2218592.43030.008282
4-0.058108-0.63650.262818
50.0444340.48680.313661
60.1538421.68530.047269
7-0.09185-1.00620.158179
80.0320650.35130.363006
90.149581.63860.051961
100.0185040.20270.419855
110.0132610.14530.44237
12-0.171769-1.88160.031154
130.1270251.39150.083326
140.2087162.28640.011993
15-0.115876-1.26940.103386
16-0.08371-0.9170.180493
170.1265221.3860.084161
18-0.058917-0.64540.259949
19-0.058158-0.63710.262642
200.1185831.2990.098216
21-0.079943-0.87570.191462
22-0.190308-2.08470.019608
230.3249023.55910.000267
24-0.190684-2.08880.019418
25-0.173436-1.89990.029923
260.1950712.13690.017318
27-0.048871-0.53540.296698
28-0.028926-0.31690.375945
290.0465490.50990.305524
30-0.077947-0.85390.19744
31-0.024346-0.26670.39508
320.0507480.55590.289653
33-0.069234-0.75840.224842
34-0.052693-0.57720.282435
35-0.000809-0.00890.496471
36-0.059353-0.65020.25841
370.1397841.53130.064169
38-0.136665-1.49710.068498
39-0.043865-0.48050.315867
400.078590.86090.195504
41-0.00221-0.02420.490363
42-0.055035-0.60290.273862
430.0608670.66680.253103
44-0.03613-0.39580.346484
45-0.047804-0.52370.300739
460.1478761.61990.05394
47-0.039963-0.43780.33117
48-0.20103-2.20220.014782


Partial Autocorrelation Function
Time lag kPACF(k)T-STATP-value
1-0.324755-3.55750.000269
2-0.154986-1.69780.04607
30.1822161.99610.024095
40.0890270.97520.1657
50.091751.00510.158442
60.1801561.97350.025368
70.0203490.22290.411993
8-0.009608-0.10530.458176
90.1029311.12760.13088
100.1360691.49060.06935
110.0726050.79530.213992
12-0.266037-2.91430.002127
13-0.080664-0.88360.189333
140.2535262.77720.003182
150.1284461.40710.080998
16-0.181801-1.99150.024347
17-0.078404-0.85890.196062
180.0290980.31880.375235
19-0.133628-1.46380.072928
20-0.047062-0.51550.303562
210.1253451.37310.086142
22-0.19051-2.08690.019506
230.0284730.31190.377828
24-0.103055-1.12890.130594
25-0.106645-1.16820.122514
260.1591071.74290.041954
270.104661.14650.126936
28-0.039704-0.43490.332194
29-0.031657-0.34680.364679
300.0473530.51870.302454
31-0.030166-0.33040.370819
320.0034860.03820.484801
330.0288260.31580.376362
34-0.190575-2.08760.019473
35-0.008962-0.09820.460978
36-0.053766-0.5890.278492
370.03690.40420.343387
380.0916351.00380.158743
390.088990.97480.1658
40-0.136233-1.49240.069115
41-0.033728-0.36950.356212
420.1224551.34140.091158
430.0320340.35090.363134
44-0.006092-0.06670.473454
450.0562610.61630.269431
46-0.061462-0.67330.251032
470.0626670.68650.246867
48-0.135872-1.48840.069633

\begin{tabular}{lllllllll}
\hline
Partial Autocorrelation Function \tabularnewline
Time lag k & PACF(k) & T-STAT & P-value \tabularnewline
1 & -0.324755 & -3.5575 & 0.000269 \tabularnewline
2 & -0.154986 & -1.6978 & 0.04607 \tabularnewline
3 & 0.182216 & 1.9961 & 0.024095 \tabularnewline
4 & 0.089027 & 0.9752 & 0.1657 \tabularnewline
5 & 0.09175 & 1.0051 & 0.158442 \tabularnewline
6 & 0.180156 & 1.9735 & 0.025368 \tabularnewline
7 & 0.020349 & 0.2229 & 0.411993 \tabularnewline
8 & -0.009608 & -0.1053 & 0.458176 \tabularnewline
9 & 0.102931 & 1.1276 & 0.13088 \tabularnewline
10 & 0.136069 & 1.4906 & 0.06935 \tabularnewline
11 & 0.072605 & 0.7953 & 0.213992 \tabularnewline
12 & -0.266037 & -2.9143 & 0.002127 \tabularnewline
13 & -0.080664 & -0.8836 & 0.189333 \tabularnewline
14 & 0.253526 & 2.7772 & 0.003182 \tabularnewline
15 & 0.128446 & 1.4071 & 0.080998 \tabularnewline
16 & -0.181801 & -1.9915 & 0.024347 \tabularnewline
17 & -0.078404 & -0.8589 & 0.196062 \tabularnewline
18 & 0.029098 & 0.3188 & 0.375235 \tabularnewline
19 & -0.133628 & -1.4638 & 0.072928 \tabularnewline
20 & -0.047062 & -0.5155 & 0.303562 \tabularnewline
21 & 0.125345 & 1.3731 & 0.086142 \tabularnewline
22 & -0.19051 & -2.0869 & 0.019506 \tabularnewline
23 & 0.028473 & 0.3119 & 0.377828 \tabularnewline
24 & -0.103055 & -1.1289 & 0.130594 \tabularnewline
25 & -0.106645 & -1.1682 & 0.122514 \tabularnewline
26 & 0.159107 & 1.7429 & 0.041954 \tabularnewline
27 & 0.10466 & 1.1465 & 0.126936 \tabularnewline
28 & -0.039704 & -0.4349 & 0.332194 \tabularnewline
29 & -0.031657 & -0.3468 & 0.364679 \tabularnewline
30 & 0.047353 & 0.5187 & 0.302454 \tabularnewline
31 & -0.030166 & -0.3304 & 0.370819 \tabularnewline
32 & 0.003486 & 0.0382 & 0.484801 \tabularnewline
33 & 0.028826 & 0.3158 & 0.376362 \tabularnewline
34 & -0.190575 & -2.0876 & 0.019473 \tabularnewline
35 & -0.008962 & -0.0982 & 0.460978 \tabularnewline
36 & -0.053766 & -0.589 & 0.278492 \tabularnewline
37 & 0.0369 & 0.4042 & 0.343387 \tabularnewline
38 & 0.091635 & 1.0038 & 0.158743 \tabularnewline
39 & 0.08899 & 0.9748 & 0.1658 \tabularnewline
40 & -0.136233 & -1.4924 & 0.069115 \tabularnewline
41 & -0.033728 & -0.3695 & 0.356212 \tabularnewline
42 & 0.122455 & 1.3414 & 0.091158 \tabularnewline
43 & 0.032034 & 0.3509 & 0.363134 \tabularnewline
44 & -0.006092 & -0.0667 & 0.473454 \tabularnewline
45 & 0.056261 & 0.6163 & 0.269431 \tabularnewline
46 & -0.061462 & -0.6733 & 0.251032 \tabularnewline
47 & 0.062667 & 0.6865 & 0.246867 \tabularnewline
48 & -0.135872 & -1.4884 & 0.069633 \tabularnewline
\hline
\end{tabular}
%Source: https://freestatistics.org/blog/index.php?pk=302126&T=2

[TABLE]
[ROW][C]Partial Autocorrelation Function[/C][/ROW]
[ROW][C]Time lag k[/C][C]PACF(k)[/C][C]T-STAT[/C][C]P-value[/C][/ROW]
[ROW][C]1[/C][C]-0.324755[/C][C]-3.5575[/C][C]0.000269[/C][/ROW]
[ROW][C]2[/C][C]-0.154986[/C][C]-1.6978[/C][C]0.04607[/C][/ROW]
[ROW][C]3[/C][C]0.182216[/C][C]1.9961[/C][C]0.024095[/C][/ROW]
[ROW][C]4[/C][C]0.089027[/C][C]0.9752[/C][C]0.1657[/C][/ROW]
[ROW][C]5[/C][C]0.09175[/C][C]1.0051[/C][C]0.158442[/C][/ROW]
[ROW][C]6[/C][C]0.180156[/C][C]1.9735[/C][C]0.025368[/C][/ROW]
[ROW][C]7[/C][C]0.020349[/C][C]0.2229[/C][C]0.411993[/C][/ROW]
[ROW][C]8[/C][C]-0.009608[/C][C]-0.1053[/C][C]0.458176[/C][/ROW]
[ROW][C]9[/C][C]0.102931[/C][C]1.1276[/C][C]0.13088[/C][/ROW]
[ROW][C]10[/C][C]0.136069[/C][C]1.4906[/C][C]0.06935[/C][/ROW]
[ROW][C]11[/C][C]0.072605[/C][C]0.7953[/C][C]0.213992[/C][/ROW]
[ROW][C]12[/C][C]-0.266037[/C][C]-2.9143[/C][C]0.002127[/C][/ROW]
[ROW][C]13[/C][C]-0.080664[/C][C]-0.8836[/C][C]0.189333[/C][/ROW]
[ROW][C]14[/C][C]0.253526[/C][C]2.7772[/C][C]0.003182[/C][/ROW]
[ROW][C]15[/C][C]0.128446[/C][C]1.4071[/C][C]0.080998[/C][/ROW]
[ROW][C]16[/C][C]-0.181801[/C][C]-1.9915[/C][C]0.024347[/C][/ROW]
[ROW][C]17[/C][C]-0.078404[/C][C]-0.8589[/C][C]0.196062[/C][/ROW]
[ROW][C]18[/C][C]0.029098[/C][C]0.3188[/C][C]0.375235[/C][/ROW]
[ROW][C]19[/C][C]-0.133628[/C][C]-1.4638[/C][C]0.072928[/C][/ROW]
[ROW][C]20[/C][C]-0.047062[/C][C]-0.5155[/C][C]0.303562[/C][/ROW]
[ROW][C]21[/C][C]0.125345[/C][C]1.3731[/C][C]0.086142[/C][/ROW]
[ROW][C]22[/C][C]-0.19051[/C][C]-2.0869[/C][C]0.019506[/C][/ROW]
[ROW][C]23[/C][C]0.028473[/C][C]0.3119[/C][C]0.377828[/C][/ROW]
[ROW][C]24[/C][C]-0.103055[/C][C]-1.1289[/C][C]0.130594[/C][/ROW]
[ROW][C]25[/C][C]-0.106645[/C][C]-1.1682[/C][C]0.122514[/C][/ROW]
[ROW][C]26[/C][C]0.159107[/C][C]1.7429[/C][C]0.041954[/C][/ROW]
[ROW][C]27[/C][C]0.10466[/C][C]1.1465[/C][C]0.126936[/C][/ROW]
[ROW][C]28[/C][C]-0.039704[/C][C]-0.4349[/C][C]0.332194[/C][/ROW]
[ROW][C]29[/C][C]-0.031657[/C][C]-0.3468[/C][C]0.364679[/C][/ROW]
[ROW][C]30[/C][C]0.047353[/C][C]0.5187[/C][C]0.302454[/C][/ROW]
[ROW][C]31[/C][C]-0.030166[/C][C]-0.3304[/C][C]0.370819[/C][/ROW]
[ROW][C]32[/C][C]0.003486[/C][C]0.0382[/C][C]0.484801[/C][/ROW]
[ROW][C]33[/C][C]0.028826[/C][C]0.3158[/C][C]0.376362[/C][/ROW]
[ROW][C]34[/C][C]-0.190575[/C][C]-2.0876[/C][C]0.019473[/C][/ROW]
[ROW][C]35[/C][C]-0.008962[/C][C]-0.0982[/C][C]0.460978[/C][/ROW]
[ROW][C]36[/C][C]-0.053766[/C][C]-0.589[/C][C]0.278492[/C][/ROW]
[ROW][C]37[/C][C]0.0369[/C][C]0.4042[/C][C]0.343387[/C][/ROW]
[ROW][C]38[/C][C]0.091635[/C][C]1.0038[/C][C]0.158743[/C][/ROW]
[ROW][C]39[/C][C]0.08899[/C][C]0.9748[/C][C]0.1658[/C][/ROW]
[ROW][C]40[/C][C]-0.136233[/C][C]-1.4924[/C][C]0.069115[/C][/ROW]
[ROW][C]41[/C][C]-0.033728[/C][C]-0.3695[/C][C]0.356212[/C][/ROW]
[ROW][C]42[/C][C]0.122455[/C][C]1.3414[/C][C]0.091158[/C][/ROW]
[ROW][C]43[/C][C]0.032034[/C][C]0.3509[/C][C]0.363134[/C][/ROW]
[ROW][C]44[/C][C]-0.006092[/C][C]-0.0667[/C][C]0.473454[/C][/ROW]
[ROW][C]45[/C][C]0.056261[/C][C]0.6163[/C][C]0.269431[/C][/ROW]
[ROW][C]46[/C][C]-0.061462[/C][C]-0.6733[/C][C]0.251032[/C][/ROW]
[ROW][C]47[/C][C]0.062667[/C][C]0.6865[/C][C]0.246867[/C][/ROW]
[ROW][C]48[/C][C]-0.135872[/C][C]-1.4884[/C][C]0.069633[/C][/ROW]
[/TABLE]
Source: https://freestatistics.org/blog/index.php?pk=302126&T=2

Globally Unique Identifier (entire table): ba.freestatistics.org/blog/index.php?pk=302126&T=2

As an alternative you can also use a QR Code:  

The GUIDs for individual cells are displayed in the table below:

Partial Autocorrelation Function
Time lag kPACF(k)T-STATP-value
1-0.324755-3.55750.000269
2-0.154986-1.69780.04607
30.1822161.99610.024095
40.0890270.97520.1657
50.091751.00510.158442
60.1801561.97350.025368
70.0203490.22290.411993
8-0.009608-0.10530.458176
90.1029311.12760.13088
100.1360691.49060.06935
110.0726050.79530.213992
12-0.266037-2.91430.002127
13-0.080664-0.88360.189333
140.2535262.77720.003182
150.1284461.40710.080998
16-0.181801-1.99150.024347
17-0.078404-0.85890.196062
180.0290980.31880.375235
19-0.133628-1.46380.072928
20-0.047062-0.51550.303562
210.1253451.37310.086142
22-0.19051-2.08690.019506
230.0284730.31190.377828
24-0.103055-1.12890.130594
25-0.106645-1.16820.122514
260.1591071.74290.041954
270.104661.14650.126936
28-0.039704-0.43490.332194
29-0.031657-0.34680.364679
300.0473530.51870.302454
31-0.030166-0.33040.370819
320.0034860.03820.484801
330.0288260.31580.376362
34-0.190575-2.08760.019473
35-0.008962-0.09820.460978
36-0.053766-0.5890.278492
370.03690.40420.343387
380.0916351.00380.158743
390.088990.97480.1658
40-0.136233-1.49240.069115
41-0.033728-0.36950.356212
420.1224551.34140.091158
430.0320340.35090.363134
44-0.006092-0.06670.473454
450.0562610.61630.269431
46-0.061462-0.67330.251032
470.0626670.68650.246867
48-0.135872-1.48840.069633


Parameters (Session):
par1 = 48 ; par2 = 1 ; par3 = 0 ; par4 = 1 ; par5 = 12 ; par6 = White Noise ; par7 = 0.95 ;
Parameters (R input):
par1 = 48 ; par2 = 1 ; par3 = 0 ; par4 = 1 ; par5 = 12 ; par6 = White Noise ; par7 = 0.95 ; par8 = ;
R code (references can be found in the software module):
par8 <- ''
par7 <- '0.95'
par6 <- 'White Noise'
par5 <- '12'
par4 <- '0'
par3 <- '0'
par2 <- '1'
par1 <- '48'
if (par1 == 'Default') {
par1 = 10*log10(length(x))
} else {
par1 <- as.numeric(par1)
}
par2 <- as.numeric(par2)
par3 <- as.numeric(par3)
par4 <- as.numeric(par4)
par5 <- as.numeric(par5)
if (par6 == 'White Noise') par6 <- 'white' else par6 <- 'ma'
par7 <- as.numeric(par7)
if (par8 != '') par8 <- as.numeric(par8)
x <- na.omit(x)
ox <- x
if (par8 == '') {
if (par2 == 0) {
x <- log(x)
} else {
x <- (x ^ par2 - 1) / par2
}
} else {
x <- log(x,base=par8)
}
if (par3 > 0) x <- diff(x,lag=1,difference=par3)
if (par4 > 0) x <- diff(x,lag=par5,difference=par4)
bitmap(file='picts.png')
op <- par(mfrow=c(2,1))
plot(ox,type='l',main='Original Time Series',xlab='time',ylab='value')
if (par8=='') {
mytitle <- paste('Working Time Series (lambda=',par2,', d=',par3,', D=',par4,')',sep='')
mysub <- paste('(lambda=',par2,', d=',par3,', D=',par4,', CI=', par7, ', CI type=',par6,')',sep='')
} else {
mytitle <- paste('Working Time Series (base=',par8,', d=',par3,', D=',par4,')',sep='')
mysub <- paste('(base=',par8,', d=',par3,', D=',par4,', CI=', par7, ', CI type=',par6,')',sep='')
}
plot(x,type='l', main=mytitle,xlab='time',ylab='value')
par(op)
dev.off()
bitmap(file='pic1.png')
racf <- acf(x, par1, main='Autocorrelation', xlab='time lag', ylab='ACF', ci.type=par6, ci=par7, sub=mysub)
dev.off()
bitmap(file='pic2.png')
rpacf <- pacf(x,par1,main='Partial Autocorrelation',xlab='lags',ylab='PACF',sub=mysub)
dev.off()
(myacf <- c(racf$acf))
(mypacf <- c(rpacf$acf))
lengthx <- length(x)
sqrtn <- sqrt(lengthx)
load(file='createtable')
a<-table.start()
a<-table.row.start(a)
a<-table.element(a,'Autocorrelation Function',4,TRUE)
a<-table.row.end(a)
a<-table.row.start(a)
a<-table.element(a,'Time lag k',header=TRUE)
a<-table.element(a,'ACF(k)',header=TRUE)
a<-table.element(a,'T-STAT',header=TRUE)
a<-table.element(a,'P-value',header=TRUE)
a<-table.row.end(a)
for (i in 2:(par1+1)) {
a<-table.row.start(a)
a<-table.element(a,i-1,header=TRUE)
a<-table.element(a,round(myacf[i],6))
mytstat <- myacf[i]*sqrtn
a<-table.element(a,round(mytstat,4))
a<-table.element(a,round(1-pt(abs(mytstat),lengthx),6))
a<-table.row.end(a)
}
a<-table.end(a)
table.save(a,file='mytable.tab')
a<-table.start()
a<-table.row.start(a)
a<-table.element(a,'Partial Autocorrelation Function',4,TRUE)
a<-table.row.end(a)
a<-table.row.start(a)
a<-table.element(a,'Time lag k',header=TRUE)
a<-table.element(a,'PACF(k)',header=TRUE)
a<-table.element(a,'T-STAT',header=TRUE)
a<-table.element(a,'P-value',header=TRUE)
a<-table.row.end(a)
for (i in 1:par1) {
a<-table.row.start(a)
a<-table.element(a,i,header=TRUE)
a<-table.element(a,round(mypacf[i],6))
mytstat <- mypacf[i]*sqrtn
a<-table.element(a,round(mytstat,4))
a<-table.element(a,round(1-pt(abs(mytstat),lengthx),6))
a<-table.row.end(a)
}
a<-table.end(a)
table.save(a,file='mytable1.tab')