Free Statistics

of Irreproducible Research!

Author's title

Author*The author of this computation has been verified*
R Software Modulerwasp_exponentialsmoothing.wasp
Title produced by softwareExponential Smoothing
Date of computationWed, 21 Dec 2016 13:15:33 +0100
Cite this page as followsStatistical Computations at FreeStatistics.org, Office for Research Development and Education, URL https://freestatistics.org/blog/index.php?v=date/2016/Dec/21/t1482322561v2j4seze39qz88t.htm/, Retrieved Mon, 06 May 2024 18:15:39 +0000
Statistical Computations at FreeStatistics.org, Office for Research Development and Education, URL https://freestatistics.org/blog/index.php?pk=302203, Retrieved Mon, 06 May 2024 18:15:39 +0000
QR Codes:

Original text written by user:
IsPrivate?No (this computation is public)
User-defined keywords
Estimated Impact82
Family? (F = Feedback message, R = changed R code, M = changed R Module, P = changed Parameters, D = changed Data)
-       [Exponential Smoothing] [] [2016-12-21 12:15:33] [84a79156fb687334cf7dc390d7b82d5a] [Current]
Feedback Forum

Post a new message
Dataseries X:
5283.5
5298.3
5313
5332.2
5348.9
5411.6
5474.6
5463.6
5477.3
5530.4
5584.1
5605.5
5626.6
5659
5697.6
5705.9
5633.3
5671.2
5709.5
5723.8
5754.2
5775.7
5803.6
5846.5
5849.6
5866
5900
5949.6
5886.2
5896.7
5913.4
5963.1
5905.2
5912.2
5928.9
5990.6
5853.6
5976.1
6002.5
6091.9
5917.8
6010.3
6087.7
6192.9


Summary of computational transaction
Raw Input view raw input (R code)
Raw Outputview raw output of R engine
Computing time2 seconds
R ServerBig Analytics Cloud Computing Center

\begin{tabular}{lllllllll}
\hline
Summary of computational transaction \tabularnewline
Raw Input view raw input (R code)  \tabularnewline
Raw Outputview raw output of R engine  \tabularnewline
Computing time2 seconds \tabularnewline
R ServerBig Analytics Cloud Computing Center \tabularnewline
\hline
\end{tabular}
%Source: https://freestatistics.org/blog/index.php?pk=302203&T=0

[TABLE]
[ROW]
Summary of computational transaction[/C][/ROW] [ROW]Raw Input[/C] view raw input (R code) [/C][/ROW] [ROW]Raw Output[/C]view raw output of R engine [/C][/ROW] [ROW]Computing time[/C]2 seconds[/C][/ROW] [ROW]R Server[/C]Big Analytics Cloud Computing Center[/C][/ROW] [/TABLE] Source: https://freestatistics.org/blog/index.php?pk=302203&T=0

Globally Unique Identifier (entire table): ba.freestatistics.org/blog/index.php?pk=302203&T=0

As an alternative you can also use a QR Code:  

The GUIDs for individual cells are displayed in the table below:

Summary of computational transaction
Raw Input view raw input (R code)
Raw Outputview raw output of R engine
Computing time2 seconds
R ServerBig Analytics Cloud Computing Center


Estimated Parameters of Exponential Smoothing
ParameterValue
alpha0.590165006435149
beta0.0991010132646001
gamma1

\begin{tabular}{lllllllll}
\hline
Estimated Parameters of Exponential Smoothing \tabularnewline
Parameter & Value \tabularnewline
alpha & 0.590165006435149 \tabularnewline
beta & 0.0991010132646001 \tabularnewline
gamma & 1 \tabularnewline
\hline
\end{tabular}
%Source: https://freestatistics.org/blog/index.php?pk=302203&T=1

[TABLE]
[ROW][C]Estimated Parameters of Exponential Smoothing[/C][/ROW]
[ROW][C]Parameter[/C][C]Value[/C][/ROW]
[ROW][C]alpha[/C][C]0.590165006435149[/C][/ROW]
[ROW][C]beta[/C][C]0.0991010132646001[/C][/ROW]
[ROW][C]gamma[/C][C]1[/C][/ROW]
[/TABLE]
Source: https://freestatistics.org/blog/index.php?pk=302203&T=1

Globally Unique Identifier (entire table): ba.freestatistics.org/blog/index.php?pk=302203&T=1

As an alternative you can also use a QR Code:  

The GUIDs for individual cells are displayed in the table below:

Estimated Parameters of Exponential Smoothing
ParameterValue
alpha0.590165006435149
beta0.0991010132646001
gamma1


Interpolation Forecasts of Exponential Smoothing
tObservedFittedResiduals
55348.95294.73062554.1693749999995
65411.65387.3763919103424.2236080896582
75474.65432.4159558340642.1840441659388
85463.65492.65981453373-29.0598145337317
95477.35516.83395549635-39.5339554963475
105530.45541.77861539719-11.3786153971869
115584.15570.9577210288913.1422789711141
125605.55580.955297540324.5447024596961
135626.65631.69876795952-5.09876795951641
1456595689.74537765824-30.7453776582415
155697.65717.65219850462-20.0521985046153
165705.95710.89903760922-4.99903760921643
175633.35728.49637071288-95.1963707128789
185671.25714.02868182132-42.8286818213155
195709.55729.64912671272-20.149126712723
205723.85719.464733655694.33526634431018
215754.25696.6074078918157.5925921081871
225775.75793.71112233853-18.0111223385329
235803.65834.66296892196-31.0629689219604
245846.55828.8239339652417.6760660347627
255849.65837.1986112306412.4013887693636
2658665875.53597471189-9.53597471189278
2759005915.52509411741-15.5250941174072
285949.65939.1243193225110.4756806774913
295886.25940.96010051511-54.76010051511
305896.75926.61466722744-29.9146672274446
315913.45946.87484073418-33.4748407341758
325963.15964.23936901075-1.13936901075249
335905.25925.50771917556-20.3077191755638
345912.25936.71565480283-24.515654802829
355928.95954.05707026548-25.1570702654835
365990.65985.423153598595.17684640141124
375853.65938.77315241459-85.1731524145944
385976.15902.3914034608473.7085965391643
396002.55975.5993825270926.9006174729084
406091.96051.3255575305840.5744424694221
415917.85991.81321522218-74.0132152221786
426010.36031.0614983112-20.7614983112044
436087.76027.7363392642459.9636607357597
446192.96128.916254708163.9837452919046

\begin{tabular}{lllllllll}
\hline
Interpolation Forecasts of Exponential Smoothing \tabularnewline
t & Observed & Fitted & Residuals \tabularnewline
5 & 5348.9 & 5294.730625 & 54.1693749999995 \tabularnewline
6 & 5411.6 & 5387.37639191034 & 24.2236080896582 \tabularnewline
7 & 5474.6 & 5432.41595583406 & 42.1840441659388 \tabularnewline
8 & 5463.6 & 5492.65981453373 & -29.0598145337317 \tabularnewline
9 & 5477.3 & 5516.83395549635 & -39.5339554963475 \tabularnewline
10 & 5530.4 & 5541.77861539719 & -11.3786153971869 \tabularnewline
11 & 5584.1 & 5570.95772102889 & 13.1422789711141 \tabularnewline
12 & 5605.5 & 5580.9552975403 & 24.5447024596961 \tabularnewline
13 & 5626.6 & 5631.69876795952 & -5.09876795951641 \tabularnewline
14 & 5659 & 5689.74537765824 & -30.7453776582415 \tabularnewline
15 & 5697.6 & 5717.65219850462 & -20.0521985046153 \tabularnewline
16 & 5705.9 & 5710.89903760922 & -4.99903760921643 \tabularnewline
17 & 5633.3 & 5728.49637071288 & -95.1963707128789 \tabularnewline
18 & 5671.2 & 5714.02868182132 & -42.8286818213155 \tabularnewline
19 & 5709.5 & 5729.64912671272 & -20.149126712723 \tabularnewline
20 & 5723.8 & 5719.46473365569 & 4.33526634431018 \tabularnewline
21 & 5754.2 & 5696.60740789181 & 57.5925921081871 \tabularnewline
22 & 5775.7 & 5793.71112233853 & -18.0111223385329 \tabularnewline
23 & 5803.6 & 5834.66296892196 & -31.0629689219604 \tabularnewline
24 & 5846.5 & 5828.82393396524 & 17.6760660347627 \tabularnewline
25 & 5849.6 & 5837.19861123064 & 12.4013887693636 \tabularnewline
26 & 5866 & 5875.53597471189 & -9.53597471189278 \tabularnewline
27 & 5900 & 5915.52509411741 & -15.5250941174072 \tabularnewline
28 & 5949.6 & 5939.12431932251 & 10.4756806774913 \tabularnewline
29 & 5886.2 & 5940.96010051511 & -54.76010051511 \tabularnewline
30 & 5896.7 & 5926.61466722744 & -29.9146672274446 \tabularnewline
31 & 5913.4 & 5946.87484073418 & -33.4748407341758 \tabularnewline
32 & 5963.1 & 5964.23936901075 & -1.13936901075249 \tabularnewline
33 & 5905.2 & 5925.50771917556 & -20.3077191755638 \tabularnewline
34 & 5912.2 & 5936.71565480283 & -24.515654802829 \tabularnewline
35 & 5928.9 & 5954.05707026548 & -25.1570702654835 \tabularnewline
36 & 5990.6 & 5985.42315359859 & 5.17684640141124 \tabularnewline
37 & 5853.6 & 5938.77315241459 & -85.1731524145944 \tabularnewline
38 & 5976.1 & 5902.39140346084 & 73.7085965391643 \tabularnewline
39 & 6002.5 & 5975.59938252709 & 26.9006174729084 \tabularnewline
40 & 6091.9 & 6051.32555753058 & 40.5744424694221 \tabularnewline
41 & 5917.8 & 5991.81321522218 & -74.0132152221786 \tabularnewline
42 & 6010.3 & 6031.0614983112 & -20.7614983112044 \tabularnewline
43 & 6087.7 & 6027.73633926424 & 59.9636607357597 \tabularnewline
44 & 6192.9 & 6128.9162547081 & 63.9837452919046 \tabularnewline
\hline
\end{tabular}
%Source: https://freestatistics.org/blog/index.php?pk=302203&T=2

[TABLE]
[ROW][C]Interpolation Forecasts of Exponential Smoothing[/C][/ROW]
[ROW][C]t[/C][C]Observed[/C][C]Fitted[/C][C]Residuals[/C][/ROW]
[ROW][C]5[/C][C]5348.9[/C][C]5294.730625[/C][C]54.1693749999995[/C][/ROW]
[ROW][C]6[/C][C]5411.6[/C][C]5387.37639191034[/C][C]24.2236080896582[/C][/ROW]
[ROW][C]7[/C][C]5474.6[/C][C]5432.41595583406[/C][C]42.1840441659388[/C][/ROW]
[ROW][C]8[/C][C]5463.6[/C][C]5492.65981453373[/C][C]-29.0598145337317[/C][/ROW]
[ROW][C]9[/C][C]5477.3[/C][C]5516.83395549635[/C][C]-39.5339554963475[/C][/ROW]
[ROW][C]10[/C][C]5530.4[/C][C]5541.77861539719[/C][C]-11.3786153971869[/C][/ROW]
[ROW][C]11[/C][C]5584.1[/C][C]5570.95772102889[/C][C]13.1422789711141[/C][/ROW]
[ROW][C]12[/C][C]5605.5[/C][C]5580.9552975403[/C][C]24.5447024596961[/C][/ROW]
[ROW][C]13[/C][C]5626.6[/C][C]5631.69876795952[/C][C]-5.09876795951641[/C][/ROW]
[ROW][C]14[/C][C]5659[/C][C]5689.74537765824[/C][C]-30.7453776582415[/C][/ROW]
[ROW][C]15[/C][C]5697.6[/C][C]5717.65219850462[/C][C]-20.0521985046153[/C][/ROW]
[ROW][C]16[/C][C]5705.9[/C][C]5710.89903760922[/C][C]-4.99903760921643[/C][/ROW]
[ROW][C]17[/C][C]5633.3[/C][C]5728.49637071288[/C][C]-95.1963707128789[/C][/ROW]
[ROW][C]18[/C][C]5671.2[/C][C]5714.02868182132[/C][C]-42.8286818213155[/C][/ROW]
[ROW][C]19[/C][C]5709.5[/C][C]5729.64912671272[/C][C]-20.149126712723[/C][/ROW]
[ROW][C]20[/C][C]5723.8[/C][C]5719.46473365569[/C][C]4.33526634431018[/C][/ROW]
[ROW][C]21[/C][C]5754.2[/C][C]5696.60740789181[/C][C]57.5925921081871[/C][/ROW]
[ROW][C]22[/C][C]5775.7[/C][C]5793.71112233853[/C][C]-18.0111223385329[/C][/ROW]
[ROW][C]23[/C][C]5803.6[/C][C]5834.66296892196[/C][C]-31.0629689219604[/C][/ROW]
[ROW][C]24[/C][C]5846.5[/C][C]5828.82393396524[/C][C]17.6760660347627[/C][/ROW]
[ROW][C]25[/C][C]5849.6[/C][C]5837.19861123064[/C][C]12.4013887693636[/C][/ROW]
[ROW][C]26[/C][C]5866[/C][C]5875.53597471189[/C][C]-9.53597471189278[/C][/ROW]
[ROW][C]27[/C][C]5900[/C][C]5915.52509411741[/C][C]-15.5250941174072[/C][/ROW]
[ROW][C]28[/C][C]5949.6[/C][C]5939.12431932251[/C][C]10.4756806774913[/C][/ROW]
[ROW][C]29[/C][C]5886.2[/C][C]5940.96010051511[/C][C]-54.76010051511[/C][/ROW]
[ROW][C]30[/C][C]5896.7[/C][C]5926.61466722744[/C][C]-29.9146672274446[/C][/ROW]
[ROW][C]31[/C][C]5913.4[/C][C]5946.87484073418[/C][C]-33.4748407341758[/C][/ROW]
[ROW][C]32[/C][C]5963.1[/C][C]5964.23936901075[/C][C]-1.13936901075249[/C][/ROW]
[ROW][C]33[/C][C]5905.2[/C][C]5925.50771917556[/C][C]-20.3077191755638[/C][/ROW]
[ROW][C]34[/C][C]5912.2[/C][C]5936.71565480283[/C][C]-24.515654802829[/C][/ROW]
[ROW][C]35[/C][C]5928.9[/C][C]5954.05707026548[/C][C]-25.1570702654835[/C][/ROW]
[ROW][C]36[/C][C]5990.6[/C][C]5985.42315359859[/C][C]5.17684640141124[/C][/ROW]
[ROW][C]37[/C][C]5853.6[/C][C]5938.77315241459[/C][C]-85.1731524145944[/C][/ROW]
[ROW][C]38[/C][C]5976.1[/C][C]5902.39140346084[/C][C]73.7085965391643[/C][/ROW]
[ROW][C]39[/C][C]6002.5[/C][C]5975.59938252709[/C][C]26.9006174729084[/C][/ROW]
[ROW][C]40[/C][C]6091.9[/C][C]6051.32555753058[/C][C]40.5744424694221[/C][/ROW]
[ROW][C]41[/C][C]5917.8[/C][C]5991.81321522218[/C][C]-74.0132152221786[/C][/ROW]
[ROW][C]42[/C][C]6010.3[/C][C]6031.0614983112[/C][C]-20.7614983112044[/C][/ROW]
[ROW][C]43[/C][C]6087.7[/C][C]6027.73633926424[/C][C]59.9636607357597[/C][/ROW]
[ROW][C]44[/C][C]6192.9[/C][C]6128.9162547081[/C][C]63.9837452919046[/C][/ROW]
[/TABLE]
Source: https://freestatistics.org/blog/index.php?pk=302203&T=2

Globally Unique Identifier (entire table): ba.freestatistics.org/blog/index.php?pk=302203&T=2

As an alternative you can also use a QR Code:  

The GUIDs for individual cells are displayed in the table below:

Interpolation Forecasts of Exponential Smoothing
tObservedFittedResiduals
55348.95294.73062554.1693749999995
65411.65387.3763919103424.2236080896582
75474.65432.4159558340642.1840441659388
85463.65492.65981453373-29.0598145337317
95477.35516.83395549635-39.5339554963475
105530.45541.77861539719-11.3786153971869
115584.15570.9577210288913.1422789711141
125605.55580.955297540324.5447024596961
135626.65631.69876795952-5.09876795951641
1456595689.74537765824-30.7453776582415
155697.65717.65219850462-20.0521985046153
165705.95710.89903760922-4.99903760921643
175633.35728.49637071288-95.1963707128789
185671.25714.02868182132-42.8286818213155
195709.55729.64912671272-20.149126712723
205723.85719.464733655694.33526634431018
215754.25696.6074078918157.5925921081871
225775.75793.71112233853-18.0111223385329
235803.65834.66296892196-31.0629689219604
245846.55828.8239339652417.6760660347627
255849.65837.1986112306412.4013887693636
2658665875.53597471189-9.53597471189278
2759005915.52509411741-15.5250941174072
285949.65939.1243193225110.4756806774913
295886.25940.96010051511-54.76010051511
305896.75926.61466722744-29.9146672274446
315913.45946.87484073418-33.4748407341758
325963.15964.23936901075-1.13936901075249
335905.25925.50771917556-20.3077191755638
345912.25936.71565480283-24.515654802829
355928.95954.05707026548-25.1570702654835
365990.65985.423153598595.17684640141124
375853.65938.77315241459-85.1731524145944
385976.15902.3914034608473.7085965391643
396002.55975.5993825270926.9006174729084
406091.96051.3255575305840.5744424694221
415917.85991.81321522218-74.0132152221786
426010.36031.0614983112-20.7614983112044
436087.76027.7363392642459.9636607357597
446192.96128.916254708163.9837452919046


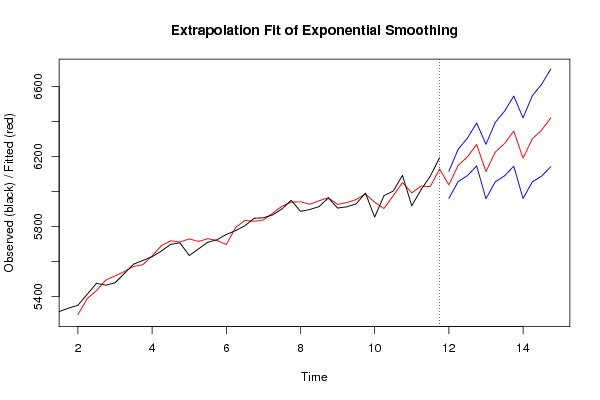
Extrapolation Forecasts of Exponential Smoothing
tForecast95% Lower Bound95% Upper Bound
456037.963424436335960.402085142676115.52476372999
466148.751060073696056.301715605966241.20040454143
476198.01178765756090.517516789636305.50605852538
486269.19297034196146.386914355836391.99902632797
496114.256394778235958.561084274676269.95170528179
506225.04403041566054.964200862916395.12385996829
516274.304757999416089.223952461816459.385563537
526345.48594068386144.823404845046546.14847652257
536190.549365120135959.838337559566421.2603926807
546301.33700075756054.908152275316547.76584923969
556350.597728341316087.856345318286613.33911136433
566421.77891102576142.160770864966701.39705118645

\begin{tabular}{lllllllll}
\hline
Extrapolation Forecasts of Exponential Smoothing \tabularnewline
t & Forecast & 95% Lower Bound & 95% Upper Bound \tabularnewline
45 & 6037.96342443633 & 5960.40208514267 & 6115.52476372999 \tabularnewline
46 & 6148.75106007369 & 6056.30171560596 & 6241.20040454143 \tabularnewline
47 & 6198.0117876575 & 6090.51751678963 & 6305.50605852538 \tabularnewline
48 & 6269.1929703419 & 6146.38691435583 & 6391.99902632797 \tabularnewline
49 & 6114.25639477823 & 5958.56108427467 & 6269.95170528179 \tabularnewline
50 & 6225.0440304156 & 6054.96420086291 & 6395.12385996829 \tabularnewline
51 & 6274.30475799941 & 6089.22395246181 & 6459.385563537 \tabularnewline
52 & 6345.4859406838 & 6144.82340484504 & 6546.14847652257 \tabularnewline
53 & 6190.54936512013 & 5959.83833755956 & 6421.2603926807 \tabularnewline
54 & 6301.3370007575 & 6054.90815227531 & 6547.76584923969 \tabularnewline
55 & 6350.59772834131 & 6087.85634531828 & 6613.33911136433 \tabularnewline
56 & 6421.7789110257 & 6142.16077086496 & 6701.39705118645 \tabularnewline
\hline
\end{tabular}
%Source: https://freestatistics.org/blog/index.php?pk=302203&T=3

[TABLE]
[ROW][C]Extrapolation Forecasts of Exponential Smoothing[/C][/ROW]
[ROW][C]t[/C][C]Forecast[/C][C]95% Lower Bound[/C][C]95% Upper Bound[/C][/ROW]
[ROW][C]45[/C][C]6037.96342443633[/C][C]5960.40208514267[/C][C]6115.52476372999[/C][/ROW]
[ROW][C]46[/C][C]6148.75106007369[/C][C]6056.30171560596[/C][C]6241.20040454143[/C][/ROW]
[ROW][C]47[/C][C]6198.0117876575[/C][C]6090.51751678963[/C][C]6305.50605852538[/C][/ROW]
[ROW][C]48[/C][C]6269.1929703419[/C][C]6146.38691435583[/C][C]6391.99902632797[/C][/ROW]
[ROW][C]49[/C][C]6114.25639477823[/C][C]5958.56108427467[/C][C]6269.95170528179[/C][/ROW]
[ROW][C]50[/C][C]6225.0440304156[/C][C]6054.96420086291[/C][C]6395.12385996829[/C][/ROW]
[ROW][C]51[/C][C]6274.30475799941[/C][C]6089.22395246181[/C][C]6459.385563537[/C][/ROW]
[ROW][C]52[/C][C]6345.4859406838[/C][C]6144.82340484504[/C][C]6546.14847652257[/C][/ROW]
[ROW][C]53[/C][C]6190.54936512013[/C][C]5959.83833755956[/C][C]6421.2603926807[/C][/ROW]
[ROW][C]54[/C][C]6301.3370007575[/C][C]6054.90815227531[/C][C]6547.76584923969[/C][/ROW]
[ROW][C]55[/C][C]6350.59772834131[/C][C]6087.85634531828[/C][C]6613.33911136433[/C][/ROW]
[ROW][C]56[/C][C]6421.7789110257[/C][C]6142.16077086496[/C][C]6701.39705118645[/C][/ROW]
[/TABLE]
Source: https://freestatistics.org/blog/index.php?pk=302203&T=3

Globally Unique Identifier (entire table): ba.freestatistics.org/blog/index.php?pk=302203&T=3

As an alternative you can also use a QR Code:  

The GUIDs for individual cells are displayed in the table below:

Extrapolation Forecasts of Exponential Smoothing
tForecast95% Lower Bound95% Upper Bound
456037.963424436335960.402085142676115.52476372999
466148.751060073696056.301715605966241.20040454143
476198.01178765756090.517516789636305.50605852538
486269.19297034196146.386914355836391.99902632797
496114.256394778235958.561084274676269.95170528179
506225.04403041566054.964200862916395.12385996829
516274.304757999416089.223952461816459.385563537
526345.48594068386144.823404845046546.14847652257
536190.549365120135959.838337559566421.2603926807
546301.33700075756054.908152275316547.76584923969
556350.597728341316087.856345318286613.33911136433
566421.77891102576142.160770864966701.39705118645


Parameters (Session):
Parameters (R input):
par1 = 4 ; par2 = Triple ; par3 = additive ; par4 = 12 ;
R code (references can be found in the software module):
par1 <- as.numeric(par1)
par4 <- as.numeric(par4)
if (par2 == 'Single') K <- 1
if (par2 == 'Double') K <- 2
if (par2 == 'Triple') K <- par1
nx <- length(x)
nxmK <- nx - K
x <- ts(x, frequency = par1)
if (par2 == 'Single') fit <- HoltWinters(x, gamma=F, beta=F)
if (par2 == 'Double') fit <- HoltWinters(x, gamma=F)
if (par2 == 'Triple') fit <- HoltWinters(x, seasonal=par3)
fit
myresid <- x - fit$fitted[,'xhat']
bitmap(file='test1.png')
op <- par(mfrow=c(2,1))
plot(fit,ylab='Observed (black) / Fitted (red)',main='Interpolation Fit of Exponential Smoothing')
plot(myresid,ylab='Residuals',main='Interpolation Prediction Errors')
par(op)
dev.off()
bitmap(file='test2.png')
p <- predict(fit, par4, prediction.interval=TRUE)
np <- length(p[,1])
plot(fit,p,ylab='Observed (black) / Fitted (red)',main='Extrapolation Fit of Exponential Smoothing')
dev.off()
bitmap(file='test3.png')
op <- par(mfrow = c(2,2))
acf(as.numeric(myresid),lag.max = nx/2,main='Residual ACF')
spectrum(myresid,main='Residals Periodogram')
cpgram(myresid,main='Residal Cumulative Periodogram')
qqnorm(myresid,main='Residual Normal QQ Plot')
qqline(myresid)
par(op)
dev.off()
load(file='createtable')
a<-table.start()
a<-table.row.start(a)
a<-table.element(a,'Estimated Parameters of Exponential Smoothing',2,TRUE)
a<-table.row.end(a)
a<-table.row.start(a)
a<-table.element(a,'Parameter',header=TRUE)
a<-table.element(a,'Value',header=TRUE)
a<-table.row.end(a)
a<-table.row.start(a)
a<-table.element(a,'alpha',header=TRUE)
a<-table.element(a,fit$alpha)
a<-table.row.end(a)
a<-table.row.start(a)
a<-table.element(a,'beta',header=TRUE)
a<-table.element(a,fit$beta)
a<-table.row.end(a)
a<-table.row.start(a)
a<-table.element(a,'gamma',header=TRUE)
a<-table.element(a,fit$gamma)
a<-table.row.end(a)
a<-table.end(a)
table.save(a,file='mytable.tab')
a<-table.start()
a<-table.row.start(a)
a<-table.element(a,'Interpolation Forecasts of Exponential Smoothing',4,TRUE)
a<-table.row.end(a)
a<-table.row.start(a)
a<-table.element(a,'t',header=TRUE)
a<-table.element(a,'Observed',header=TRUE)
a<-table.element(a,'Fitted',header=TRUE)
a<-table.element(a,'Residuals',header=TRUE)
a<-table.row.end(a)
for (i in 1:nxmK) {
a<-table.row.start(a)
a<-table.element(a,i+K,header=TRUE)
a<-table.element(a,x[i+K])
a<-table.element(a,fit$fitted[i,'xhat'])
a<-table.element(a,myresid[i])
a<-table.row.end(a)
}
a<-table.end(a)
table.save(a,file='mytable1.tab')
a<-table.start()
a<-table.row.start(a)
a<-table.element(a,'Extrapolation Forecasts of Exponential Smoothing',4,TRUE)
a<-table.row.end(a)
a<-table.row.start(a)
a<-table.element(a,'t',header=TRUE)
a<-table.element(a,'Forecast',header=TRUE)
a<-table.element(a,'95% Lower Bound',header=TRUE)
a<-table.element(a,'95% Upper Bound',header=TRUE)
a<-table.row.end(a)
for (i in 1:np) {
a<-table.row.start(a)
a<-table.element(a,nx+i,header=TRUE)
a<-table.element(a,p[i,'fit'])
a<-table.element(a,p[i,'lwr'])
a<-table.element(a,p[i,'upr'])
a<-table.row.end(a)
}
a<-table.end(a)
table.save(a,file='mytable2.tab')