Free Statistics

of Irreproducible Research!

Author's title

Author*The author of this computation has been verified*
R Software Modulerwasp_smp.wasp
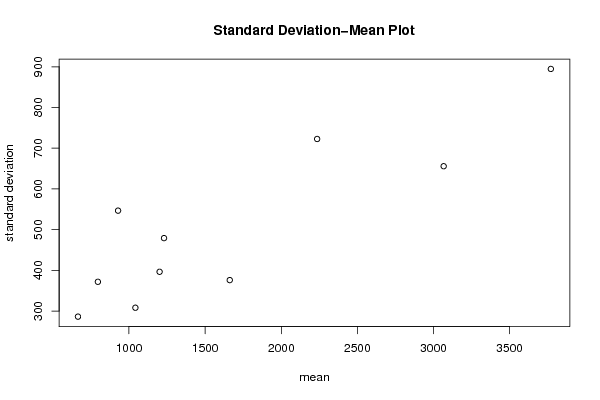
Title produced by softwareStandard Deviation-Mean Plot
Date of computationWed, 21 Dec 2016 13:20:52 +0100
Cite this page as followsStatistical Computations at FreeStatistics.org, Office for Research Development and Education, URL https://freestatistics.org/blog/index.php?v=date/2016/Dec/21/t1482322898rssrtb7pkbl1s5k.htm/, Retrieved Mon, 06 May 2024 11:54:44 +0000
Statistical Computations at FreeStatistics.org, Office for Research Development and Education, URL https://freestatistics.org/blog/index.php?pk=302213, Retrieved Mon, 06 May 2024 11:54:44 +0000
QR Codes:

Original text written by user:
IsPrivate?No (this computation is public)
User-defined keywordsN1954
Estimated Impact100
Family? (F = Feedback message, R = changed R code, M = changed R Module, P = changed Parameters, D = changed Data)
-     [ML Fitting and QQ Plot- Normal Distribution] [Normal distribution] [2016-12-15 09:27:42] [061bcad4f8cbfaa4a6cadfe6faec1e5a]
- RMPD  [Chi-Squared Test, McNemar Test, and Fisher Exact Test] [Chisquared simula...] [2016-12-15 10:38:18] [061bcad4f8cbfaa4a6cadfe6faec1e5a]
- RMPD      [Standard Deviation-Mean Plot] [Standard deviatio...] [2016-12-21 12:20:52] [9a9519454d094169f95f881e5b6f16f7] [Current]
Feedback Forum

Post a new message
Dataseries X:
1008
738
1618
824
906
868
890
740
154
756
204
842
642
1016
2012
914
794
1848
736
356
464
386
614
1358
280
756
644
620
650
938
492
274
778
522
688
1336
726
872
1522
1334
990
988
1022
554
910
1110
880
1596
402
1150
1842
1062
886
1436
1440
1156
986
1764
952
1336
618
1286
1768
1366
878
692
1874
780
1460
670
1562
1806
1008
1488
2112
2006
2126
1912
1450
1622
1034
1898
1628
1658
1240
1620
2640
2482
2208
2234
2756
2040
3672
2644
970
2322
2110
4366
2830
3306
3104
4094
3112
2798
2646
2624
2428
3384
2576
2194
3724
4330
3336
4930
3682
3262
4012
3890
5410
3902
3782
5424
5566
4102
2948
5134


Summary of computational transaction
Raw Input view raw input (R code)
Raw Outputview raw output of R engine
Computing time1 seconds
R ServerBig Analytics Cloud Computing Center

\begin{tabular}{lllllllll}
\hline
Summary of computational transaction \tabularnewline
Raw Input view raw input (R code)  \tabularnewline
Raw Outputview raw output of R engine  \tabularnewline
Computing time1 seconds \tabularnewline
R ServerBig Analytics Cloud Computing Center \tabularnewline
\hline
\end{tabular}
%Source: https://freestatistics.org/blog/index.php?pk=302213&T=0

[TABLE]
[ROW]
Summary of computational transaction[/C][/ROW] [ROW]Raw Input[/C] view raw input (R code) [/C][/ROW] [ROW]Raw Output[/C]view raw output of R engine [/C][/ROW] [ROW]Computing time[/C]1 seconds[/C][/ROW] [ROW]R Server[/C]Big Analytics Cloud Computing Center[/C][/ROW] [/TABLE] Source: https://freestatistics.org/blog/index.php?pk=302213&T=0

Globally Unique Identifier (entire table): ba.freestatistics.org/blog/index.php?pk=302213&T=0

As an alternative you can also use a QR Code:  

The GUIDs for individual cells are displayed in the table below:

Summary of computational transaction
Raw Input view raw input (R code)
Raw Outputview raw output of R engine
Computing time1 seconds
R ServerBig Analytics Cloud Computing Center


Standard Deviation-Mean Plot
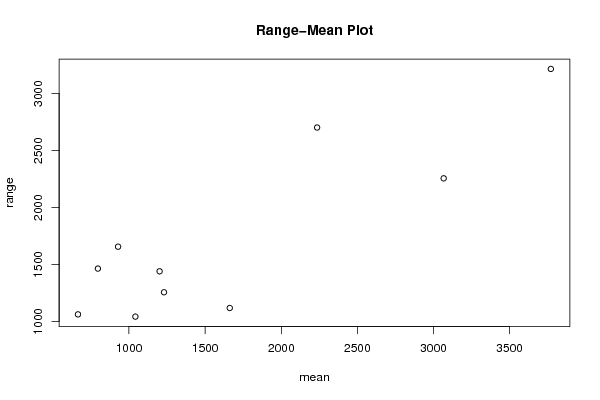
SectionMeanStandard DeviationRange
1795.666666666667371.7739619552171464
2928.333333333333546.5387507401521656
3664.833333333333286.1219807683221062
41042308.0425000193671042
51201396.3721850621071440
61230479.0809383126671256
71661.83333333333375.9133926689481118
82235.66666666667722.5912126548872702
93066.83333333333655.6969689967422256
103770.66666666667894.6748859307233216

\begin{tabular}{lllllllll}
\hline
Standard Deviation-Mean Plot \tabularnewline
Section & Mean & Standard Deviation & Range \tabularnewline
1 & 795.666666666667 & 371.773961955217 & 1464 \tabularnewline
2 & 928.333333333333 & 546.538750740152 & 1656 \tabularnewline
3 & 664.833333333333 & 286.121980768322 & 1062 \tabularnewline
4 & 1042 & 308.042500019367 & 1042 \tabularnewline
5 & 1201 & 396.372185062107 & 1440 \tabularnewline
6 & 1230 & 479.080938312667 & 1256 \tabularnewline
7 & 1661.83333333333 & 375.913392668948 & 1118 \tabularnewline
8 & 2235.66666666667 & 722.591212654887 & 2702 \tabularnewline
9 & 3066.83333333333 & 655.696968996742 & 2256 \tabularnewline
10 & 3770.66666666667 & 894.674885930723 & 3216 \tabularnewline
\hline
\end{tabular}
%Source: https://freestatistics.org/blog/index.php?pk=302213&T=1

[TABLE]
[ROW][C]Standard Deviation-Mean Plot[/C][/ROW]
[ROW][C]Section[/C][C]Mean[/C][C]Standard Deviation[/C][C]Range[/C][/ROW]
[ROW][C]1[/C][C]795.666666666667[/C][C]371.773961955217[/C][C]1464[/C][/ROW]
[ROW][C]2[/C][C]928.333333333333[/C][C]546.538750740152[/C][C]1656[/C][/ROW]
[ROW][C]3[/C][C]664.833333333333[/C][C]286.121980768322[/C][C]1062[/C][/ROW]
[ROW][C]4[/C][C]1042[/C][C]308.042500019367[/C][C]1042[/C][/ROW]
[ROW][C]5[/C][C]1201[/C][C]396.372185062107[/C][C]1440[/C][/ROW]
[ROW][C]6[/C][C]1230[/C][C]479.080938312667[/C][C]1256[/C][/ROW]
[ROW][C]7[/C][C]1661.83333333333[/C][C]375.913392668948[/C][C]1118[/C][/ROW]
[ROW][C]8[/C][C]2235.66666666667[/C][C]722.591212654887[/C][C]2702[/C][/ROW]
[ROW][C]9[/C][C]3066.83333333333[/C][C]655.696968996742[/C][C]2256[/C][/ROW]
[ROW][C]10[/C][C]3770.66666666667[/C][C]894.674885930723[/C][C]3216[/C][/ROW]
[/TABLE]
Source: https://freestatistics.org/blog/index.php?pk=302213&T=1

Globally Unique Identifier (entire table): ba.freestatistics.org/blog/index.php?pk=302213&T=1

As an alternative you can also use a QR Code:  

The GUIDs for individual cells are displayed in the table below:

Standard Deviation-Mean Plot
SectionMeanStandard DeviationRange
1795.666666666667371.7739619552171464
2928.333333333333546.5387507401521656
3664.833333333333286.1219807683221062
41042308.0425000193671042
51201396.3721850621071440
61230479.0809383126671256
71661.83333333333375.9133926689481118
82235.66666666667722.5912126548872702
93066.83333333333655.6969689967422256
103770.66666666667894.6748859307233216


Regression: S.E.(k) = alpha + beta * Mean(k)
alpha225.571552765032
beta0.167567583140889
S.D.0.0322315552457938
T-STAT5.19886744102293
p-value0.00082353997822132

\begin{tabular}{lllllllll}
\hline
Regression: S.E.(k) = alpha + beta * Mean(k) \tabularnewline
alpha & 225.571552765032 \tabularnewline
beta & 0.167567583140889 \tabularnewline
S.D. & 0.0322315552457938 \tabularnewline
T-STAT & 5.19886744102293 \tabularnewline
p-value & 0.00082353997822132 \tabularnewline
\hline
\end{tabular}
%Source: https://freestatistics.org/blog/index.php?pk=302213&T=2

[TABLE]
[ROW][C]Regression: S.E.(k) = alpha + beta * Mean(k)[/C][/ROW]
[ROW][C]alpha[/C][C]225.571552765032[/C][/ROW]
[ROW][C]beta[/C][C]0.167567583140889[/C][/ROW]
[ROW][C]S.D.[/C][C]0.0322315552457938[/C][/ROW]
[ROW][C]T-STAT[/C][C]5.19886744102293[/C][/ROW]
[ROW][C]p-value[/C][C]0.00082353997822132[/C][/ROW]
[/TABLE]
Source: https://freestatistics.org/blog/index.php?pk=302213&T=2

Globally Unique Identifier (entire table): ba.freestatistics.org/blog/index.php?pk=302213&T=2

As an alternative you can also use a QR Code:  

The GUIDs for individual cells are displayed in the table below:

Regression: S.E.(k) = alpha + beta * Mean(k)
alpha225.571552765032
beta0.167567583140889
S.D.0.0322315552457938
T-STAT5.19886744102293
p-value0.00082353997822132


Regression: ln S.E.(k) = alpha + beta * ln Mean(k)
alpha2.18312713332513
beta0.547504423227709
S.D.0.126950736014094
T-STAT4.31273138240746
p-value0.00257116052815187
Lambda0.452495576772291

\begin{tabular}{lllllllll}
\hline
Regression: ln S.E.(k) = alpha + beta * ln Mean(k) \tabularnewline
alpha & 2.18312713332513 \tabularnewline
beta & 0.547504423227709 \tabularnewline
S.D. & 0.126950736014094 \tabularnewline
T-STAT & 4.31273138240746 \tabularnewline
p-value & 0.00257116052815187 \tabularnewline
Lambda & 0.452495576772291 \tabularnewline
\hline
\end{tabular}
%Source: https://freestatistics.org/blog/index.php?pk=302213&T=3

[TABLE]
[ROW][C]Regression: ln S.E.(k) = alpha + beta * ln Mean(k)[/C][/ROW]
[ROW][C]alpha[/C][C]2.18312713332513[/C][/ROW]
[ROW][C]beta[/C][C]0.547504423227709[/C][/ROW]
[ROW][C]S.D.[/C][C]0.126950736014094[/C][/ROW]
[ROW][C]T-STAT[/C][C]4.31273138240746[/C][/ROW]
[ROW][C]p-value[/C][C]0.00257116052815187[/C][/ROW]
[ROW][C]Lambda[/C][C]0.452495576772291[/C][/ROW]
[/TABLE]
Source: https://freestatistics.org/blog/index.php?pk=302213&T=3

Globally Unique Identifier (entire table): ba.freestatistics.org/blog/index.php?pk=302213&T=3

As an alternative you can also use a QR Code:  

The GUIDs for individual cells are displayed in the table below:

Regression: ln S.E.(k) = alpha + beta * ln Mean(k)
alpha2.18312713332513
beta0.547504423227709
S.D.0.126950736014094
T-STAT4.31273138240746
p-value0.00257116052815187
Lambda0.452495576772291


Parameters (Session):
par1 = 12 ;
Parameters (R input):
par1 = 12 ;
R code (references can be found in the software module):
par1 <- as.numeric(par1)
(n <- length(x))
(np <- floor(n / par1))
arr <- array(NA,dim=c(par1,np))
j <- 0
k <- 1
for (i in 1:(np*par1))
{
j = j + 1
arr[j,k] <- x[i]
if (j == par1) {
j = 0
k=k+1
}
}
arr
arr.mean <- array(NA,dim=np)
arr.sd <- array(NA,dim=np)
arr.range <- array(NA,dim=np)
for (j in 1:np)
{
arr.mean[j] <- mean(arr[,j],na.rm=TRUE)
arr.sd[j] <- sd(arr[,j],na.rm=TRUE)
arr.range[j] <- max(arr[,j],na.rm=TRUE) - min(arr[,j],na.rm=TRUE)
}
arr.mean
arr.sd
arr.range
(lm1 <- lm(arr.sd~arr.mean))
(lnlm1 <- lm(log(arr.sd)~log(arr.mean)))
(lm2 <- lm(arr.range~arr.mean))
bitmap(file='test1.png')
plot(arr.mean,arr.sd,main='Standard Deviation-Mean Plot',xlab='mean',ylab='standard deviation')
dev.off()
bitmap(file='test2.png')
plot(arr.mean,arr.range,main='Range-Mean Plot',xlab='mean',ylab='range')
dev.off()
load(file='createtable')
a<-table.start()
a<-table.row.start(a)
a<-table.element(a,'Standard Deviation-Mean Plot',4,TRUE)
a<-table.row.end(a)
a<-table.row.start(a)
a<-table.element(a,'Section',header=TRUE)
a<-table.element(a,'Mean',header=TRUE)
a<-table.element(a,'Standard Deviation',header=TRUE)
a<-table.element(a,'Range',header=TRUE)
a<-table.row.end(a)
for (j in 1:np) {
a<-table.row.start(a)
a<-table.element(a,j,header=TRUE)
a<-table.element(a,arr.mean[j])
a<-table.element(a,arr.sd[j] )
a<-table.element(a,arr.range[j] )
a<-table.row.end(a)
}
a<-table.end(a)
table.save(a,file='mytable.tab')
a<-table.start()
a<-table.row.start(a)
a<-table.element(a,'Regression: S.E.(k) = alpha + beta * Mean(k)',2,TRUE)
a<-table.row.end(a)
a<-table.row.start(a)
a<-table.element(a,'alpha',header=TRUE)
a<-table.element(a,lm1$coefficients[[1]])
a<-table.row.end(a)
a<-table.row.start(a)
a<-table.element(a,'beta',header=TRUE)
a<-table.element(a,lm1$coefficients[[2]])
a<-table.row.end(a)
a<-table.row.start(a)
a<-table.element(a,'S.D.',header=TRUE)
a<-table.element(a,summary(lm1)$coefficients[2,2])
a<-table.row.end(a)
a<-table.row.start(a)
a<-table.element(a,'T-STAT',header=TRUE)
a<-table.element(a,summary(lm1)$coefficients[2,3])
a<-table.row.end(a)
a<-table.row.start(a)
a<-table.element(a,'p-value',header=TRUE)
a<-table.element(a,summary(lm1)$coefficients[2,4])
a<-table.row.end(a)
a<-table.end(a)
table.save(a,file='mytable1.tab')
a<-table.start()
a<-table.row.start(a)
a<-table.element(a,'Regression: ln S.E.(k) = alpha + beta * ln Mean(k)',2,TRUE)
a<-table.row.end(a)
a<-table.row.start(a)
a<-table.element(a,'alpha',header=TRUE)
a<-table.element(a,lnlm1$coefficients[[1]])
a<-table.row.end(a)
a<-table.row.start(a)
a<-table.element(a,'beta',header=TRUE)
a<-table.element(a,lnlm1$coefficients[[2]])
a<-table.row.end(a)
a<-table.row.start(a)
a<-table.element(a,'S.D.',header=TRUE)
a<-table.element(a,summary(lnlm1)$coefficients[2,2])
a<-table.row.end(a)
a<-table.row.start(a)
a<-table.element(a,'T-STAT',header=TRUE)
a<-table.element(a,summary(lnlm1)$coefficients[2,3])
a<-table.row.end(a)
a<-table.row.start(a)
a<-table.element(a,'p-value',header=TRUE)
a<-table.element(a,summary(lnlm1)$coefficients[2,4])
a<-table.row.end(a)
a<-table.row.start(a)
a<-table.element(a,'Lambda',header=TRUE)
a<-table.element(a,1-lnlm1$coefficients[[2]])
a<-table.row.end(a)
a<-table.end(a)
table.save(a,file='mytable2.tab')