Free Statistics

of Irreproducible Research!

Author's title

Author*The author of this computation has been verified*
R Software Modulerwasp_exponentialsmoothing.wasp
Title produced by softwareExponential Smoothing
Date of computationWed, 21 Dec 2016 13:24:21 +0100
Cite this page as followsStatistical Computations at FreeStatistics.org, Office for Research Development and Education, URL https://freestatistics.org/blog/index.php?v=date/2016/Dec/21/t14823230985lmdrmqlne29zvv.htm/, Retrieved Mon, 06 May 2024 11:58:29 +0000
Statistical Computations at FreeStatistics.org, Office for Research Development and Education, URL https://freestatistics.org/blog/index.php?pk=302219, Retrieved Mon, 06 May 2024 11:58:29 +0000
QR Codes:

Original text written by user:
IsPrivate?No (this computation is public)
User-defined keywords
Estimated Impact58
Family? (F = Feedback message, R = changed R code, M = changed R Module, P = changed Parameters, D = changed Data)
-       [Exponential Smoothing] [] [2016-12-21 12:24:21] [1a4fa2544711480e714211476e711237] [Current]
Feedback Forum

Post a new message
Dataseries X:
142.2
162.3
143.4
257.1
235.8
188.1
190.2
298.2
363.6
325.2
321
391.8
481.5
416.7
603
499.2
551.4
613.5
776.1
956.4
1351.2
1593.6
1488.6
1361.7
1774.8
1893
1716.9
1453.8
1869.6
2110.8
2106.9
2845.2
3255
4645.8
4773
6724.2
9043.8
9135.3
11113.8
14501.4
19131.3


Summary of computational transaction
Raw Input view raw input (R code)
Raw Outputview raw output of R engine
Computing time1 seconds
R ServerBig Analytics Cloud Computing Center

\begin{tabular}{lllllllll}
\hline
Summary of computational transaction \tabularnewline
Raw Input view raw input (R code)  \tabularnewline
Raw Outputview raw output of R engine  \tabularnewline
Computing time1 seconds \tabularnewline
R ServerBig Analytics Cloud Computing Center \tabularnewline
\hline
\end{tabular}
%Source: https://freestatistics.org/blog/index.php?pk=302219&T=0

[TABLE]
[ROW]
Summary of computational transaction[/C][/ROW] [ROW]Raw Input[/C] view raw input (R code) [/C][/ROW] [ROW]Raw Output[/C]view raw output of R engine [/C][/ROW] [ROW]Computing time[/C]1 seconds[/C][/ROW] [ROW]R Server[/C]Big Analytics Cloud Computing Center[/C][/ROW] [/TABLE] Source: https://freestatistics.org/blog/index.php?pk=302219&T=0

Globally Unique Identifier (entire table): ba.freestatistics.org/blog/index.php?pk=302219&T=0

As an alternative you can also use a QR Code:  

The GUIDs for individual cells are displayed in the table below:

Summary of computational transaction
Raw Input view raw input (R code)
Raw Outputview raw output of R engine
Computing time1 seconds
R ServerBig Analytics Cloud Computing Center


Estimated Parameters of Exponential Smoothing
ParameterValue
alpha1
beta0.637307246420762
gammaFALSE

\begin{tabular}{lllllllll}
\hline
Estimated Parameters of Exponential Smoothing \tabularnewline
Parameter & Value \tabularnewline
alpha & 1 \tabularnewline
beta & 0.637307246420762 \tabularnewline
gamma & FALSE \tabularnewline
\hline
\end{tabular}
%Source: https://freestatistics.org/blog/index.php?pk=302219&T=1

[TABLE]
[ROW][C]Estimated Parameters of Exponential Smoothing[/C][/ROW]
[ROW][C]Parameter[/C][C]Value[/C][/ROW]
[ROW][C]alpha[/C][C]1[/C][/ROW]
[ROW][C]beta[/C][C]0.637307246420762[/C][/ROW]
[ROW][C]gamma[/C][C]FALSE[/C][/ROW]
[/TABLE]
Source: https://freestatistics.org/blog/index.php?pk=302219&T=1

Globally Unique Identifier (entire table): ba.freestatistics.org/blog/index.php?pk=302219&T=1

As an alternative you can also use a QR Code:  

The GUIDs for individual cells are displayed in the table below:

Estimated Parameters of Exponential Smoothing
ParameterValue
alpha1
beta0.637307246420762
gammaFALSE


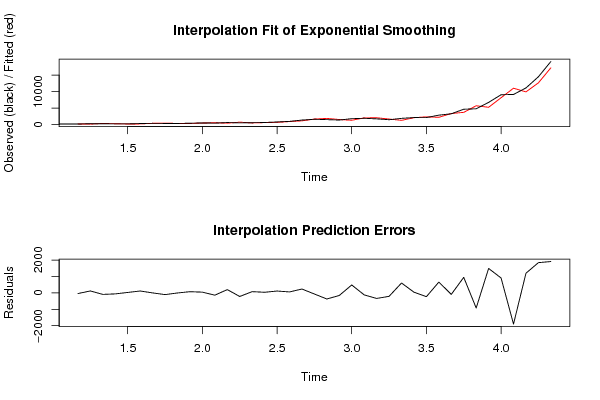
Interpolation Forecasts of Exponential Smoothing
tObservedFittedResiduals
3143.4182.4-39
4257.1138.64501738959118.45498261041
5235.8327.83723618185-92.0372361818498
6188.1247.881238622618-59.7812386226177
7190.2162.08222204841528.1177779515853
8298.2182.10188569021116.09811430979
9363.6364.092055235625-0.492055235625116
10325.2429.178464868322-103.978464868322
11321324.512235736034-3.51223573603369
12391.8318.07386245032173.7261375496785
13481.5435.86006416134545.6399358386545
14416.7554.646725997499-137.946725997499
15603401.932277899273201.067722100727
16499.2716.374194215383-217.174194215383
17551.4474.16750650632977.2324934936707
18613.5575.5883342689937.9116657310101
19776.1661.849713563244114.250286436756
20956.4897.26224901503759.1377509849634
211351.21115.25116625478235.94883374522
221593.61660.42306778514-66.8230677851366
231488.61860.2362424576-371.636242457603
241361.71518.38977210679-156.689772106789
251774.81291.63024490311483.169755096885
2618932012.6578310777-119.657831077705
271716.92054.59902824089-337.699028240892
281453.81663.28099043372-209.480990433722
291869.61266.67723724291602.922762757088
302110.82066.7242829800344.0757170199699
312106.92336.01405682805-229.114056828048
322845.22186.09800815467659.101991845325
3332553344.44848368806-89.4484836880583
344645.83697.24231685231948.557683147691
3547735692.56500197042-919.565001970423
366724.25233.719562659751490.48043734025
379043.88134.81354602508908.986453974921
389135.311033.7172000416-1898.41720004161
3911113.89915.342161725281198.45783827472
4014501.412657.62802658751843.77197341248
4119131.317220.27726599081911.0227340092

\begin{tabular}{lllllllll}
\hline
Interpolation Forecasts of Exponential Smoothing \tabularnewline
t & Observed & Fitted & Residuals \tabularnewline
3 & 143.4 & 182.4 & -39 \tabularnewline
4 & 257.1 & 138.64501738959 & 118.45498261041 \tabularnewline
5 & 235.8 & 327.83723618185 & -92.0372361818498 \tabularnewline
6 & 188.1 & 247.881238622618 & -59.7812386226177 \tabularnewline
7 & 190.2 & 162.082222048415 & 28.1177779515853 \tabularnewline
8 & 298.2 & 182.10188569021 & 116.09811430979 \tabularnewline
9 & 363.6 & 364.092055235625 & -0.492055235625116 \tabularnewline
10 & 325.2 & 429.178464868322 & -103.978464868322 \tabularnewline
11 & 321 & 324.512235736034 & -3.51223573603369 \tabularnewline
12 & 391.8 & 318.073862450321 & 73.7261375496785 \tabularnewline
13 & 481.5 & 435.860064161345 & 45.6399358386545 \tabularnewline
14 & 416.7 & 554.646725997499 & -137.946725997499 \tabularnewline
15 & 603 & 401.932277899273 & 201.067722100727 \tabularnewline
16 & 499.2 & 716.374194215383 & -217.174194215383 \tabularnewline
17 & 551.4 & 474.167506506329 & 77.2324934936707 \tabularnewline
18 & 613.5 & 575.58833426899 & 37.9116657310101 \tabularnewline
19 & 776.1 & 661.849713563244 & 114.250286436756 \tabularnewline
20 & 956.4 & 897.262249015037 & 59.1377509849634 \tabularnewline
21 & 1351.2 & 1115.25116625478 & 235.94883374522 \tabularnewline
22 & 1593.6 & 1660.42306778514 & -66.8230677851366 \tabularnewline
23 & 1488.6 & 1860.2362424576 & -371.636242457603 \tabularnewline
24 & 1361.7 & 1518.38977210679 & -156.689772106789 \tabularnewline
25 & 1774.8 & 1291.63024490311 & 483.169755096885 \tabularnewline
26 & 1893 & 2012.6578310777 & -119.657831077705 \tabularnewline
27 & 1716.9 & 2054.59902824089 & -337.699028240892 \tabularnewline
28 & 1453.8 & 1663.28099043372 & -209.480990433722 \tabularnewline
29 & 1869.6 & 1266.67723724291 & 602.922762757088 \tabularnewline
30 & 2110.8 & 2066.72428298003 & 44.0757170199699 \tabularnewline
31 & 2106.9 & 2336.01405682805 & -229.114056828048 \tabularnewline
32 & 2845.2 & 2186.09800815467 & 659.101991845325 \tabularnewline
33 & 3255 & 3344.44848368806 & -89.4484836880583 \tabularnewline
34 & 4645.8 & 3697.24231685231 & 948.557683147691 \tabularnewline
35 & 4773 & 5692.56500197042 & -919.565001970423 \tabularnewline
36 & 6724.2 & 5233.71956265975 & 1490.48043734025 \tabularnewline
37 & 9043.8 & 8134.81354602508 & 908.986453974921 \tabularnewline
38 & 9135.3 & 11033.7172000416 & -1898.41720004161 \tabularnewline
39 & 11113.8 & 9915.34216172528 & 1198.45783827472 \tabularnewline
40 & 14501.4 & 12657.6280265875 & 1843.77197341248 \tabularnewline
41 & 19131.3 & 17220.2772659908 & 1911.0227340092 \tabularnewline
\hline
\end{tabular}
%Source: https://freestatistics.org/blog/index.php?pk=302219&T=2

[TABLE]
[ROW][C]Interpolation Forecasts of Exponential Smoothing[/C][/ROW]
[ROW][C]t[/C][C]Observed[/C][C]Fitted[/C][C]Residuals[/C][/ROW]
[ROW][C]3[/C][C]143.4[/C][C]182.4[/C][C]-39[/C][/ROW]
[ROW][C]4[/C][C]257.1[/C][C]138.64501738959[/C][C]118.45498261041[/C][/ROW]
[ROW][C]5[/C][C]235.8[/C][C]327.83723618185[/C][C]-92.0372361818498[/C][/ROW]
[ROW][C]6[/C][C]188.1[/C][C]247.881238622618[/C][C]-59.7812386226177[/C][/ROW]
[ROW][C]7[/C][C]190.2[/C][C]162.082222048415[/C][C]28.1177779515853[/C][/ROW]
[ROW][C]8[/C][C]298.2[/C][C]182.10188569021[/C][C]116.09811430979[/C][/ROW]
[ROW][C]9[/C][C]363.6[/C][C]364.092055235625[/C][C]-0.492055235625116[/C][/ROW]
[ROW][C]10[/C][C]325.2[/C][C]429.178464868322[/C][C]-103.978464868322[/C][/ROW]
[ROW][C]11[/C][C]321[/C][C]324.512235736034[/C][C]-3.51223573603369[/C][/ROW]
[ROW][C]12[/C][C]391.8[/C][C]318.073862450321[/C][C]73.7261375496785[/C][/ROW]
[ROW][C]13[/C][C]481.5[/C][C]435.860064161345[/C][C]45.6399358386545[/C][/ROW]
[ROW][C]14[/C][C]416.7[/C][C]554.646725997499[/C][C]-137.946725997499[/C][/ROW]
[ROW][C]15[/C][C]603[/C][C]401.932277899273[/C][C]201.067722100727[/C][/ROW]
[ROW][C]16[/C][C]499.2[/C][C]716.374194215383[/C][C]-217.174194215383[/C][/ROW]
[ROW][C]17[/C][C]551.4[/C][C]474.167506506329[/C][C]77.2324934936707[/C][/ROW]
[ROW][C]18[/C][C]613.5[/C][C]575.58833426899[/C][C]37.9116657310101[/C][/ROW]
[ROW][C]19[/C][C]776.1[/C][C]661.849713563244[/C][C]114.250286436756[/C][/ROW]
[ROW][C]20[/C][C]956.4[/C][C]897.262249015037[/C][C]59.1377509849634[/C][/ROW]
[ROW][C]21[/C][C]1351.2[/C][C]1115.25116625478[/C][C]235.94883374522[/C][/ROW]
[ROW][C]22[/C][C]1593.6[/C][C]1660.42306778514[/C][C]-66.8230677851366[/C][/ROW]
[ROW][C]23[/C][C]1488.6[/C][C]1860.2362424576[/C][C]-371.636242457603[/C][/ROW]
[ROW][C]24[/C][C]1361.7[/C][C]1518.38977210679[/C][C]-156.689772106789[/C][/ROW]
[ROW][C]25[/C][C]1774.8[/C][C]1291.63024490311[/C][C]483.169755096885[/C][/ROW]
[ROW][C]26[/C][C]1893[/C][C]2012.6578310777[/C][C]-119.657831077705[/C][/ROW]
[ROW][C]27[/C][C]1716.9[/C][C]2054.59902824089[/C][C]-337.699028240892[/C][/ROW]
[ROW][C]28[/C][C]1453.8[/C][C]1663.28099043372[/C][C]-209.480990433722[/C][/ROW]
[ROW][C]29[/C][C]1869.6[/C][C]1266.67723724291[/C][C]602.922762757088[/C][/ROW]
[ROW][C]30[/C][C]2110.8[/C][C]2066.72428298003[/C][C]44.0757170199699[/C][/ROW]
[ROW][C]31[/C][C]2106.9[/C][C]2336.01405682805[/C][C]-229.114056828048[/C][/ROW]
[ROW][C]32[/C][C]2845.2[/C][C]2186.09800815467[/C][C]659.101991845325[/C][/ROW]
[ROW][C]33[/C][C]3255[/C][C]3344.44848368806[/C][C]-89.4484836880583[/C][/ROW]
[ROW][C]34[/C][C]4645.8[/C][C]3697.24231685231[/C][C]948.557683147691[/C][/ROW]
[ROW][C]35[/C][C]4773[/C][C]5692.56500197042[/C][C]-919.565001970423[/C][/ROW]
[ROW][C]36[/C][C]6724.2[/C][C]5233.71956265975[/C][C]1490.48043734025[/C][/ROW]
[ROW][C]37[/C][C]9043.8[/C][C]8134.81354602508[/C][C]908.986453974921[/C][/ROW]
[ROW][C]38[/C][C]9135.3[/C][C]11033.7172000416[/C][C]-1898.41720004161[/C][/ROW]
[ROW][C]39[/C][C]11113.8[/C][C]9915.34216172528[/C][C]1198.45783827472[/C][/ROW]
[ROW][C]40[/C][C]14501.4[/C][C]12657.6280265875[/C][C]1843.77197341248[/C][/ROW]
[ROW][C]41[/C][C]19131.3[/C][C]17220.2772659908[/C][C]1911.0227340092[/C][/ROW]
[/TABLE]
Source: https://freestatistics.org/blog/index.php?pk=302219&T=2

Globally Unique Identifier (entire table): ba.freestatistics.org/blog/index.php?pk=302219&T=2

As an alternative you can also use a QR Code:  

The GUIDs for individual cells are displayed in the table below:

Interpolation Forecasts of Exponential Smoothing
tObservedFittedResiduals
3143.4182.4-39
4257.1138.64501738959118.45498261041
5235.8327.83723618185-92.0372361818498
6188.1247.881238622618-59.7812386226177
7190.2162.08222204841528.1177779515853
8298.2182.10188569021116.09811430979
9363.6364.092055235625-0.492055235625116
10325.2429.178464868322-103.978464868322
11321324.512235736034-3.51223573603369
12391.8318.07386245032173.7261375496785
13481.5435.86006416134545.6399358386545
14416.7554.646725997499-137.946725997499
15603401.932277899273201.067722100727
16499.2716.374194215383-217.174194215383
17551.4474.16750650632977.2324934936707
18613.5575.5883342689937.9116657310101
19776.1661.849713563244114.250286436756
20956.4897.26224901503759.1377509849634
211351.21115.25116625478235.94883374522
221593.61660.42306778514-66.8230677851366
231488.61860.2362424576-371.636242457603
241361.71518.38977210679-156.689772106789
251774.81291.63024490311483.169755096885
2618932012.6578310777-119.657831077705
271716.92054.59902824089-337.699028240892
281453.81663.28099043372-209.480990433722
291869.61266.67723724291602.922762757088
302110.82066.7242829800344.0757170199699
312106.92336.01405682805-229.114056828048
322845.22186.09800815467659.101991845325
3332553344.44848368806-89.4484836880583
344645.83697.24231685231948.557683147691
3547735692.56500197042-919.565001970423
366724.25233.719562659751490.48043734025
379043.88134.81354602508908.986453974921
389135.311033.7172000416-1898.41720004161
3911113.89915.342161725281198.45783827472
4014501.412657.62802658751843.77197341248
4119131.317220.27726599081911.0227340092


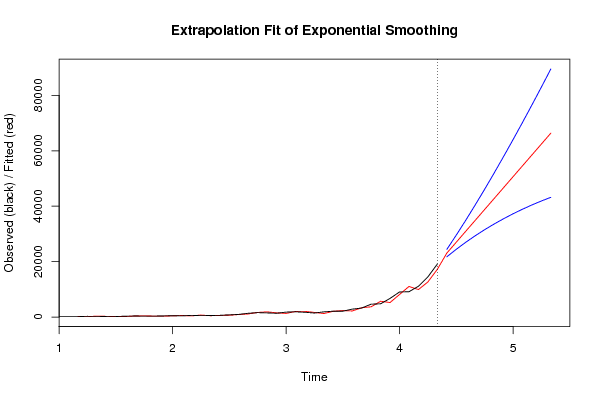
Extrapolation Forecasts of Exponential Smoothing
tForecast95% Lower Bound95% Upper Bound
4223068.085902449721734.364695015524401.8071098838
4327004.871804899424446.081518977329563.6620908214
4430941.65770734926972.935866328834910.3795483693
4534878.443609798729325.623166255940431.2640533415
4638815.229512248431518.548084728146111.9109397687
4742752.015414698133564.036603895951939.9942255003
4846688.801317147835472.252567902357905.3500663933
4950625.587219597537251.636413984563999.5380252104
5054562.373122047138909.299807362570215.4464367318
5158499.159024496840451.323569160476546.9944798332
5262435.944926946541882.976574860482988.9132790326
5366372.730829396243208.877496700589536.5841620918

\begin{tabular}{lllllllll}
\hline
Extrapolation Forecasts of Exponential Smoothing \tabularnewline
t & Forecast & 95% Lower Bound & 95% Upper Bound \tabularnewline
42 & 23068.0859024497 & 21734.3646950155 & 24401.8071098838 \tabularnewline
43 & 27004.8718048994 & 24446.0815189773 & 29563.6620908214 \tabularnewline
44 & 30941.657707349 & 26972.9358663288 & 34910.3795483693 \tabularnewline
45 & 34878.4436097987 & 29325.6231662559 & 40431.2640533415 \tabularnewline
46 & 38815.2295122484 & 31518.5480847281 & 46111.9109397687 \tabularnewline
47 & 42752.0154146981 & 33564.0366038959 & 51939.9942255003 \tabularnewline
48 & 46688.8013171478 & 35472.2525679023 & 57905.3500663933 \tabularnewline
49 & 50625.5872195975 & 37251.6364139845 & 63999.5380252104 \tabularnewline
50 & 54562.3731220471 & 38909.2998073625 & 70215.4464367318 \tabularnewline
51 & 58499.1590244968 & 40451.3235691604 & 76546.9944798332 \tabularnewline
52 & 62435.9449269465 & 41882.9765748604 & 82988.9132790326 \tabularnewline
53 & 66372.7308293962 & 43208.8774967005 & 89536.5841620918 \tabularnewline
\hline
\end{tabular}
%Source: https://freestatistics.org/blog/index.php?pk=302219&T=3

[TABLE]
[ROW][C]Extrapolation Forecasts of Exponential Smoothing[/C][/ROW]
[ROW][C]t[/C][C]Forecast[/C][C]95% Lower Bound[/C][C]95% Upper Bound[/C][/ROW]
[ROW][C]42[/C][C]23068.0859024497[/C][C]21734.3646950155[/C][C]24401.8071098838[/C][/ROW]
[ROW][C]43[/C][C]27004.8718048994[/C][C]24446.0815189773[/C][C]29563.6620908214[/C][/ROW]
[ROW][C]44[/C][C]30941.657707349[/C][C]26972.9358663288[/C][C]34910.3795483693[/C][/ROW]
[ROW][C]45[/C][C]34878.4436097987[/C][C]29325.6231662559[/C][C]40431.2640533415[/C][/ROW]
[ROW][C]46[/C][C]38815.2295122484[/C][C]31518.5480847281[/C][C]46111.9109397687[/C][/ROW]
[ROW][C]47[/C][C]42752.0154146981[/C][C]33564.0366038959[/C][C]51939.9942255003[/C][/ROW]
[ROW][C]48[/C][C]46688.8013171478[/C][C]35472.2525679023[/C][C]57905.3500663933[/C][/ROW]
[ROW][C]49[/C][C]50625.5872195975[/C][C]37251.6364139845[/C][C]63999.5380252104[/C][/ROW]
[ROW][C]50[/C][C]54562.3731220471[/C][C]38909.2998073625[/C][C]70215.4464367318[/C][/ROW]
[ROW][C]51[/C][C]58499.1590244968[/C][C]40451.3235691604[/C][C]76546.9944798332[/C][/ROW]
[ROW][C]52[/C][C]62435.9449269465[/C][C]41882.9765748604[/C][C]82988.9132790326[/C][/ROW]
[ROW][C]53[/C][C]66372.7308293962[/C][C]43208.8774967005[/C][C]89536.5841620918[/C][/ROW]
[/TABLE]
Source: https://freestatistics.org/blog/index.php?pk=302219&T=3

Globally Unique Identifier (entire table): ba.freestatistics.org/blog/index.php?pk=302219&T=3

As an alternative you can also use a QR Code:  

The GUIDs for individual cells are displayed in the table below:

Extrapolation Forecasts of Exponential Smoothing
tForecast95% Lower Bound95% Upper Bound
4223068.085902449721734.364695015524401.8071098838
4327004.871804899424446.081518977329563.6620908214
4430941.65770734926972.935866328834910.3795483693
4534878.443609798729325.623166255940431.2640533415
4638815.229512248431518.548084728146111.9109397687
4742752.015414698133564.036603895951939.9942255003
4846688.801317147835472.252567902357905.3500663933
4950625.587219597537251.636413984563999.5380252104
5054562.373122047138909.299807362570215.4464367318
5158499.159024496840451.323569160476546.9944798332
5262435.944926946541882.976574860482988.9132790326
5366372.730829396243208.877496700589536.5841620918


Parameters (Session):
par1 = 12 ; par2 = Double ; par3 = additive ; par4 = 12 ;
Parameters (R input):
par1 = 12 ; par2 = Double ; par3 = additive ; par4 = 12 ;
R code (references can be found in the software module):
par1 <- as.numeric(par1)
par4 <- as.numeric(par4)
if (par2 == 'Single') K <- 1
if (par2 == 'Double') K <- 2
if (par2 == 'Triple') K <- par1
nx <- length(x)
nxmK <- nx - K
x <- ts(x, frequency = par1)
if (par2 == 'Single') fit <- HoltWinters(x, gamma=F, beta=F)
if (par2 == 'Double') fit <- HoltWinters(x, gamma=F)
if (par2 == 'Triple') fit <- HoltWinters(x, seasonal=par3)
fit
myresid <- x - fit$fitted[,'xhat']
bitmap(file='test1.png')
op <- par(mfrow=c(2,1))
plot(fit,ylab='Observed (black) / Fitted (red)',main='Interpolation Fit of Exponential Smoothing')
plot(myresid,ylab='Residuals',main='Interpolation Prediction Errors')
par(op)
dev.off()
bitmap(file='test2.png')
p <- predict(fit, par4, prediction.interval=TRUE)
np <- length(p[,1])
plot(fit,p,ylab='Observed (black) / Fitted (red)',main='Extrapolation Fit of Exponential Smoothing')
dev.off()
bitmap(file='test3.png')
op <- par(mfrow = c(2,2))
acf(as.numeric(myresid),lag.max = nx/2,main='Residual ACF')
spectrum(myresid,main='Residals Periodogram')
cpgram(myresid,main='Residal Cumulative Periodogram')
qqnorm(myresid,main='Residual Normal QQ Plot')
qqline(myresid)
par(op)
dev.off()
load(file='createtable')
a<-table.start()
a<-table.row.start(a)
a<-table.element(a,'Estimated Parameters of Exponential Smoothing',2,TRUE)
a<-table.row.end(a)
a<-table.row.start(a)
a<-table.element(a,'Parameter',header=TRUE)
a<-table.element(a,'Value',header=TRUE)
a<-table.row.end(a)
a<-table.row.start(a)
a<-table.element(a,'alpha',header=TRUE)
a<-table.element(a,fit$alpha)
a<-table.row.end(a)
a<-table.row.start(a)
a<-table.element(a,'beta',header=TRUE)
a<-table.element(a,fit$beta)
a<-table.row.end(a)
a<-table.row.start(a)
a<-table.element(a,'gamma',header=TRUE)
a<-table.element(a,fit$gamma)
a<-table.row.end(a)
a<-table.end(a)
table.save(a,file='mytable.tab')
a<-table.start()
a<-table.row.start(a)
a<-table.element(a,'Interpolation Forecasts of Exponential Smoothing',4,TRUE)
a<-table.row.end(a)
a<-table.row.start(a)
a<-table.element(a,'t',header=TRUE)
a<-table.element(a,'Observed',header=TRUE)
a<-table.element(a,'Fitted',header=TRUE)
a<-table.element(a,'Residuals',header=TRUE)
a<-table.row.end(a)
for (i in 1:nxmK) {
a<-table.row.start(a)
a<-table.element(a,i+K,header=TRUE)
a<-table.element(a,x[i+K])
a<-table.element(a,fit$fitted[i,'xhat'])
a<-table.element(a,myresid[i])
a<-table.row.end(a)
}
a<-table.end(a)
table.save(a,file='mytable1.tab')
a<-table.start()
a<-table.row.start(a)
a<-table.element(a,'Extrapolation Forecasts of Exponential Smoothing',4,TRUE)
a<-table.row.end(a)
a<-table.row.start(a)
a<-table.element(a,'t',header=TRUE)
a<-table.element(a,'Forecast',header=TRUE)
a<-table.element(a,'95% Lower Bound',header=TRUE)
a<-table.element(a,'95% Upper Bound',header=TRUE)
a<-table.row.end(a)
for (i in 1:np) {
a<-table.row.start(a)
a<-table.element(a,nx+i,header=TRUE)
a<-table.element(a,p[i,'fit'])
a<-table.element(a,p[i,'lwr'])
a<-table.element(a,p[i,'upr'])
a<-table.row.end(a)
}
a<-table.end(a)
table.save(a,file='mytable2.tab')