Free Statistics

of Irreproducible Research!

Author's title

Author*The author of this computation has been verified*
R Software Modulerwasp_arimabackwardselection.wasp
Title produced by softwareARIMA Backward Selection
Date of computationWed, 21 Dec 2016 13:27:09 +0100
Cite this page as followsStatistical Computations at FreeStatistics.org, Office for Research Development and Education, URL https://freestatistics.org/blog/index.php?v=date/2016/Dec/21/t1482323272tete678onp2z5wa.htm/, Retrieved Mon, 06 May 2024 21:07:25 +0000
Statistical Computations at FreeStatistics.org, Office for Research Development and Education, URL https://freestatistics.org/blog/index.php?pk=302222, Retrieved Mon, 06 May 2024 21:07:25 +0000
QR Codes:

Original text written by user:
IsPrivate?No (this computation is public)
User-defined keywordsN1954
Estimated Impact84
Family? (F = Feedback message, R = changed R code, M = changed R Module, P = changed Parameters, D = changed Data)
-     [ML Fitting and QQ Plot- Normal Distribution] [Normal distribution] [2016-12-15 09:27:42] [061bcad4f8cbfaa4a6cadfe6faec1e5a]
- RMPD  [Chi-Squared Test, McNemar Test, and Fisher Exact Test] [Chisquared simula...] [2016-12-15 10:38:18] [061bcad4f8cbfaa4a6cadfe6faec1e5a]
- RMPD      [ARIMA Backward Selection] [Arima backwards p...] [2016-12-21 12:27:09] [9a9519454d094169f95f881e5b6f16f7] [Current]
Feedback Forum

Post a new message
Dataseries X:
1008
738
1618
824
906
868
890
740
154
756
204
842
642
1016
2012
914
794
1848
736
356
464
386
614
1358
280
756
644
620
650
938
492
274
778
522
688
1336
726
872
1522
1334
990
988
1022
554
910
1110
880
1596
402
1150
1842
1062
886
1436
1440
1156
986
1764
952
1336
618
1286
1768
1366
878
692
1874
780
1460
670
1562
1806
1008
1488
2112
2006
2126
1912
1450
1622
1034
1898
1628
1658
1240
1620
2640
2482
2208
2234
2756
2040
3672
2644
970
2322
2110
4366
2830
3306
3104
4094
3112
2798
2646
2624
2428
3384
2576
2194
3724
4330
3336
4930
3682
3262
4012
3890
5410
3902
3782
5424
5566
4102
2948
5134


Summary of computational transaction
Raw Input view raw input (R code)
Raw Outputview raw output of R engine
Computing time3 seconds
R ServerBig Analytics Cloud Computing Center

\begin{tabular}{lllllllll}
\hline
Summary of computational transaction \tabularnewline
Raw Input view raw input (R code)  \tabularnewline
Raw Outputview raw output of R engine  \tabularnewline
Computing time3 seconds \tabularnewline
R ServerBig Analytics Cloud Computing Center \tabularnewline
\hline
\end{tabular}
%Source: https://freestatistics.org/blog/index.php?pk=302222&T=0

[TABLE]
[ROW]
Summary of computational transaction[/C][/ROW] [ROW]Raw Input[/C] view raw input (R code) [/C][/ROW] [ROW]Raw Output[/C]view raw output of R engine [/C][/ROW] [ROW]Computing time[/C]3 seconds[/C][/ROW] [ROW]R Server[/C]Big Analytics Cloud Computing Center[/C][/ROW] [/TABLE] Source: https://freestatistics.org/blog/index.php?pk=302222&T=0

Globally Unique Identifier (entire table): ba.freestatistics.org/blog/index.php?pk=302222&T=0

As an alternative you can also use a QR Code:  

The GUIDs for individual cells are displayed in the table below:

Summary of computational transaction
Raw Input view raw input (R code)
Raw Outputview raw output of R engine
Computing time3 seconds
R ServerBig Analytics Cloud Computing Center


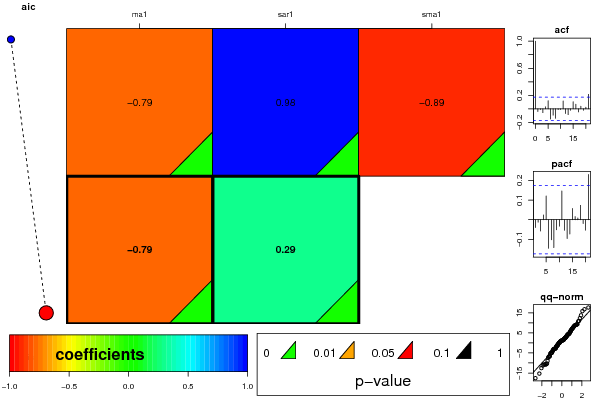
ARIMA Parameter Estimation and Backward Selection
Iterationma1sar1sma1
Estimates ( 1 )-0.79110.9847-0.8888
(p-val)(0 )(0 )(0 )
Estimates ( 2 )-0.7930.28860
(p-val)(0 )(0.0022 )(NA )
Estimates ( 3 )NANANA
(p-val)(NA )(NA )(NA )
Estimates ( 4 )NANANA
(p-val)(NA )(NA )(NA )
Estimates ( 5 )NANANA
(p-val)(NA )(NA )(NA )

\begin{tabular}{lllllllll}
\hline
ARIMA Parameter Estimation and Backward Selection \tabularnewline
Iteration & ma1 & sar1 & sma1 \tabularnewline
Estimates ( 1 ) & -0.7911 & 0.9847 & -0.8888 \tabularnewline
(p-val) & (0 ) & (0 ) & (0 ) \tabularnewline
Estimates ( 2 ) & -0.793 & 0.2886 & 0 \tabularnewline
(p-val) & (0 ) & (0.0022 ) & (NA ) \tabularnewline
Estimates ( 3 ) & NA & NA & NA \tabularnewline
(p-val) & (NA ) & (NA ) & (NA ) \tabularnewline
Estimates ( 4 ) & NA & NA & NA \tabularnewline
(p-val) & (NA ) & (NA ) & (NA ) \tabularnewline
Estimates ( 5 ) & NA & NA & NA \tabularnewline
(p-val) & (NA ) & (NA ) & (NA ) \tabularnewline
\hline
\end{tabular}
%Source: https://freestatistics.org/blog/index.php?pk=302222&T=1

[TABLE]
[ROW][C]ARIMA Parameter Estimation and Backward Selection[/C][/ROW]
[ROW][C]Iteration[/C][C]ma1[/C][C]sar1[/C][C]sma1[/C][/ROW]
[ROW][C]Estimates ( 1 )[/C][C]-0.7911[/C][C]0.9847[/C][C]-0.8888[/C][/ROW]
[ROW][C](p-val)[/C][C](0 )[/C][C](0 )[/C][C](0 )[/C][/ROW]
[ROW][C]Estimates ( 2 )[/C][C]-0.793[/C][C]0.2886[/C][C]0[/C][/ROW]
[ROW][C](p-val)[/C][C](0 )[/C][C](0.0022 )[/C][C](NA )[/C][/ROW]
[ROW][C]Estimates ( 3 )[/C][C]NA[/C][C]NA[/C][C]NA[/C][/ROW]
[ROW][C](p-val)[/C][C](NA )[/C][C](NA )[/C][C](NA )[/C][/ROW]
[ROW][C]Estimates ( 4 )[/C][C]NA[/C][C]NA[/C][C]NA[/C][/ROW]
[ROW][C](p-val)[/C][C](NA )[/C][C](NA )[/C][C](NA )[/C][/ROW]
[ROW][C]Estimates ( 5 )[/C][C]NA[/C][C]NA[/C][C]NA[/C][/ROW]
[ROW][C](p-val)[/C][C](NA )[/C][C](NA )[/C][C](NA )[/C][/ROW]
[/TABLE]
Source: https://freestatistics.org/blog/index.php?pk=302222&T=1

Globally Unique Identifier (entire table): ba.freestatistics.org/blog/index.php?pk=302222&T=1

As an alternative you can also use a QR Code:  

The GUIDs for individual cells are displayed in the table below:

ARIMA Parameter Estimation and Backward Selection
Iterationma1sar1sma1
Estimates ( 1 )-0.79110.9847-0.8888
(p-val)(0 )(0 )(0 )
Estimates ( 2 )-0.7930.28860
(p-val)(0 )(0.0022 )(NA )
Estimates ( 3 )NANANA
(p-val)(NA )(NA )(NA )
Estimates ( 4 )NANANA
(p-val)(NA )(NA )(NA )
Estimates ( 5 )NANANA
(p-val)(NA )(NA )(NA )


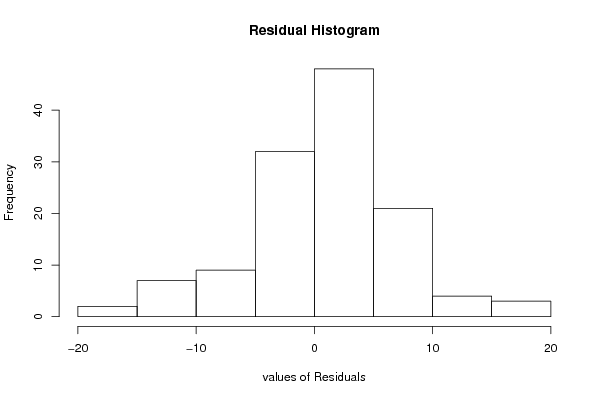
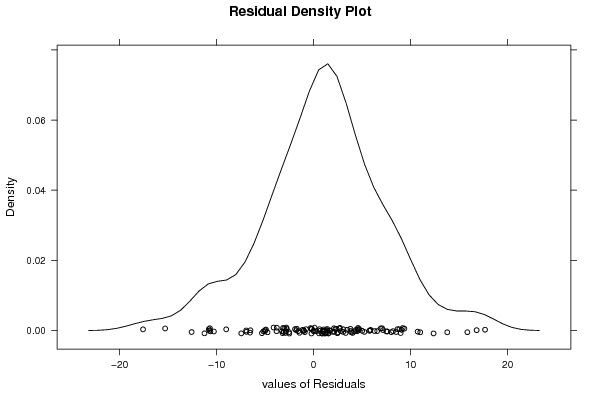
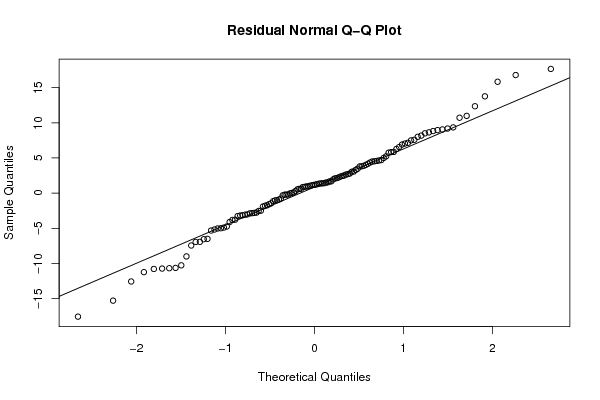
Estimated ARIMA Residuals
Value
0.0317489820900543
-3.14802274189573
8.51401918649891
-3.81746983713967
-1.57783605218059
-1.73271171827429
-1.00739739697872
-3.06880363373119
-15.2987816934668
1.16102950520413
-10.6383571960318
4.49905124595828
-0.221472899722
7.05809444999159
13.7750224225369
0.613570539878215
-1.78906081455095
12.362626081025
-4.9054613829797
-10.734270114393
-1.91417360055755
-7.45227249589818
2.49931530609765
8.97018108261307
-11.2424840969838
0.897309107049519
-6.93272356744717
-0.209824387170091
0.549842950629335
2.14129336352661
-2.85392234643762
-5.17714503026083
9.18964075943841
-0.311985681985324
4.64672433673188
7.58893913738969
1.40118230162113
1.21134918821774
5.86661745796095
6.90501062392641
0.612257191838287
-3.01732602906413
2.4470865289483
-3.188506014777
3.81654445578798
4.70724000645564
0.962804182185924
4.02749449066775
-10.6841320690199
2.65279979832764
5.83724262954937
-1.13924784240028
-2.80701408608852
2.79737014013572
5.74759138623693
4.53103567963242
-0.0259226397552556
8.64808143845346
-2.76524494335542
-3.78429743291607
-6.94716102317399
1.26154746244732
1.53682576431098
1.33719609431431
-4.99531076901796
-10.7925534715881
10.992947657679
-2.53183676919741
7.50616704184739
-9.0059801869921
8.83766866818485
3.07055845746321
-0.186610399962492
1.66808039614415
3.04596214303642
6.28613463263343
8.1876184567985
1.50650543622272
-4.1197866821395
4.17892931025855
-6.50383638775887
5.23807832601885
1.41193017097011
-4.74629553715271
-1.03456827292546
-0.912504608275931
4.57972686547888
6.55890712918551
3.88577159036954
1.3773769900797
7.16126741563174
2.70877535184536
16.8020745101733
2.09883733663493
-17.5756549282144
-2.50067942894703
3.46726466639896
17.6691836405966
-5.0223328977644
4.35848174301533
3.31040751122
9.0629731208988
-0.774594662695039
1.10687814015947
-2.87966915252429
-3.26269041498181
-1.44947914926681
0.949292877970002
0.303370778611936
-10.2706714827209
1.95600289224768
9.35536386056431
1.04284785996841
10.7268227574566
0.103288156675389
0.867725834281402
5.00920111397352
2.35008420416072
15.8465408764838
-5.32510913244462
1.67867723451929
8.01286117178228
2.23686713523489
-6.55483729309455
-12.5722432418171
3.7921016570534

\begin{tabular}{lllllllll}
\hline
Estimated ARIMA Residuals \tabularnewline
Value \tabularnewline
0.0317489820900543 \tabularnewline
-3.14802274189573 \tabularnewline
8.51401918649891 \tabularnewline
-3.81746983713967 \tabularnewline
-1.57783605218059 \tabularnewline
-1.73271171827429 \tabularnewline
-1.00739739697872 \tabularnewline
-3.06880363373119 \tabularnewline
-15.2987816934668 \tabularnewline
1.16102950520413 \tabularnewline
-10.6383571960318 \tabularnewline
4.49905124595828 \tabularnewline
-0.221472899722 \tabularnewline
7.05809444999159 \tabularnewline
13.7750224225369 \tabularnewline
0.613570539878215 \tabularnewline
-1.78906081455095 \tabularnewline
12.362626081025 \tabularnewline
-4.9054613829797 \tabularnewline
-10.734270114393 \tabularnewline
-1.91417360055755 \tabularnewline
-7.45227249589818 \tabularnewline
2.49931530609765 \tabularnewline
8.97018108261307 \tabularnewline
-11.2424840969838 \tabularnewline
0.897309107049519 \tabularnewline
-6.93272356744717 \tabularnewline
-0.209824387170091 \tabularnewline
0.549842950629335 \tabularnewline
2.14129336352661 \tabularnewline
-2.85392234643762 \tabularnewline
-5.17714503026083 \tabularnewline
9.18964075943841 \tabularnewline
-0.311985681985324 \tabularnewline
4.64672433673188 \tabularnewline
7.58893913738969 \tabularnewline
1.40118230162113 \tabularnewline
1.21134918821774 \tabularnewline
5.86661745796095 \tabularnewline
6.90501062392641 \tabularnewline
0.612257191838287 \tabularnewline
-3.01732602906413 \tabularnewline
2.4470865289483 \tabularnewline
-3.188506014777 \tabularnewline
3.81654445578798 \tabularnewline
4.70724000645564 \tabularnewline
0.962804182185924 \tabularnewline
4.02749449066775 \tabularnewline
-10.6841320690199 \tabularnewline
2.65279979832764 \tabularnewline
5.83724262954937 \tabularnewline
-1.13924784240028 \tabularnewline
-2.80701408608852 \tabularnewline
2.79737014013572 \tabularnewline
5.74759138623693 \tabularnewline
4.53103567963242 \tabularnewline
-0.0259226397552556 \tabularnewline
8.64808143845346 \tabularnewline
-2.76524494335542 \tabularnewline
-3.78429743291607 \tabularnewline
-6.94716102317399 \tabularnewline
1.26154746244732 \tabularnewline
1.53682576431098 \tabularnewline
1.33719609431431 \tabularnewline
-4.99531076901796 \tabularnewline
-10.7925534715881 \tabularnewline
10.992947657679 \tabularnewline
-2.53183676919741 \tabularnewline
7.50616704184739 \tabularnewline
-9.0059801869921 \tabularnewline
8.83766866818485 \tabularnewline
3.07055845746321 \tabularnewline
-0.186610399962492 \tabularnewline
1.66808039614415 \tabularnewline
3.04596214303642 \tabularnewline
6.28613463263343 \tabularnewline
8.1876184567985 \tabularnewline
1.50650543622272 \tabularnewline
-4.1197866821395 \tabularnewline
4.17892931025855 \tabularnewline
-6.50383638775887 \tabularnewline
5.23807832601885 \tabularnewline
1.41193017097011 \tabularnewline
-4.74629553715271 \tabularnewline
-1.03456827292546 \tabularnewline
-0.912504608275931 \tabularnewline
4.57972686547888 \tabularnewline
6.55890712918551 \tabularnewline
3.88577159036954 \tabularnewline
1.3773769900797 \tabularnewline
7.16126741563174 \tabularnewline
2.70877535184536 \tabularnewline
16.8020745101733 \tabularnewline
2.09883733663493 \tabularnewline
-17.5756549282144 \tabularnewline
-2.50067942894703 \tabularnewline
3.46726466639896 \tabularnewline
17.6691836405966 \tabularnewline
-5.0223328977644 \tabularnewline
4.35848174301533 \tabularnewline
3.31040751122 \tabularnewline
9.0629731208988 \tabularnewline
-0.774594662695039 \tabularnewline
1.10687814015947 \tabularnewline
-2.87966915252429 \tabularnewline
-3.26269041498181 \tabularnewline
-1.44947914926681 \tabularnewline
0.949292877970002 \tabularnewline
0.303370778611936 \tabularnewline
-10.2706714827209 \tabularnewline
1.95600289224768 \tabularnewline
9.35536386056431 \tabularnewline
1.04284785996841 \tabularnewline
10.7268227574566 \tabularnewline
0.103288156675389 \tabularnewline
0.867725834281402 \tabularnewline
5.00920111397352 \tabularnewline
2.35008420416072 \tabularnewline
15.8465408764838 \tabularnewline
-5.32510913244462 \tabularnewline
1.67867723451929 \tabularnewline
8.01286117178228 \tabularnewline
2.23686713523489 \tabularnewline
-6.55483729309455 \tabularnewline
-12.5722432418171 \tabularnewline
3.7921016570534 \tabularnewline
\hline
\end{tabular}
%Source: https://freestatistics.org/blog/index.php?pk=302222&T=2

[TABLE]
[ROW][C]Estimated ARIMA Residuals[/C][/ROW]
[ROW][C]Value[/C][/ROW]
[ROW][C]0.0317489820900543[/C][/ROW]
[ROW][C]-3.14802274189573[/C][/ROW]
[ROW][C]8.51401918649891[/C][/ROW]
[ROW][C]-3.81746983713967[/C][/ROW]
[ROW][C]-1.57783605218059[/C][/ROW]
[ROW][C]-1.73271171827429[/C][/ROW]
[ROW][C]-1.00739739697872[/C][/ROW]
[ROW][C]-3.06880363373119[/C][/ROW]
[ROW][C]-15.2987816934668[/C][/ROW]
[ROW][C]1.16102950520413[/C][/ROW]
[ROW][C]-10.6383571960318[/C][/ROW]
[ROW][C]4.49905124595828[/C][/ROW]
[ROW][C]-0.221472899722[/C][/ROW]
[ROW][C]7.05809444999159[/C][/ROW]
[ROW][C]13.7750224225369[/C][/ROW]
[ROW][C]0.613570539878215[/C][/ROW]
[ROW][C]-1.78906081455095[/C][/ROW]
[ROW][C]12.362626081025[/C][/ROW]
[ROW][C]-4.9054613829797[/C][/ROW]
[ROW][C]-10.734270114393[/C][/ROW]
[ROW][C]-1.91417360055755[/C][/ROW]
[ROW][C]-7.45227249589818[/C][/ROW]
[ROW][C]2.49931530609765[/C][/ROW]
[ROW][C]8.97018108261307[/C][/ROW]
[ROW][C]-11.2424840969838[/C][/ROW]
[ROW][C]0.897309107049519[/C][/ROW]
[ROW][C]-6.93272356744717[/C][/ROW]
[ROW][C]-0.209824387170091[/C][/ROW]
[ROW][C]0.549842950629335[/C][/ROW]
[ROW][C]2.14129336352661[/C][/ROW]
[ROW][C]-2.85392234643762[/C][/ROW]
[ROW][C]-5.17714503026083[/C][/ROW]
[ROW][C]9.18964075943841[/C][/ROW]
[ROW][C]-0.311985681985324[/C][/ROW]
[ROW][C]4.64672433673188[/C][/ROW]
[ROW][C]7.58893913738969[/C][/ROW]
[ROW][C]1.40118230162113[/C][/ROW]
[ROW][C]1.21134918821774[/C][/ROW]
[ROW][C]5.86661745796095[/C][/ROW]
[ROW][C]6.90501062392641[/C][/ROW]
[ROW][C]0.612257191838287[/C][/ROW]
[ROW][C]-3.01732602906413[/C][/ROW]
[ROW][C]2.4470865289483[/C][/ROW]
[ROW][C]-3.188506014777[/C][/ROW]
[ROW][C]3.81654445578798[/C][/ROW]
[ROW][C]4.70724000645564[/C][/ROW]
[ROW][C]0.962804182185924[/C][/ROW]
[ROW][C]4.02749449066775[/C][/ROW]
[ROW][C]-10.6841320690199[/C][/ROW]
[ROW][C]2.65279979832764[/C][/ROW]
[ROW][C]5.83724262954937[/C][/ROW]
[ROW][C]-1.13924784240028[/C][/ROW]
[ROW][C]-2.80701408608852[/C][/ROW]
[ROW][C]2.79737014013572[/C][/ROW]
[ROW][C]5.74759138623693[/C][/ROW]
[ROW][C]4.53103567963242[/C][/ROW]
[ROW][C]-0.0259226397552556[/C][/ROW]
[ROW][C]8.64808143845346[/C][/ROW]
[ROW][C]-2.76524494335542[/C][/ROW]
[ROW][C]-3.78429743291607[/C][/ROW]
[ROW][C]-6.94716102317399[/C][/ROW]
[ROW][C]1.26154746244732[/C][/ROW]
[ROW][C]1.53682576431098[/C][/ROW]
[ROW][C]1.33719609431431[/C][/ROW]
[ROW][C]-4.99531076901796[/C][/ROW]
[ROW][C]-10.7925534715881[/C][/ROW]
[ROW][C]10.992947657679[/C][/ROW]
[ROW][C]-2.53183676919741[/C][/ROW]
[ROW][C]7.50616704184739[/C][/ROW]
[ROW][C]-9.0059801869921[/C][/ROW]
[ROW][C]8.83766866818485[/C][/ROW]
[ROW][C]3.07055845746321[/C][/ROW]
[ROW][C]-0.186610399962492[/C][/ROW]
[ROW][C]1.66808039614415[/C][/ROW]
[ROW][C]3.04596214303642[/C][/ROW]
[ROW][C]6.28613463263343[/C][/ROW]
[ROW][C]8.1876184567985[/C][/ROW]
[ROW][C]1.50650543622272[/C][/ROW]
[ROW][C]-4.1197866821395[/C][/ROW]
[ROW][C]4.17892931025855[/C][/ROW]
[ROW][C]-6.50383638775887[/C][/ROW]
[ROW][C]5.23807832601885[/C][/ROW]
[ROW][C]1.41193017097011[/C][/ROW]
[ROW][C]-4.74629553715271[/C][/ROW]
[ROW][C]-1.03456827292546[/C][/ROW]
[ROW][C]-0.912504608275931[/C][/ROW]
[ROW][C]4.57972686547888[/C][/ROW]
[ROW][C]6.55890712918551[/C][/ROW]
[ROW][C]3.88577159036954[/C][/ROW]
[ROW][C]1.3773769900797[/C][/ROW]
[ROW][C]7.16126741563174[/C][/ROW]
[ROW][C]2.70877535184536[/C][/ROW]
[ROW][C]16.8020745101733[/C][/ROW]
[ROW][C]2.09883733663493[/C][/ROW]
[ROW][C]-17.5756549282144[/C][/ROW]
[ROW][C]-2.50067942894703[/C][/ROW]
[ROW][C]3.46726466639896[/C][/ROW]
[ROW][C]17.6691836405966[/C][/ROW]
[ROW][C]-5.0223328977644[/C][/ROW]
[ROW][C]4.35848174301533[/C][/ROW]
[ROW][C]3.31040751122[/C][/ROW]
[ROW][C]9.0629731208988[/C][/ROW]
[ROW][C]-0.774594662695039[/C][/ROW]
[ROW][C]1.10687814015947[/C][/ROW]
[ROW][C]-2.87966915252429[/C][/ROW]
[ROW][C]-3.26269041498181[/C][/ROW]
[ROW][C]-1.44947914926681[/C][/ROW]
[ROW][C]0.949292877970002[/C][/ROW]
[ROW][C]0.303370778611936[/C][/ROW]
[ROW][C]-10.2706714827209[/C][/ROW]
[ROW][C]1.95600289224768[/C][/ROW]
[ROW][C]9.35536386056431[/C][/ROW]
[ROW][C]1.04284785996841[/C][/ROW]
[ROW][C]10.7268227574566[/C][/ROW]
[ROW][C]0.103288156675389[/C][/ROW]
[ROW][C]0.867725834281402[/C][/ROW]
[ROW][C]5.00920111397352[/C][/ROW]
[ROW][C]2.35008420416072[/C][/ROW]
[ROW][C]15.8465408764838[/C][/ROW]
[ROW][C]-5.32510913244462[/C][/ROW]
[ROW][C]1.67867723451929[/C][/ROW]
[ROW][C]8.01286117178228[/C][/ROW]
[ROW][C]2.23686713523489[/C][/ROW]
[ROW][C]-6.55483729309455[/C][/ROW]
[ROW][C]-12.5722432418171[/C][/ROW]
[ROW][C]3.7921016570534[/C][/ROW]
[/TABLE]
Source: https://freestatistics.org/blog/index.php?pk=302222&T=2

Globally Unique Identifier (entire table): ba.freestatistics.org/blog/index.php?pk=302222&T=2

As an alternative you can also use a QR Code:  

The GUIDs for individual cells are displayed in the table below:

Estimated ARIMA Residuals
Value
0.0317489820900543
-3.14802274189573
8.51401918649891
-3.81746983713967
-1.57783605218059
-1.73271171827429
-1.00739739697872
-3.06880363373119
-15.2987816934668
1.16102950520413
-10.6383571960318
4.49905124595828
-0.221472899722
7.05809444999159
13.7750224225369
0.613570539878215
-1.78906081455095
12.362626081025
-4.9054613829797
-10.734270114393
-1.91417360055755
-7.45227249589818
2.49931530609765
8.97018108261307
-11.2424840969838
0.897309107049519
-6.93272356744717
-0.209824387170091
0.549842950629335
2.14129336352661
-2.85392234643762
-5.17714503026083
9.18964075943841
-0.311985681985324
4.64672433673188
7.58893913738969
1.40118230162113
1.21134918821774
5.86661745796095
6.90501062392641
0.612257191838287
-3.01732602906413
2.4470865289483
-3.188506014777
3.81654445578798
4.70724000645564
0.962804182185924
4.02749449066775
-10.6841320690199
2.65279979832764
5.83724262954937
-1.13924784240028
-2.80701408608852
2.79737014013572
5.74759138623693
4.53103567963242
-0.0259226397552556
8.64808143845346
-2.76524494335542
-3.78429743291607
-6.94716102317399
1.26154746244732
1.53682576431098
1.33719609431431
-4.99531076901796
-10.7925534715881
10.992947657679
-2.53183676919741
7.50616704184739
-9.0059801869921
8.83766866818485
3.07055845746321
-0.186610399962492
1.66808039614415
3.04596214303642
6.28613463263343
8.1876184567985
1.50650543622272
-4.1197866821395
4.17892931025855
-6.50383638775887
5.23807832601885
1.41193017097011
-4.74629553715271
-1.03456827292546
-0.912504608275931
4.57972686547888
6.55890712918551
3.88577159036954
1.3773769900797
7.16126741563174
2.70877535184536
16.8020745101733
2.09883733663493
-17.5756549282144
-2.50067942894703
3.46726466639896
17.6691836405966
-5.0223328977644
4.35848174301533
3.31040751122
9.0629731208988
-0.774594662695039
1.10687814015947
-2.87966915252429
-3.26269041498181
-1.44947914926681
0.949292877970002
0.303370778611936
-10.2706714827209
1.95600289224768
9.35536386056431
1.04284785996841
10.7268227574566
0.103288156675389
0.867725834281402
5.00920111397352
2.35008420416072
15.8465408764838
-5.32510913244462
1.67867723451929
8.01286117178228
2.23686713523489
-6.55483729309455
-12.5722432418171
3.7921016570534


Parameters (Session):
par1 = 12 ;
Parameters (R input):
par1 = 12 ; par2 = 0.5 ; par3 = 1 ; par4 = 0 ; par5 = 12 ; par6 = 0 ; par7 = 1 ; par8 = 1 ; par9 = 1 ;
R code (references can be found in the software module):
library(lattice)
if (par1 == 'TRUE') par1 <- TRUE
if (par1 == 'FALSE') par1 <- FALSE
par2 <- as.numeric(par2) #Box-Cox lambda transformation parameter
par3 <- as.numeric(par3) #degree of non-seasonal differencing
par4 <- as.numeric(par4) #degree of seasonal differencing
par5 <- as.numeric(par5) #seasonal period
par6 <- as.numeric(par6) #degree (p) of the non-seasonal AR(p) polynomial
par7 <- as.numeric(par7) #degree (q) of the non-seasonal MA(q) polynomial
par8 <- as.numeric(par8) #degree (P) of the seasonal AR(P) polynomial
par9 <- as.numeric(par9) #degree (Q) of the seasonal MA(Q) polynomial
armaGR <- function(arima.out, names, n){
try1 <- arima.out$coef
try2 <- sqrt(diag(arima.out$var.coef))
try.data.frame <- data.frame(matrix(NA,ncol=4,nrow=length(names)))
dimnames(try.data.frame) <- list(names,c('coef','std','tstat','pv'))
try.data.frame[,1] <- try1
for(i in 1:length(try2)) try.data.frame[which(rownames(try.data.frame)==names(try2)[i]),2] <- try2[i]
try.data.frame[,3] <- try.data.frame[,1] / try.data.frame[,2]
try.data.frame[,4] <- round((1-pt(abs(try.data.frame[,3]),df=n-(length(try2)+1)))*2,5)
vector <- rep(NA,length(names))
vector[is.na(try.data.frame[,4])] <- 0
maxi <- which.max(try.data.frame[,4])
continue <- max(try.data.frame[,4],na.rm=TRUE) > .05
vector[maxi] <- 0
list(summary=try.data.frame,next.vector=vector,continue=continue)
}
arimaSelect <- function(series, order=c(13,0,0), seasonal=list(order=c(2,0,0),period=12), include.mean=F){
nrc <- order[1]+order[3]+seasonal$order[1]+seasonal$order[3]
coeff <- matrix(NA, nrow=nrc*2, ncol=nrc)
pval <- matrix(NA, nrow=nrc*2, ncol=nrc)
mylist <- rep(list(NULL), nrc)
names <- NULL
if(order[1] > 0) names <- paste('ar',1:order[1],sep='')
if(order[3] > 0) names <- c( names , paste('ma',1:order[3],sep='') )
if(seasonal$order[1] > 0) names <- c(names, paste('sar',1:seasonal$order[1],sep=''))
if(seasonal$order[3] > 0) names <- c(names, paste('sma',1:seasonal$order[3],sep=''))
arima.out <- arima(series, order=order, seasonal=seasonal, include.mean=include.mean, method='ML')
mylist[[1]] <- arima.out
last.arma <- armaGR(arima.out, names, length(series))
mystop <- FALSE
i <- 1
coeff[i,] <- last.arma[[1]][,1]
pval [i,] <- last.arma[[1]][,4]
i <- 2
aic <- arima.out$aic
while(!mystop){
mylist[[i]] <- arima.out
arima.out <- arima(series, order=order, seasonal=seasonal, include.mean=include.mean, method='ML', fixed=last.arma$next.vector)
aic <- c(aic, arima.out$aic)
last.arma <- armaGR(arima.out, names, length(series))
mystop <- !last.arma$continue
coeff[i,] <- last.arma[[1]][,1]
pval [i,] <- last.arma[[1]][,4]
i <- i+1
}
list(coeff, pval, mylist, aic=aic)
}
arimaSelectplot <- function(arimaSelect.out,noms,choix){
noms <- names(arimaSelect.out[[3]][[1]]$coef)
coeff <- arimaSelect.out[[1]]
k <- min(which(is.na(coeff[,1])))-1
coeff <- coeff[1:k,]
pval <- arimaSelect.out[[2]][1:k,]
aic <- arimaSelect.out$aic[1:k]
coeff[coeff==0] <- NA
n <- ncol(coeff)
if(missing(choix)) choix <- k
layout(matrix(c(1,1,1,2,
3,3,3,2,
3,3,3,4,
5,6,7,7),nr=4),
widths=c(10,35,45,15),
heights=c(30,30,15,15))
couleurs <- rainbow(75)[1:50]#(50)
ticks <- pretty(coeff)
par(mar=c(1,1,3,1))
plot(aic,k:1-.5,type='o',pch=21,bg='blue',cex=2,axes=F,lty=2,xpd=NA)
points(aic[choix],k-choix+.5,pch=21,cex=4,bg=2,xpd=NA)
title('aic',line=2)
par(mar=c(3,0,0,0))
plot(0,axes=F,xlab='',ylab='',xlim=range(ticks),ylim=c(.1,1))
rect(xleft = min(ticks) + (0:49)/50*(max(ticks)-min(ticks)),
xright = min(ticks) + (1:50)/50*(max(ticks)-min(ticks)),
ytop = rep(1,50),
ybottom= rep(0,50),col=couleurs,border=NA)
axis(1,ticks)
rect(xleft=min(ticks),xright=max(ticks),ytop=1,ybottom=0)
text(mean(coeff,na.rm=T),.5,'coefficients',cex=2,font=2)
par(mar=c(1,1,3,1))
image(1:n,1:k,t(coeff[k:1,]),axes=F,col=couleurs,zlim=range(ticks))
for(i in 1:n) for(j in 1:k) if(!is.na(coeff[j,i])) {
if(pval[j,i]<.01) symb = 'green'
else if( (pval[j,i]<.05) & (pval[j,i]>=.01)) symb = 'orange'
else if( (pval[j,i]<.1) & (pval[j,i]>=.05)) symb = 'red'
else symb = 'black'
polygon(c(i+.5 ,i+.2 ,i+.5 ,i+.5),
c(k-j+0.5,k-j+0.5,k-j+0.8,k-j+0.5),
col=symb)
if(j==choix) {
rect(xleft=i-.5,
xright=i+.5,
ybottom=k-j+1.5,
ytop=k-j+.5,
lwd=4)
text(i,
k-j+1,
round(coeff[j,i],2),
cex=1.2,
font=2)
}
else{
rect(xleft=i-.5,xright=i+.5,ybottom=k-j+1.5,ytop=k-j+.5)
text(i,k-j+1,round(coeff[j,i],2),cex=1.2,font=1)
}
}
axis(3,1:n,noms)
par(mar=c(0.5,0,0,0.5))
plot(0,axes=F,xlab='',ylab='',type='n',xlim=c(0,8),ylim=c(-.2,.8))
cols <- c('green','orange','red','black')
niv <- c('0','0.01','0.05','0.1')
for(i in 0:3){
polygon(c(1+2*i ,1+2*i ,1+2*i-.5 ,1+2*i),
c(.4 ,.7 , .4 , .4),
col=cols[i+1])
text(2*i,0.5,niv[i+1],cex=1.5)
}
text(8,.5,1,cex=1.5)
text(4,0,'p-value',cex=2)
box()
residus <- arimaSelect.out[[3]][[choix]]$res
par(mar=c(1,2,4,1))
acf(residus,main='')
title('acf',line=.5)
par(mar=c(1,2,4,1))
pacf(residus,main='')
title('pacf',line=.5)
par(mar=c(2,2,4,1))
qqnorm(residus,main='')
title('qq-norm',line=.5)
qqline(residus)
residus
}
if (par2 == 0) x <- log(x)
if (par2 != 0) x <- x^par2
(selection <- arimaSelect(x, order=c(par6,par3,par7), seasonal=list(order=c(par8,par4,par9), period=par5)))
bitmap(file='test1.png')
resid <- arimaSelectplot(selection)
dev.off()
resid
bitmap(file='test2.png')
acf(resid,length(resid)/2, main='Residual Autocorrelation Function')
dev.off()
bitmap(file='test3.png')
pacf(resid,length(resid)/2, main='Residual Partial Autocorrelation Function')
dev.off()
bitmap(file='test4.png')
cpgram(resid, main='Residual Cumulative Periodogram')
dev.off()
bitmap(file='test5.png')
hist(resid, main='Residual Histogram', xlab='values of Residuals')
dev.off()
bitmap(file='test6.png')
densityplot(~resid,col='black',main='Residual Density Plot', xlab='values of Residuals')
dev.off()
bitmap(file='test7.png')
qqnorm(resid, main='Residual Normal Q-Q Plot')
qqline(resid)
dev.off()
ncols <- length(selection[[1]][1,])
nrows <- length(selection[[2]][,1])-1
load(file='createtable')
a<-table.start()
a<-table.row.start(a)
a<-table.element(a,'ARIMA Parameter Estimation and Backward Selection', ncols+1,TRUE)
a<-table.row.end(a)
a<-table.row.start(a)
a<-table.element(a,'Iteration', header=TRUE)
for (i in 1:ncols) {
a<-table.element(a,names(selection[[3]][[1]]$coef)[i],header=TRUE)
}
a<-table.row.end(a)
for (j in 1:nrows) {
a<-table.row.start(a)
mydum <- 'Estimates ('
mydum <- paste(mydum,j)
mydum <- paste(mydum,')')
a<-table.element(a,mydum, header=TRUE)
for (i in 1:ncols) {
a<-table.element(a,round(selection[[1]][j,i],4))
}
a<-table.row.end(a)
a<-table.row.start(a)
a<-table.element(a,'(p-val)', header=TRUE)
for (i in 1:ncols) {
mydum <- '('
mydum <- paste(mydum,round(selection[[2]][j,i],4),sep='')
mydum <- paste(mydum,')')
a<-table.element(a,mydum)
}
a<-table.row.end(a)
}
a<-table.end(a)
table.save(a,file='mytable.tab')
a<-table.start()
a<-table.row.start(a)
a<-table.element(a,'Estimated ARIMA Residuals', 1,TRUE)
a<-table.row.end(a)
a<-table.row.start(a)
a<-table.element(a,'Value', 1,TRUE)
a<-table.row.end(a)
for (i in (par4*par5+par3):length(resid)) {
a<-table.row.start(a)
a<-table.element(a,resid[i])
a<-table.row.end(a)
}
a<-table.end(a)
table.save(a,file='mytable1.tab')