Free Statistics

of Irreproducible Research!

Author's title

Author*The author of this computation has been verified*
R Software Modulerwasp_arimaforecasting.wasp
Title produced by softwareARIMA Forecasting
Date of computationWed, 21 Dec 2016 13:29:45 +0100
Cite this page as followsStatistical Computations at FreeStatistics.org, Office for Research Development and Education, URL https://freestatistics.org/blog/index.php?v=date/2016/Dec/21/t14823234185p5eae1qnyrm4nr.htm/, Retrieved Mon, 06 May 2024 18:27:42 +0000
Statistical Computations at FreeStatistics.org, Office for Research Development and Education, URL https://freestatistics.org/blog/index.php?pk=302225, Retrieved Mon, 06 May 2024 18:27:42 +0000
QR Codes:

Original text written by user:
IsPrivate?No (this computation is public)
User-defined keywordsN1964
Estimated Impact96
Family? (F = Feedback message, R = changed R code, M = changed R Module, P = changed Parameters, D = changed Data)
-     [ML Fitting and QQ Plot- Normal Distribution] [Normal distribution] [2016-12-15 09:27:42] [061bcad4f8cbfaa4a6cadfe6faec1e5a]
- RMPD  [Chi-Squared Test, McNemar Test, and Fisher Exact Test] [Chisquared simula...] [2016-12-15 10:38:18] [061bcad4f8cbfaa4a6cadfe6faec1e5a]
- RMPD      [ARIMA Forecasting] [ARIMA forecasting ] [2016-12-21 12:29:45] [9a9519454d094169f95f881e5b6f16f7] [Current]
Feedback Forum

Post a new message
Dataseries X:
1008
738
1618
824
906
868
890
740
154
756
204
842
642
1016
2012
914
794
1848
736
356
464
386
614
1358
280
756
644
620
650
938
492
274
778
522
688
1336
726
872
1522
1334
990
988
1022
554
910
1110
880
1596
402
1150
1842
1062
886
1436
1440
1156
986
1764
952
1336
618
1286
1768
1366
878
692
1874
780
1460
670
1562
1806
1008
1488
2112
2006
2126
1912
1450
1622
1034
1898
1628
1658
1240
1620
2640
2482
2208
2234
2756
2040
3672
2644
970
2322
2110
4366
2830
3306
3104
4094
3112
2798
2646
2624
2428
3384
2576
2194
3724
4330
3336
4930
3682
3262
4012
3890
5410
3902
3782
5424
5566
4102
2948
5134


Summary of computational transaction
Raw Input view raw input (R code)
Raw Outputview raw output of R engine
Computing time1 seconds
R ServerBig Analytics Cloud Computing Center

\begin{tabular}{lllllllll}
\hline
Summary of computational transaction \tabularnewline
Raw Input view raw input (R code)  \tabularnewline
Raw Outputview raw output of R engine  \tabularnewline
Computing time1 seconds \tabularnewline
R ServerBig Analytics Cloud Computing Center \tabularnewline
\hline
\end{tabular}
%Source: https://freestatistics.org/blog/index.php?pk=302225&T=0

[TABLE]
[ROW]
Summary of computational transaction[/C][/ROW] [ROW]Raw Input[/C] view raw input (R code) [/C][/ROW] [ROW]Raw Output[/C]view raw output of R engine [/C][/ROW] [ROW]Computing time[/C]1 seconds[/C][/ROW] [ROW]R Server[/C]Big Analytics Cloud Computing Center[/C][/ROW] [/TABLE] Source: https://freestatistics.org/blog/index.php?pk=302225&T=0

Globally Unique Identifier (entire table): ba.freestatistics.org/blog/index.php?pk=302225&T=0

As an alternative you can also use a QR Code:  

The GUIDs for individual cells are displayed in the table below:

Summary of computational transaction
Raw Input view raw input (R code)
Raw Outputview raw output of R engine
Computing time1 seconds
R ServerBig Analytics Cloud Computing Center


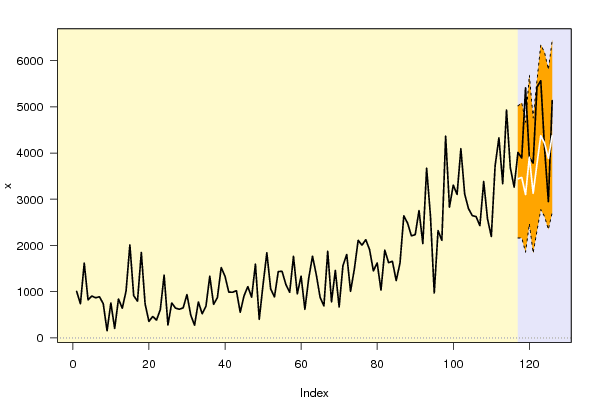
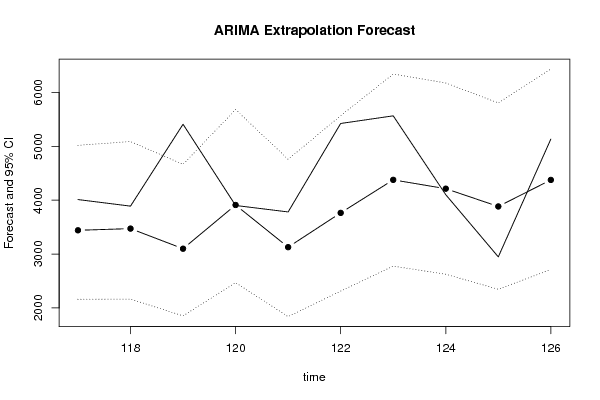
Univariate ARIMA Extrapolation Forecast
timeY[t]F[t]95% LB95% UBp-value(H0: Y[t] = F[t])P(F[t]>Y[t-1])P(F[t]>Y[t-s])P(F[t]>Y[116])
1042798-------
1052646-------
1062624-------
1072428-------
1083384-------
1092576-------
1102194-------
1113724-------
1124330-------
1133336-------
1144930-------
1153682-------
1163262-------
11740123441.18972160.56085018.51460.23910.58810.83850.5881
11838903472.62032164.4595088.55950.30630.25650.84830.6008
11954103099.59521853.08364664.96640.00190.16120.79980.4194
12039023910.93362469.43075682.37770.49610.04860.72010.7636
12137823128.0251838.27074758.57690.21590.17610.74650.436
12254243764.7682313.01445568.38340.03570.49250.95610.7076
12355664377.63362776.5386341.65540.11780.14820.74290.8672
12441024213.61962625.31016175.91950.45560.08840.45370.8291
12529483883.55112346.69735805.45960.170.41190.71170.7369
12651344376.21592712.28616436.26470.23550.91290.29910.8555

\begin{tabular}{lllllllll}
\hline
Univariate ARIMA Extrapolation Forecast \tabularnewline
time & Y[t] & F[t] & 95% LB & 95% UB & p-value(H0: Y[t] = F[t]) & P(F[t]>Y[t-1]) & P(F[t]>Y[t-s]) & P(F[t]>Y[116]) \tabularnewline
104 & 2798 & - & - & - & - & - & - & - \tabularnewline
105 & 2646 & - & - & - & - & - & - & - \tabularnewline
106 & 2624 & - & - & - & - & - & - & - \tabularnewline
107 & 2428 & - & - & - & - & - & - & - \tabularnewline
108 & 3384 & - & - & - & - & - & - & - \tabularnewline
109 & 2576 & - & - & - & - & - & - & - \tabularnewline
110 & 2194 & - & - & - & - & - & - & - \tabularnewline
111 & 3724 & - & - & - & - & - & - & - \tabularnewline
112 & 4330 & - & - & - & - & - & - & - \tabularnewline
113 & 3336 & - & - & - & - & - & - & - \tabularnewline
114 & 4930 & - & - & - & - & - & - & - \tabularnewline
115 & 3682 & - & - & - & - & - & - & - \tabularnewline
116 & 3262 & - & - & - & - & - & - & - \tabularnewline
117 & 4012 & 3441.1897 & 2160.5608 & 5018.5146 & 0.2391 & 0.5881 & 0.8385 & 0.5881 \tabularnewline
118 & 3890 & 3472.6203 & 2164.459 & 5088.5595 & 0.3063 & 0.2565 & 0.8483 & 0.6008 \tabularnewline
119 & 5410 & 3099.5952 & 1853.0836 & 4664.9664 & 0.0019 & 0.1612 & 0.7998 & 0.4194 \tabularnewline
120 & 3902 & 3910.9336 & 2469.4307 & 5682.3777 & 0.4961 & 0.0486 & 0.7201 & 0.7636 \tabularnewline
121 & 3782 & 3128.025 & 1838.2707 & 4758.5769 & 0.2159 & 0.1761 & 0.7465 & 0.436 \tabularnewline
122 & 5424 & 3764.768 & 2313.0144 & 5568.3834 & 0.0357 & 0.4925 & 0.9561 & 0.7076 \tabularnewline
123 & 5566 & 4377.6336 & 2776.538 & 6341.6554 & 0.1178 & 0.1482 & 0.7429 & 0.8672 \tabularnewline
124 & 4102 & 4213.6196 & 2625.3101 & 6175.9195 & 0.4556 & 0.0884 & 0.4537 & 0.8291 \tabularnewline
125 & 2948 & 3883.5511 & 2346.6973 & 5805.4596 & 0.17 & 0.4119 & 0.7117 & 0.7369 \tabularnewline
126 & 5134 & 4376.2159 & 2712.2861 & 6436.2647 & 0.2355 & 0.9129 & 0.2991 & 0.8555 \tabularnewline
\hline
\end{tabular}
%Source: https://freestatistics.org/blog/index.php?pk=302225&T=1

[TABLE]
[ROW][C]Univariate ARIMA Extrapolation Forecast[/C][/ROW]
[ROW][C]time[/C][C]Y[t][/C][C]F[t][/C][C]95% LB[/C][C]95% UB[/C][C]p-value(H0: Y[t] = F[t])[/C][C]P(F[t]>Y[t-1])[/C][C]P(F[t]>Y[t-s])[/C][C]P(F[t]>Y[116])[/C][/ROW]
[ROW][C]104[/C][C]2798[/C][C]-[/C][C]-[/C][C]-[/C][C]-[/C][C]-[/C][C]-[/C][C]-[/C][/ROW]
[ROW][C]105[/C][C]2646[/C][C]-[/C][C]-[/C][C]-[/C][C]-[/C][C]-[/C][C]-[/C][C]-[/C][/ROW]
[ROW][C]106[/C][C]2624[/C][C]-[/C][C]-[/C][C]-[/C][C]-[/C][C]-[/C][C]-[/C][C]-[/C][/ROW]
[ROW][C]107[/C][C]2428[/C][C]-[/C][C]-[/C][C]-[/C][C]-[/C][C]-[/C][C]-[/C][C]-[/C][/ROW]
[ROW][C]108[/C][C]3384[/C][C]-[/C][C]-[/C][C]-[/C][C]-[/C][C]-[/C][C]-[/C][C]-[/C][/ROW]
[ROW][C]109[/C][C]2576[/C][C]-[/C][C]-[/C][C]-[/C][C]-[/C][C]-[/C][C]-[/C][C]-[/C][/ROW]
[ROW][C]110[/C][C]2194[/C][C]-[/C][C]-[/C][C]-[/C][C]-[/C][C]-[/C][C]-[/C][C]-[/C][/ROW]
[ROW][C]111[/C][C]3724[/C][C]-[/C][C]-[/C][C]-[/C][C]-[/C][C]-[/C][C]-[/C][C]-[/C][/ROW]
[ROW][C]112[/C][C]4330[/C][C]-[/C][C]-[/C][C]-[/C][C]-[/C][C]-[/C][C]-[/C][C]-[/C][/ROW]
[ROW][C]113[/C][C]3336[/C][C]-[/C][C]-[/C][C]-[/C][C]-[/C][C]-[/C][C]-[/C][C]-[/C][/ROW]
[ROW][C]114[/C][C]4930[/C][C]-[/C][C]-[/C][C]-[/C][C]-[/C][C]-[/C][C]-[/C][C]-[/C][/ROW]
[ROW][C]115[/C][C]3682[/C][C]-[/C][C]-[/C][C]-[/C][C]-[/C][C]-[/C][C]-[/C][C]-[/C][/ROW]
[ROW][C]116[/C][C]3262[/C][C]-[/C][C]-[/C][C]-[/C][C]-[/C][C]-[/C][C]-[/C][C]-[/C][/ROW]
[ROW][C]117[/C][C]4012[/C][C]3441.1897[/C][C]2160.5608[/C][C]5018.5146[/C][C]0.2391[/C][C]0.5881[/C][C]0.8385[/C][C]0.5881[/C][/ROW]
[ROW][C]118[/C][C]3890[/C][C]3472.6203[/C][C]2164.459[/C][C]5088.5595[/C][C]0.3063[/C][C]0.2565[/C][C]0.8483[/C][C]0.6008[/C][/ROW]
[ROW][C]119[/C][C]5410[/C][C]3099.5952[/C][C]1853.0836[/C][C]4664.9664[/C][C]0.0019[/C][C]0.1612[/C][C]0.7998[/C][C]0.4194[/C][/ROW]
[ROW][C]120[/C][C]3902[/C][C]3910.9336[/C][C]2469.4307[/C][C]5682.3777[/C][C]0.4961[/C][C]0.0486[/C][C]0.7201[/C][C]0.7636[/C][/ROW]
[ROW][C]121[/C][C]3782[/C][C]3128.025[/C][C]1838.2707[/C][C]4758.5769[/C][C]0.2159[/C][C]0.1761[/C][C]0.7465[/C][C]0.436[/C][/ROW]
[ROW][C]122[/C][C]5424[/C][C]3764.768[/C][C]2313.0144[/C][C]5568.3834[/C][C]0.0357[/C][C]0.4925[/C][C]0.9561[/C][C]0.7076[/C][/ROW]
[ROW][C]123[/C][C]5566[/C][C]4377.6336[/C][C]2776.538[/C][C]6341.6554[/C][C]0.1178[/C][C]0.1482[/C][C]0.7429[/C][C]0.8672[/C][/ROW]
[ROW][C]124[/C][C]4102[/C][C]4213.6196[/C][C]2625.3101[/C][C]6175.9195[/C][C]0.4556[/C][C]0.0884[/C][C]0.4537[/C][C]0.8291[/C][/ROW]
[ROW][C]125[/C][C]2948[/C][C]3883.5511[/C][C]2346.6973[/C][C]5805.4596[/C][C]0.17[/C][C]0.4119[/C][C]0.7117[/C][C]0.7369[/C][/ROW]
[ROW][C]126[/C][C]5134[/C][C]4376.2159[/C][C]2712.2861[/C][C]6436.2647[/C][C]0.2355[/C][C]0.9129[/C][C]0.2991[/C][C]0.8555[/C][/ROW]
[/TABLE]
Source: https://freestatistics.org/blog/index.php?pk=302225&T=1

Globally Unique Identifier (entire table): ba.freestatistics.org/blog/index.php?pk=302225&T=1

As an alternative you can also use a QR Code:  

The GUIDs for individual cells are displayed in the table below:

Univariate ARIMA Extrapolation Forecast
timeY[t]F[t]95% LB95% UBp-value(H0: Y[t] = F[t])P(F[t]>Y[t-1])P(F[t]>Y[t-s])P(F[t]>Y[116])
1042798-------
1052646-------
1062624-------
1072428-------
1083384-------
1092576-------
1102194-------
1113724-------
1124330-------
1133336-------
1144930-------
1153682-------
1163262-------
11740123441.18972160.56085018.51460.23910.58810.83850.5881
11838903472.62032164.4595088.55950.30630.25650.84830.6008
11954103099.59521853.08364664.96640.00190.16120.79980.4194
12039023910.93362469.43075682.37770.49610.04860.72010.7636
12137823128.0251838.27074758.57690.21590.17610.74650.436
12254243764.7682313.01445568.38340.03570.49250.95610.7076
12355664377.63362776.5386341.65540.11780.14820.74290.8672
12441024213.61962625.31016175.91950.45560.08840.45370.8291
12529483883.55112346.69735805.45960.170.41190.71170.7369
12651344376.21592712.28616436.26470.23550.91290.29910.8555


Univariate ARIMA Extrapolation Forecast Performance
time% S.E.PEMAPEsMAPESq.EMSERMSEScaledEMASE
1170.23390.14230.14230.1532325824.3947000.52110.5211
1180.23740.10730.12480.1333174205.7836250015.0892500.01510.38110.4511
1190.25770.42710.22550.26995337970.27491946000.15111394.99112.10931.0038
1200.2311-0.00230.16970.20379.80881459520.06551208.106-0.00820.7549
1210.2660.17290.17040.2002427683.27591253152.70761119.4430.59710.7233
1220.24440.30590.1930.2272753050.86961503135.73461226.02441.51480.8553
1230.22890.21350.19590.22881412214.59761490147.00071220.71581.08490.8881
1240.2376-0.02720.17480.203512458.9361305435.99261142.5568-0.10190.7898
1250.2525-0.31740.19060.2113875255.87341257638.20161121.4447-0.85410.7969
1260.24020.14760.18630.2061574236.69911189298.05141090.54940.69180.7864

\begin{tabular}{lllllllll}
\hline
Univariate ARIMA Extrapolation Forecast Performance \tabularnewline
time & % S.E. & PE & MAPE & sMAPE & Sq.E & MSE & RMSE & ScaledE & MASE \tabularnewline
117 & 0.2339 & 0.1423 & 0.1423 & 0.1532 & 325824.3947 & 0 & 0 & 0.5211 & 0.5211 \tabularnewline
118 & 0.2374 & 0.1073 & 0.1248 & 0.1333 & 174205.7836 & 250015.0892 & 500.0151 & 0.3811 & 0.4511 \tabularnewline
119 & 0.2577 & 0.4271 & 0.2255 & 0.2699 & 5337970.2749 & 1946000.1511 & 1394.9911 & 2.1093 & 1.0038 \tabularnewline
120 & 0.2311 & -0.0023 & 0.1697 & 0.203 & 79.8088 & 1459520.0655 & 1208.106 & -0.0082 & 0.7549 \tabularnewline
121 & 0.266 & 0.1729 & 0.1704 & 0.2002 & 427683.2759 & 1253152.7076 & 1119.443 & 0.5971 & 0.7233 \tabularnewline
122 & 0.2444 & 0.3059 & 0.193 & 0.227 & 2753050.8696 & 1503135.7346 & 1226.0244 & 1.5148 & 0.8553 \tabularnewline
123 & 0.2289 & 0.2135 & 0.1959 & 0.2288 & 1412214.5976 & 1490147.0007 & 1220.7158 & 1.0849 & 0.8881 \tabularnewline
124 & 0.2376 & -0.0272 & 0.1748 & 0.2035 & 12458.936 & 1305435.9926 & 1142.5568 & -0.1019 & 0.7898 \tabularnewline
125 & 0.2525 & -0.3174 & 0.1906 & 0.2113 & 875255.8734 & 1257638.2016 & 1121.4447 & -0.8541 & 0.7969 \tabularnewline
126 & 0.2402 & 0.1476 & 0.1863 & 0.2061 & 574236.6991 & 1189298.0514 & 1090.5494 & 0.6918 & 0.7864 \tabularnewline
\hline
\end{tabular}
%Source: https://freestatistics.org/blog/index.php?pk=302225&T=2

[TABLE]
[ROW][C]Univariate ARIMA Extrapolation Forecast Performance[/C][/ROW]
[ROW][C]time[/C][C]% S.E.[/C][C]PE[/C][C]MAPE[/C][C]sMAPE[/C][C]Sq.E[/C][C]MSE[/C][C]RMSE[/C][C]ScaledE[/C][C]MASE[/C][/ROW]
[ROW][C]117[/C][C]0.2339[/C][C]0.1423[/C][C]0.1423[/C][C]0.1532[/C][C]325824.3947[/C][C]0[/C][C]0[/C][C]0.5211[/C][C]0.5211[/C][/ROW]
[ROW][C]118[/C][C]0.2374[/C][C]0.1073[/C][C]0.1248[/C][C]0.1333[/C][C]174205.7836[/C][C]250015.0892[/C][C]500.0151[/C][C]0.3811[/C][C]0.4511[/C][/ROW]
[ROW][C]119[/C][C]0.2577[/C][C]0.4271[/C][C]0.2255[/C][C]0.2699[/C][C]5337970.2749[/C][C]1946000.1511[/C][C]1394.9911[/C][C]2.1093[/C][C]1.0038[/C][/ROW]
[ROW][C]120[/C][C]0.2311[/C][C]-0.0023[/C][C]0.1697[/C][C]0.203[/C][C]79.8088[/C][C]1459520.0655[/C][C]1208.106[/C][C]-0.0082[/C][C]0.7549[/C][/ROW]
[ROW][C]121[/C][C]0.266[/C][C]0.1729[/C][C]0.1704[/C][C]0.2002[/C][C]427683.2759[/C][C]1253152.7076[/C][C]1119.443[/C][C]0.5971[/C][C]0.7233[/C][/ROW]
[ROW][C]122[/C][C]0.2444[/C][C]0.3059[/C][C]0.193[/C][C]0.227[/C][C]2753050.8696[/C][C]1503135.7346[/C][C]1226.0244[/C][C]1.5148[/C][C]0.8553[/C][/ROW]
[ROW][C]123[/C][C]0.2289[/C][C]0.2135[/C][C]0.1959[/C][C]0.2288[/C][C]1412214.5976[/C][C]1490147.0007[/C][C]1220.7158[/C][C]1.0849[/C][C]0.8881[/C][/ROW]
[ROW][C]124[/C][C]0.2376[/C][C]-0.0272[/C][C]0.1748[/C][C]0.2035[/C][C]12458.936[/C][C]1305435.9926[/C][C]1142.5568[/C][C]-0.1019[/C][C]0.7898[/C][/ROW]
[ROW][C]125[/C][C]0.2525[/C][C]-0.3174[/C][C]0.1906[/C][C]0.2113[/C][C]875255.8734[/C][C]1257638.2016[/C][C]1121.4447[/C][C]-0.8541[/C][C]0.7969[/C][/ROW]
[ROW][C]126[/C][C]0.2402[/C][C]0.1476[/C][C]0.1863[/C][C]0.2061[/C][C]574236.6991[/C][C]1189298.0514[/C][C]1090.5494[/C][C]0.6918[/C][C]0.7864[/C][/ROW]
[/TABLE]
Source: https://freestatistics.org/blog/index.php?pk=302225&T=2

Globally Unique Identifier (entire table): ba.freestatistics.org/blog/index.php?pk=302225&T=2

As an alternative you can also use a QR Code:  

The GUIDs for individual cells are displayed in the table below:

Univariate ARIMA Extrapolation Forecast Performance
time% S.E.PEMAPEsMAPESq.EMSERMSEScaledEMASE
1170.23390.14230.14230.1532325824.3947000.52110.5211
1180.23740.10730.12480.1333174205.7836250015.0892500.01510.38110.4511
1190.25770.42710.22550.26995337970.27491946000.15111394.99112.10931.0038
1200.2311-0.00230.16970.20379.80881459520.06551208.106-0.00820.7549
1210.2660.17290.17040.2002427683.27591253152.70761119.4430.59710.7233
1220.24440.30590.1930.2272753050.86961503135.73461226.02441.51480.8553
1230.22890.21350.19590.22881412214.59761490147.00071220.71581.08490.8881
1240.2376-0.02720.17480.203512458.9361305435.99261142.5568-0.10190.7898
1250.2525-0.31740.19060.2113875255.87341257638.20161121.4447-0.85410.7969
1260.24020.14760.18630.2061574236.69911189298.05141090.54940.69180.7864


Parameters (Session):
par1 = 12 ;
Parameters (R input):
par1 = 10 ; par2 = 0.5 ; par3 = 1 ; par4 = 0 ; par5 = 12 ; par6 = 0 ; par7 = 1 ; par8 = 1 ; par9 = 1 ; par10 = FALSE ;
R code (references can be found in the software module):
par1 <- as.numeric(par1) #cut off periods
par2 <- as.numeric(par2) #lambda
par3 <- as.numeric(par3) #degree of non-seasonal differencing
par4 <- as.numeric(par4) #degree of seasonal differencing
par5 <- as.numeric(par5) #seasonal period
par6 <- as.numeric(par6) #p
par7 <- as.numeric(par7) #q
par8 <- as.numeric(par8) #P
par9 <- as.numeric(par9) #Q
if (par10 == 'TRUE') par10 <- TRUE
if (par10 == 'FALSE') par10 <- FALSE
if (par2 == 0) x <- log(x)
if (par2 != 0) x <- x^par2
lx <- length(x)
first <- lx - 2*par1
nx <- lx - par1
nx1 <- nx + 1
fx <- lx - nx
if (fx < 1) {
fx <- par5*2
nx1 <- lx + fx - 1
first <- lx - 2*fx
}
first <- 1
if (fx < 3) fx <- round(lx/10,0)
(arima.out <- arima(x[1:nx], order=c(par6,par3,par7), seasonal=list(order=c(par8,par4,par9), period=par5), include.mean=par10, method='ML'))
(forecast <- predict(arima.out,fx))
(lb <- forecast$pred - 1.96 * forecast$se)
(ub <- forecast$pred + 1.96 * forecast$se)
if (par2 == 0) {
x <- exp(x)
forecast$pred <- exp(forecast$pred)
lb <- exp(lb)
ub <- exp(ub)
}
if (par2 != 0) {
x <- x^(1/par2)
forecast$pred <- forecast$pred^(1/par2)
lb <- lb^(1/par2)
ub <- ub^(1/par2)
}
if (par2 < 0) {
olb <- lb
lb <- ub
ub <- olb
}
(actandfor <- c(x[1:nx], forecast$pred))
(perc.se <- (ub-forecast$pred)/1.96/forecast$pred)
bitmap(file='test1.png')
opar <- par(mar=c(4,4,2,2),las=1)
ylim <- c( min(x[first:nx],lb), max(x[first:nx],ub))
plot(x,ylim=ylim,type='n',xlim=c(first,lx))
usr <- par('usr')
rect(usr[1],usr[3],nx+1,usr[4],border=NA,col='lemonchiffon')
rect(nx1,usr[3],usr[2],usr[4],border=NA,col='lavender')
abline(h= (-3:3)*2 , col ='gray', lty =3)
polygon( c(nx1:lx,lx:nx1), c(lb,rev(ub)), col = 'orange', lty=2,border=NA)
lines(nx1:lx, lb , lty=2)
lines(nx1:lx, ub , lty=2)
lines(x, lwd=2)
lines(nx1:lx, forecast$pred , lwd=2 , col ='white')
box()
par(opar)
dev.off()
prob.dec <- array(NA, dim=fx)
prob.sdec <- array(NA, dim=fx)
prob.ldec <- array(NA, dim=fx)
prob.pval <- array(NA, dim=fx)
perf.pe <- array(0, dim=fx)
perf.spe <- array(0, dim=fx)
perf.scalederr <- array(0, dim=fx)
perf.mase <- array(0, dim=fx)
perf.mase1 <- array(0, dim=fx)
perf.mape <- array(0, dim=fx)
perf.smape <- array(0, dim=fx)
perf.mape1 <- array(0, dim=fx)
perf.smape1 <- array(0,dim=fx)
perf.se <- array(0, dim=fx)
perf.mse <- array(0, dim=fx)
perf.mse1 <- array(0, dim=fx)
perf.rmse <- array(0, dim=fx)
perf.scaleddenom <- 0
for (i in 2:fx) {
perf.scaleddenom = perf.scaleddenom + abs(x[nx+i] - x[nx+i-1])
}
perf.scaleddenom = perf.scaleddenom / (fx-1)
for (i in 1:fx) {
locSD <- (ub[i] - forecast$pred[i]) / 1.96
perf.scalederr[i] = (x[nx+i] - forecast$pred[i]) / perf.scaleddenom
perf.pe[i] = (x[nx+i] - forecast$pred[i]) / x[nx+i]
perf.spe[i] = 2*(x[nx+i] - forecast$pred[i]) / (x[nx+i] + forecast$pred[i])
perf.se[i] = (x[nx+i] - forecast$pred[i])^2
prob.dec[i] = pnorm((x[nx+i-1] - forecast$pred[i]) / locSD)
prob.sdec[i] = pnorm((x[nx+i-par5] - forecast$pred[i]) / locSD)
prob.ldec[i] = pnorm((x[nx] - forecast$pred[i]) / locSD)
prob.pval[i] = pnorm(abs(x[nx+i] - forecast$pred[i]) / locSD)
}
perf.mape[1] = abs(perf.pe[1])
perf.smape[1] = abs(perf.spe[1])
perf.mape1[1] = perf.mape[1]
perf.smape1[1] = perf.smape[1]
perf.mse[1] = perf.se[1]
perf.mase[1] = abs(perf.scalederr[1])
perf.mase1[1] = perf.mase[1]
for (i in 2:fx) {
perf.mape[i] = perf.mape[i-1] + abs(perf.pe[i])
perf.mape1[i] = perf.mape[i] / i
perf.smape[i] = perf.smape[i-1] + abs(perf.spe[i])
perf.smape1[i] = perf.smape[i] / i
perf.mse[i] = perf.mse[i-1] + perf.se[i]
perf.mse1[i] = perf.mse[i] / i
perf.mase[i] = perf.mase[i-1] + abs(perf.scalederr[i])
perf.mase1[i] = perf.mase[i] / i
}
perf.rmse = sqrt(perf.mse1)
bitmap(file='test2.png')
plot(forecast$pred, pch=19, type='b',main='ARIMA Extrapolation Forecast', ylab='Forecast and 95% CI', xlab='time',ylim=c(min(lb),max(ub)))
dum <- forecast$pred
dum[1:par1] <- x[(nx+1):lx]
lines(dum, lty=1)
lines(ub,lty=3)
lines(lb,lty=3)
dev.off()
load(file='createtable')
a<-table.start()
a<-table.row.start(a)
a<-table.element(a,'Univariate ARIMA Extrapolation Forecast',9,TRUE)
a<-table.row.end(a)
a<-table.row.start(a)
a<-table.element(a,'time',1,header=TRUE)
a<-table.element(a,'Y[t]',1,header=TRUE)
a<-table.element(a,'F[t]',1,header=TRUE)
a<-table.element(a,'95% LB',1,header=TRUE)
a<-table.element(a,'95% UB',1,header=TRUE)
a<-table.element(a,'p-value
(H0: Y[t] = F[t])',1,header=TRUE)
a<-table.element(a,'P(F[t]>Y[t-1])',1,header=TRUE)
a<-table.element(a,'P(F[t]>Y[t-s])',1,header=TRUE)
mylab <- paste('P(F[t]>Y[',nx,sep='')
mylab <- paste(mylab,'])',sep='')
a<-table.element(a,mylab,1,header=TRUE)
a<-table.row.end(a)
for (i in (nx-par5):nx) {
a<-table.row.start(a)
a<-table.element(a,i,header=TRUE)
a<-table.element(a,x[i])
a<-table.element(a,'-')
a<-table.row.end(a)
}
for (i in 1:fx) {
a<-table.row.start(a)
a<-table.element(a,nx+i,header=TRUE)
a<-table.element(a,round(x[nx+i],4))
a<-table.element(a,round(forecast$pred[i],4))
a<-table.element(a,round(lb[i],4))
a<-table.element(a,round(ub[i],4))
a<-table.element(a,round((1-prob.pval[i]),4))
a<-table.element(a,round((1-prob.dec[i]),4))
a<-table.element(a,round((1-prob.sdec[i]),4))
a<-table.element(a,round((1-prob.ldec[i]),4))
a<-table.row.end(a)
}
a<-table.end(a)
table.save(a,file='mytable.tab')
a<-table.start()
a<-table.row.start(a)
a<-table.element(a,'Univariate ARIMA Extrapolation Forecast Performance',10,TRUE)
a<-table.row.end(a)
a<-table.row.start(a)
a<-table.element(a,'time',1,header=TRUE)
a<-table.element(a,'% S.E.',1,header=TRUE)
a<-table.element(a,'PE',1,header=TRUE)
a<-table.element(a,'MAPE',1,header=TRUE)
a<-table.element(a,'sMAPE',1,header=TRUE)
a<-table.element(a,'Sq.E',1,header=TRUE)
a<-table.element(a,'MSE',1,header=TRUE)
a<-table.element(a,'RMSE',1,header=TRUE)
a<-table.element(a,'ScaledE',1,header=TRUE)
a<-table.element(a,'MASE',1,header=TRUE)
a<-table.row.end(a)
for (i in 1:fx) {
a<-table.row.start(a)
a<-table.element(a,nx+i,header=TRUE)
a<-table.element(a,round(perc.se[i],4))
a<-table.element(a,round(perf.pe[i],4))
a<-table.element(a,round(perf.mape1[i],4))
a<-table.element(a,round(perf.smape1[i],4))
a<-table.element(a,round(perf.se[i],4))
a<-table.element(a,round(perf.mse1[i],4))
a<-table.element(a,round(perf.rmse[i],4))
a<-table.element(a,round(perf.scalederr[i],4))
a<-table.element(a,round(perf.mase1[i],4))
a<-table.row.end(a)
}
a<-table.end(a)
table.save(a,file='mytable1.tab')