Free Statistics

of Irreproducible Research!

Author's title

Author*The author of this computation has been verified*
R Software Modulerwasp_autocorrelation.wasp
Title produced by software(Partial) Autocorrelation Function
Date of computationWed, 21 Dec 2016 14:42:02 +0100
Cite this page as followsStatistical Computations at FreeStatistics.org, Office for Research Development and Education, URL https://freestatistics.org/blog/index.php?v=date/2016/Dec/21/t1482327741xg06tpkf3mixzde.htm/, Retrieved Mon, 06 May 2024 18:20:42 +0000
Statistical Computations at FreeStatistics.org, Office for Research Development and Education, URL https://freestatistics.org/blog/index.php?pk=302284, Retrieved Mon, 06 May 2024 18:20:42 +0000
QR Codes:

Original text written by user:
IsPrivate?No (this computation is public)
User-defined keywords
Estimated Impact54
Family? (F = Feedback message, R = changed R code, M = changed R Module, P = changed Parameters, D = changed Data)
-     [Univariate Data Series] [data set] [2008-12-01 19:54:57] [b98453cac15ba1066b407e146608df68]
- RMP   [(Partial) Autocorrelation Function] [Unemployment] [2010-11-29 09:05:21] [b98453cac15ba1066b407e146608df68]
- RMPD      [(Partial) Autocorrelation Function] [] [2016-12-21 13:42:02] [def48497f28d33434d2b266acb94ba5d] [Current]
Feedback Forum

Post a new message
Dataseries X:
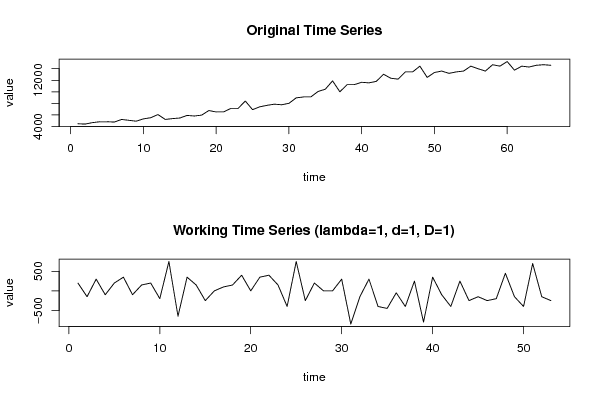
4450
4400
4650
4800
4800
4750
5200
5050
4900
5300
5500
6050
5200
5350
5450
5900
5800
5950
6750
6500
6500
7100
7100
8400
6900
7400
7650
7850
7750
8000
8950
9100
9100
10050
10450
11900
10000
11250
11250
11650
11550
11800
13050
12350
12200
13450
13450
14450
12500
13350
13600
13200
13450
13600
14450
14000
13600
14700
14450
15250
13750
14450
14300
14600
14700
14600


Summary of computational transaction
Raw Input view raw input (R code)
Raw Outputview raw output of R engine
Computing time2 seconds
R ServerBig Analytics Cloud Computing Center

\begin{tabular}{lllllllll}
\hline
Summary of computational transaction \tabularnewline
Raw Input view raw input (R code)  \tabularnewline
Raw Outputview raw output of R engine  \tabularnewline
Computing time2 seconds \tabularnewline
R ServerBig Analytics Cloud Computing Center \tabularnewline
\hline
\end{tabular}
%Source: https://freestatistics.org/blog/index.php?pk=302284&T=0

[TABLE]
[ROW]
Summary of computational transaction[/C][/ROW] [ROW]Raw Input[/C] view raw input (R code) [/C][/ROW] [ROW]Raw Output[/C]view raw output of R engine [/C][/ROW] [ROW]Computing time[/C]2 seconds[/C][/ROW] [ROW]R Server[/C]Big Analytics Cloud Computing Center[/C][/ROW] [/TABLE] Source: https://freestatistics.org/blog/index.php?pk=302284&T=0

Globally Unique Identifier (entire table): ba.freestatistics.org/blog/index.php?pk=302284&T=0

As an alternative you can also use a QR Code:  

The GUIDs for individual cells are displayed in the table below:

Summary of computational transaction
Raw Input view raw input (R code)
Raw Outputview raw output of R engine
Computing time2 seconds
R ServerBig Analytics Cloud Computing Center


Autocorrelation Function
Time lag kACF(k)T-STATP-value
1-0.365777-2.66290.005118
20.0990910.72140.23692
30.3086922.24730.014403
4-0.060255-0.43870.331346
50.2296521.67190.05022
6-0.102416-0.74560.229601
7-0.030355-0.2210.412976
80.4270873.10920.001508
9-0.334273-2.43350.009178
100.038530.28050.390092
110.2121811.54470.064185
12-0.17835-1.29840.099884
130.0159570.11620.453978
14-0.035533-0.25870.398439
150.0397770.28960.386633
160.0543320.39550.347014
17-0.193376-1.40780.082515
180.0133130.09690.461578
190.1756181.27850.103318
20-0.234127-1.70450.047075
21-0.005476-0.03990.484176
220.0874140.63640.263634
23-0.1076-0.78330.218456
240.020990.15280.439565
25-0.120009-0.87370.193117
26-0.054724-0.39840.34597
270.1162280.84620.200635
28-0.27411-1.99560.025567
290.1003060.73020.234229
300.0200050.14560.442378
31-0.175008-1.27410.104097
320.093470.68050.249583
33-0.107391-0.78180.2189
34-0.027454-0.19990.421174
350.0640860.46660.321366
36-0.20415-1.48620.071571
370.1093470.79610.214774
380.0062120.04520.482048
39-0.135693-0.98790.163854
400.104960.76410.224091
41-0.08105-0.59010.278832
420.0177230.1290.448913
430.0180550.13140.447961
44-0.062496-0.4550.325493
450.0408470.29740.383673
46-0.000476-0.00350.498623
47-0.030211-0.21990.413382
480.0309050.2250.411426

\begin{tabular}{lllllllll}
\hline
Autocorrelation Function \tabularnewline
Time lag k & ACF(k) & T-STAT & P-value \tabularnewline
1 & -0.365777 & -2.6629 & 0.005118 \tabularnewline
2 & 0.099091 & 0.7214 & 0.23692 \tabularnewline
3 & 0.308692 & 2.2473 & 0.014403 \tabularnewline
4 & -0.060255 & -0.4387 & 0.331346 \tabularnewline
5 & 0.229652 & 1.6719 & 0.05022 \tabularnewline
6 & -0.102416 & -0.7456 & 0.229601 \tabularnewline
7 & -0.030355 & -0.221 & 0.412976 \tabularnewline
8 & 0.427087 & 3.1092 & 0.001508 \tabularnewline
9 & -0.334273 & -2.4335 & 0.009178 \tabularnewline
10 & 0.03853 & 0.2805 & 0.390092 \tabularnewline
11 & 0.212181 & 1.5447 & 0.064185 \tabularnewline
12 & -0.17835 & -1.2984 & 0.099884 \tabularnewline
13 & 0.015957 & 0.1162 & 0.453978 \tabularnewline
14 & -0.035533 & -0.2587 & 0.398439 \tabularnewline
15 & 0.039777 & 0.2896 & 0.386633 \tabularnewline
16 & 0.054332 & 0.3955 & 0.347014 \tabularnewline
17 & -0.193376 & -1.4078 & 0.082515 \tabularnewline
18 & 0.013313 & 0.0969 & 0.461578 \tabularnewline
19 & 0.175618 & 1.2785 & 0.103318 \tabularnewline
20 & -0.234127 & -1.7045 & 0.047075 \tabularnewline
21 & -0.005476 & -0.0399 & 0.484176 \tabularnewline
22 & 0.087414 & 0.6364 & 0.263634 \tabularnewline
23 & -0.1076 & -0.7833 & 0.218456 \tabularnewline
24 & 0.02099 & 0.1528 & 0.439565 \tabularnewline
25 & -0.120009 & -0.8737 & 0.193117 \tabularnewline
26 & -0.054724 & -0.3984 & 0.34597 \tabularnewline
27 & 0.116228 & 0.8462 & 0.200635 \tabularnewline
28 & -0.27411 & -1.9956 & 0.025567 \tabularnewline
29 & 0.100306 & 0.7302 & 0.234229 \tabularnewline
30 & 0.020005 & 0.1456 & 0.442378 \tabularnewline
31 & -0.175008 & -1.2741 & 0.104097 \tabularnewline
32 & 0.09347 & 0.6805 & 0.249583 \tabularnewline
33 & -0.107391 & -0.7818 & 0.2189 \tabularnewline
34 & -0.027454 & -0.1999 & 0.421174 \tabularnewline
35 & 0.064086 & 0.4666 & 0.321366 \tabularnewline
36 & -0.20415 & -1.4862 & 0.071571 \tabularnewline
37 & 0.109347 & 0.7961 & 0.214774 \tabularnewline
38 & 0.006212 & 0.0452 & 0.482048 \tabularnewline
39 & -0.135693 & -0.9879 & 0.163854 \tabularnewline
40 & 0.10496 & 0.7641 & 0.224091 \tabularnewline
41 & -0.08105 & -0.5901 & 0.278832 \tabularnewline
42 & 0.017723 & 0.129 & 0.448913 \tabularnewline
43 & 0.018055 & 0.1314 & 0.447961 \tabularnewline
44 & -0.062496 & -0.455 & 0.325493 \tabularnewline
45 & 0.040847 & 0.2974 & 0.383673 \tabularnewline
46 & -0.000476 & -0.0035 & 0.498623 \tabularnewline
47 & -0.030211 & -0.2199 & 0.413382 \tabularnewline
48 & 0.030905 & 0.225 & 0.411426 \tabularnewline
\hline
\end{tabular}
%Source: https://freestatistics.org/blog/index.php?pk=302284&T=1

[TABLE]
[ROW][C]Autocorrelation Function[/C][/ROW]
[ROW][C]Time lag k[/C][C]ACF(k)[/C][C]T-STAT[/C][C]P-value[/C][/ROW]
[ROW][C]1[/C][C]-0.365777[/C][C]-2.6629[/C][C]0.005118[/C][/ROW]
[ROW][C]2[/C][C]0.099091[/C][C]0.7214[/C][C]0.23692[/C][/ROW]
[ROW][C]3[/C][C]0.308692[/C][C]2.2473[/C][C]0.014403[/C][/ROW]
[ROW][C]4[/C][C]-0.060255[/C][C]-0.4387[/C][C]0.331346[/C][/ROW]
[ROW][C]5[/C][C]0.229652[/C][C]1.6719[/C][C]0.05022[/C][/ROW]
[ROW][C]6[/C][C]-0.102416[/C][C]-0.7456[/C][C]0.229601[/C][/ROW]
[ROW][C]7[/C][C]-0.030355[/C][C]-0.221[/C][C]0.412976[/C][/ROW]
[ROW][C]8[/C][C]0.427087[/C][C]3.1092[/C][C]0.001508[/C][/ROW]
[ROW][C]9[/C][C]-0.334273[/C][C]-2.4335[/C][C]0.009178[/C][/ROW]
[ROW][C]10[/C][C]0.03853[/C][C]0.2805[/C][C]0.390092[/C][/ROW]
[ROW][C]11[/C][C]0.212181[/C][C]1.5447[/C][C]0.064185[/C][/ROW]
[ROW][C]12[/C][C]-0.17835[/C][C]-1.2984[/C][C]0.099884[/C][/ROW]
[ROW][C]13[/C][C]0.015957[/C][C]0.1162[/C][C]0.453978[/C][/ROW]
[ROW][C]14[/C][C]-0.035533[/C][C]-0.2587[/C][C]0.398439[/C][/ROW]
[ROW][C]15[/C][C]0.039777[/C][C]0.2896[/C][C]0.386633[/C][/ROW]
[ROW][C]16[/C][C]0.054332[/C][C]0.3955[/C][C]0.347014[/C][/ROW]
[ROW][C]17[/C][C]-0.193376[/C][C]-1.4078[/C][C]0.082515[/C][/ROW]
[ROW][C]18[/C][C]0.013313[/C][C]0.0969[/C][C]0.461578[/C][/ROW]
[ROW][C]19[/C][C]0.175618[/C][C]1.2785[/C][C]0.103318[/C][/ROW]
[ROW][C]20[/C][C]-0.234127[/C][C]-1.7045[/C][C]0.047075[/C][/ROW]
[ROW][C]21[/C][C]-0.005476[/C][C]-0.0399[/C][C]0.484176[/C][/ROW]
[ROW][C]22[/C][C]0.087414[/C][C]0.6364[/C][C]0.263634[/C][/ROW]
[ROW][C]23[/C][C]-0.1076[/C][C]-0.7833[/C][C]0.218456[/C][/ROW]
[ROW][C]24[/C][C]0.02099[/C][C]0.1528[/C][C]0.439565[/C][/ROW]
[ROW][C]25[/C][C]-0.120009[/C][C]-0.8737[/C][C]0.193117[/C][/ROW]
[ROW][C]26[/C][C]-0.054724[/C][C]-0.3984[/C][C]0.34597[/C][/ROW]
[ROW][C]27[/C][C]0.116228[/C][C]0.8462[/C][C]0.200635[/C][/ROW]
[ROW][C]28[/C][C]-0.27411[/C][C]-1.9956[/C][C]0.025567[/C][/ROW]
[ROW][C]29[/C][C]0.100306[/C][C]0.7302[/C][C]0.234229[/C][/ROW]
[ROW][C]30[/C][C]0.020005[/C][C]0.1456[/C][C]0.442378[/C][/ROW]
[ROW][C]31[/C][C]-0.175008[/C][C]-1.2741[/C][C]0.104097[/C][/ROW]
[ROW][C]32[/C][C]0.09347[/C][C]0.6805[/C][C]0.249583[/C][/ROW]
[ROW][C]33[/C][C]-0.107391[/C][C]-0.7818[/C][C]0.2189[/C][/ROW]
[ROW][C]34[/C][C]-0.027454[/C][C]-0.1999[/C][C]0.421174[/C][/ROW]
[ROW][C]35[/C][C]0.064086[/C][C]0.4666[/C][C]0.321366[/C][/ROW]
[ROW][C]36[/C][C]-0.20415[/C][C]-1.4862[/C][C]0.071571[/C][/ROW]
[ROW][C]37[/C][C]0.109347[/C][C]0.7961[/C][C]0.214774[/C][/ROW]
[ROW][C]38[/C][C]0.006212[/C][C]0.0452[/C][C]0.482048[/C][/ROW]
[ROW][C]39[/C][C]-0.135693[/C][C]-0.9879[/C][C]0.163854[/C][/ROW]
[ROW][C]40[/C][C]0.10496[/C][C]0.7641[/C][C]0.224091[/C][/ROW]
[ROW][C]41[/C][C]-0.08105[/C][C]-0.5901[/C][C]0.278832[/C][/ROW]
[ROW][C]42[/C][C]0.017723[/C][C]0.129[/C][C]0.448913[/C][/ROW]
[ROW][C]43[/C][C]0.018055[/C][C]0.1314[/C][C]0.447961[/C][/ROW]
[ROW][C]44[/C][C]-0.062496[/C][C]-0.455[/C][C]0.325493[/C][/ROW]
[ROW][C]45[/C][C]0.040847[/C][C]0.2974[/C][C]0.383673[/C][/ROW]
[ROW][C]46[/C][C]-0.000476[/C][C]-0.0035[/C][C]0.498623[/C][/ROW]
[ROW][C]47[/C][C]-0.030211[/C][C]-0.2199[/C][C]0.413382[/C][/ROW]
[ROW][C]48[/C][C]0.030905[/C][C]0.225[/C][C]0.411426[/C][/ROW]
[/TABLE]
Source: https://freestatistics.org/blog/index.php?pk=302284&T=1

Globally Unique Identifier (entire table): ba.freestatistics.org/blog/index.php?pk=302284&T=1

As an alternative you can also use a QR Code:  

The GUIDs for individual cells are displayed in the table below:

Autocorrelation Function
Time lag kACF(k)T-STATP-value
1-0.365777-2.66290.005118
20.0990910.72140.23692
30.3086922.24730.014403
4-0.060255-0.43870.331346
50.2296521.67190.05022
6-0.102416-0.74560.229601
7-0.030355-0.2210.412976
80.4270873.10920.001508
9-0.334273-2.43350.009178
100.038530.28050.390092
110.2121811.54470.064185
12-0.17835-1.29840.099884
130.0159570.11620.453978
14-0.035533-0.25870.398439
150.0397770.28960.386633
160.0543320.39550.347014
17-0.193376-1.40780.082515
180.0133130.09690.461578
190.1756181.27850.103318
20-0.234127-1.70450.047075
21-0.005476-0.03990.484176
220.0874140.63640.263634
23-0.1076-0.78330.218456
240.020990.15280.439565
25-0.120009-0.87370.193117
26-0.054724-0.39840.34597
270.1162280.84620.200635
28-0.27411-1.99560.025567
290.1003060.73020.234229
300.0200050.14560.442378
31-0.175008-1.27410.104097
320.093470.68050.249583
33-0.107391-0.78180.2189
34-0.027454-0.19990.421174
350.0640860.46660.321366
36-0.20415-1.48620.071571
370.1093470.79610.214774
380.0062120.04520.482048
39-0.135693-0.98790.163854
400.104960.76410.224091
41-0.08105-0.59010.278832
420.0177230.1290.448913
430.0180550.13140.447961
44-0.062496-0.4550.325493
450.0408470.29740.383673
46-0.000476-0.00350.498623
47-0.030211-0.21990.413382
480.0309050.2250.411426


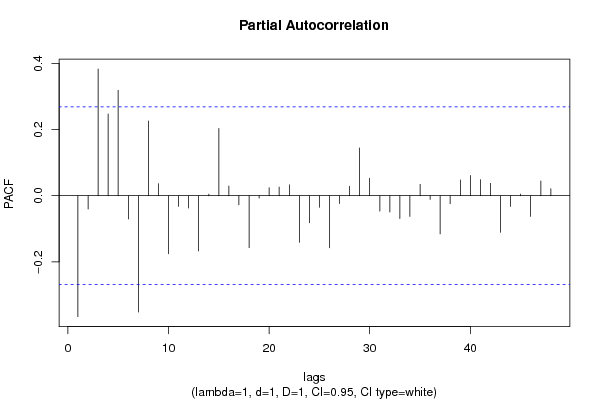
Partial Autocorrelation Function
Time lag kPACF(k)T-STATP-value
1-0.365777-2.66290.005118
2-0.040062-0.29170.385845
30.3835912.79260.003629
40.2471041.79890.038861
50.3187942.32090.012087
6-0.070462-0.5130.305052
7-0.351933-2.56210.006641
80.2259931.64530.052918
90.036550.26610.395601
10-0.175293-1.27620.103733
11-0.032198-0.23440.407786
12-0.037217-0.27090.393744
13-0.167028-1.2160.11469
140.0048220.03510.486063
150.2035661.4820.072134
160.0291790.21240.416294
17-0.027131-0.19750.42209
18-0.15696-1.14270.129152
19-0.007134-0.05190.479386
200.0242020.17620.430408
210.0261010.190.42501
220.0328880.23940.40585
23-0.140523-1.0230.155472
24-0.0817-0.59480.27726
25-0.034728-0.25280.400692
26-0.157587-1.14720.128216
27-0.023581-0.17170.432176
280.0286190.20840.417877
290.144491.05190.148809
300.0530550.38620.35043
31-0.046443-0.33810.368309
32-0.049296-0.35890.360555
33-0.069016-0.50240.308718
34-0.062545-0.45530.325364
350.0344260.25060.401537
36-0.010983-0.080.468286
37-0.115489-0.84080.202127
38-0.024337-0.17720.430024
390.0478650.34850.364437
400.0612120.44560.328839
410.0485380.35340.362609
420.0375370.27330.392852
43-0.110499-0.80440.212368
44-0.032445-0.23620.407094
450.0049770.03620.485616
46-0.062365-0.4540.325833
470.0444030.32330.373884
480.0210150.1530.439493

\begin{tabular}{lllllllll}
\hline
Partial Autocorrelation Function \tabularnewline
Time lag k & PACF(k) & T-STAT & P-value \tabularnewline
1 & -0.365777 & -2.6629 & 0.005118 \tabularnewline
2 & -0.040062 & -0.2917 & 0.385845 \tabularnewline
3 & 0.383591 & 2.7926 & 0.003629 \tabularnewline
4 & 0.247104 & 1.7989 & 0.038861 \tabularnewline
5 & 0.318794 & 2.3209 & 0.012087 \tabularnewline
6 & -0.070462 & -0.513 & 0.305052 \tabularnewline
7 & -0.351933 & -2.5621 & 0.006641 \tabularnewline
8 & 0.225993 & 1.6453 & 0.052918 \tabularnewline
9 & 0.03655 & 0.2661 & 0.395601 \tabularnewline
10 & -0.175293 & -1.2762 & 0.103733 \tabularnewline
11 & -0.032198 & -0.2344 & 0.407786 \tabularnewline
12 & -0.037217 & -0.2709 & 0.393744 \tabularnewline
13 & -0.167028 & -1.216 & 0.11469 \tabularnewline
14 & 0.004822 & 0.0351 & 0.486063 \tabularnewline
15 & 0.203566 & 1.482 & 0.072134 \tabularnewline
16 & 0.029179 & 0.2124 & 0.416294 \tabularnewline
17 & -0.027131 & -0.1975 & 0.42209 \tabularnewline
18 & -0.15696 & -1.1427 & 0.129152 \tabularnewline
19 & -0.007134 & -0.0519 & 0.479386 \tabularnewline
20 & 0.024202 & 0.1762 & 0.430408 \tabularnewline
21 & 0.026101 & 0.19 & 0.42501 \tabularnewline
22 & 0.032888 & 0.2394 & 0.40585 \tabularnewline
23 & -0.140523 & -1.023 & 0.155472 \tabularnewline
24 & -0.0817 & -0.5948 & 0.27726 \tabularnewline
25 & -0.034728 & -0.2528 & 0.400692 \tabularnewline
26 & -0.157587 & -1.1472 & 0.128216 \tabularnewline
27 & -0.023581 & -0.1717 & 0.432176 \tabularnewline
28 & 0.028619 & 0.2084 & 0.417877 \tabularnewline
29 & 0.14449 & 1.0519 & 0.148809 \tabularnewline
30 & 0.053055 & 0.3862 & 0.35043 \tabularnewline
31 & -0.046443 & -0.3381 & 0.368309 \tabularnewline
32 & -0.049296 & -0.3589 & 0.360555 \tabularnewline
33 & -0.069016 & -0.5024 & 0.308718 \tabularnewline
34 & -0.062545 & -0.4553 & 0.325364 \tabularnewline
35 & 0.034426 & 0.2506 & 0.401537 \tabularnewline
36 & -0.010983 & -0.08 & 0.468286 \tabularnewline
37 & -0.115489 & -0.8408 & 0.202127 \tabularnewline
38 & -0.024337 & -0.1772 & 0.430024 \tabularnewline
39 & 0.047865 & 0.3485 & 0.364437 \tabularnewline
40 & 0.061212 & 0.4456 & 0.328839 \tabularnewline
41 & 0.048538 & 0.3534 & 0.362609 \tabularnewline
42 & 0.037537 & 0.2733 & 0.392852 \tabularnewline
43 & -0.110499 & -0.8044 & 0.212368 \tabularnewline
44 & -0.032445 & -0.2362 & 0.407094 \tabularnewline
45 & 0.004977 & 0.0362 & 0.485616 \tabularnewline
46 & -0.062365 & -0.454 & 0.325833 \tabularnewline
47 & 0.044403 & 0.3233 & 0.373884 \tabularnewline
48 & 0.021015 & 0.153 & 0.439493 \tabularnewline
\hline
\end{tabular}
%Source: https://freestatistics.org/blog/index.php?pk=302284&T=2

[TABLE]
[ROW][C]Partial Autocorrelation Function[/C][/ROW]
[ROW][C]Time lag k[/C][C]PACF(k)[/C][C]T-STAT[/C][C]P-value[/C][/ROW]
[ROW][C]1[/C][C]-0.365777[/C][C]-2.6629[/C][C]0.005118[/C][/ROW]
[ROW][C]2[/C][C]-0.040062[/C][C]-0.2917[/C][C]0.385845[/C][/ROW]
[ROW][C]3[/C][C]0.383591[/C][C]2.7926[/C][C]0.003629[/C][/ROW]
[ROW][C]4[/C][C]0.247104[/C][C]1.7989[/C][C]0.038861[/C][/ROW]
[ROW][C]5[/C][C]0.318794[/C][C]2.3209[/C][C]0.012087[/C][/ROW]
[ROW][C]6[/C][C]-0.070462[/C][C]-0.513[/C][C]0.305052[/C][/ROW]
[ROW][C]7[/C][C]-0.351933[/C][C]-2.5621[/C][C]0.006641[/C][/ROW]
[ROW][C]8[/C][C]0.225993[/C][C]1.6453[/C][C]0.052918[/C][/ROW]
[ROW][C]9[/C][C]0.03655[/C][C]0.2661[/C][C]0.395601[/C][/ROW]
[ROW][C]10[/C][C]-0.175293[/C][C]-1.2762[/C][C]0.103733[/C][/ROW]
[ROW][C]11[/C][C]-0.032198[/C][C]-0.2344[/C][C]0.407786[/C][/ROW]
[ROW][C]12[/C][C]-0.037217[/C][C]-0.2709[/C][C]0.393744[/C][/ROW]
[ROW][C]13[/C][C]-0.167028[/C][C]-1.216[/C][C]0.11469[/C][/ROW]
[ROW][C]14[/C][C]0.004822[/C][C]0.0351[/C][C]0.486063[/C][/ROW]
[ROW][C]15[/C][C]0.203566[/C][C]1.482[/C][C]0.072134[/C][/ROW]
[ROW][C]16[/C][C]0.029179[/C][C]0.2124[/C][C]0.416294[/C][/ROW]
[ROW][C]17[/C][C]-0.027131[/C][C]-0.1975[/C][C]0.42209[/C][/ROW]
[ROW][C]18[/C][C]-0.15696[/C][C]-1.1427[/C][C]0.129152[/C][/ROW]
[ROW][C]19[/C][C]-0.007134[/C][C]-0.0519[/C][C]0.479386[/C][/ROW]
[ROW][C]20[/C][C]0.024202[/C][C]0.1762[/C][C]0.430408[/C][/ROW]
[ROW][C]21[/C][C]0.026101[/C][C]0.19[/C][C]0.42501[/C][/ROW]
[ROW][C]22[/C][C]0.032888[/C][C]0.2394[/C][C]0.40585[/C][/ROW]
[ROW][C]23[/C][C]-0.140523[/C][C]-1.023[/C][C]0.155472[/C][/ROW]
[ROW][C]24[/C][C]-0.0817[/C][C]-0.5948[/C][C]0.27726[/C][/ROW]
[ROW][C]25[/C][C]-0.034728[/C][C]-0.2528[/C][C]0.400692[/C][/ROW]
[ROW][C]26[/C][C]-0.157587[/C][C]-1.1472[/C][C]0.128216[/C][/ROW]
[ROW][C]27[/C][C]-0.023581[/C][C]-0.1717[/C][C]0.432176[/C][/ROW]
[ROW][C]28[/C][C]0.028619[/C][C]0.2084[/C][C]0.417877[/C][/ROW]
[ROW][C]29[/C][C]0.14449[/C][C]1.0519[/C][C]0.148809[/C][/ROW]
[ROW][C]30[/C][C]0.053055[/C][C]0.3862[/C][C]0.35043[/C][/ROW]
[ROW][C]31[/C][C]-0.046443[/C][C]-0.3381[/C][C]0.368309[/C][/ROW]
[ROW][C]32[/C][C]-0.049296[/C][C]-0.3589[/C][C]0.360555[/C][/ROW]
[ROW][C]33[/C][C]-0.069016[/C][C]-0.5024[/C][C]0.308718[/C][/ROW]
[ROW][C]34[/C][C]-0.062545[/C][C]-0.4553[/C][C]0.325364[/C][/ROW]
[ROW][C]35[/C][C]0.034426[/C][C]0.2506[/C][C]0.401537[/C][/ROW]
[ROW][C]36[/C][C]-0.010983[/C][C]-0.08[/C][C]0.468286[/C][/ROW]
[ROW][C]37[/C][C]-0.115489[/C][C]-0.8408[/C][C]0.202127[/C][/ROW]
[ROW][C]38[/C][C]-0.024337[/C][C]-0.1772[/C][C]0.430024[/C][/ROW]
[ROW][C]39[/C][C]0.047865[/C][C]0.3485[/C][C]0.364437[/C][/ROW]
[ROW][C]40[/C][C]0.061212[/C][C]0.4456[/C][C]0.328839[/C][/ROW]
[ROW][C]41[/C][C]0.048538[/C][C]0.3534[/C][C]0.362609[/C][/ROW]
[ROW][C]42[/C][C]0.037537[/C][C]0.2733[/C][C]0.392852[/C][/ROW]
[ROW][C]43[/C][C]-0.110499[/C][C]-0.8044[/C][C]0.212368[/C][/ROW]
[ROW][C]44[/C][C]-0.032445[/C][C]-0.2362[/C][C]0.407094[/C][/ROW]
[ROW][C]45[/C][C]0.004977[/C][C]0.0362[/C][C]0.485616[/C][/ROW]
[ROW][C]46[/C][C]-0.062365[/C][C]-0.454[/C][C]0.325833[/C][/ROW]
[ROW][C]47[/C][C]0.044403[/C][C]0.3233[/C][C]0.373884[/C][/ROW]
[ROW][C]48[/C][C]0.021015[/C][C]0.153[/C][C]0.439493[/C][/ROW]
[/TABLE]
Source: https://freestatistics.org/blog/index.php?pk=302284&T=2

Globally Unique Identifier (entire table): ba.freestatistics.org/blog/index.php?pk=302284&T=2

As an alternative you can also use a QR Code:  

The GUIDs for individual cells are displayed in the table below:

Partial Autocorrelation Function
Time lag kPACF(k)T-STATP-value
1-0.365777-2.66290.005118
2-0.040062-0.29170.385845
30.3835912.79260.003629
40.2471041.79890.038861
50.3187942.32090.012087
6-0.070462-0.5130.305052
7-0.351933-2.56210.006641
80.2259931.64530.052918
90.036550.26610.395601
10-0.175293-1.27620.103733
11-0.032198-0.23440.407786
12-0.037217-0.27090.393744
13-0.167028-1.2160.11469
140.0048220.03510.486063
150.2035661.4820.072134
160.0291790.21240.416294
17-0.027131-0.19750.42209
18-0.15696-1.14270.129152
19-0.007134-0.05190.479386
200.0242020.17620.430408
210.0261010.190.42501
220.0328880.23940.40585
23-0.140523-1.0230.155472
24-0.0817-0.59480.27726
25-0.034728-0.25280.400692
26-0.157587-1.14720.128216
27-0.023581-0.17170.432176
280.0286190.20840.417877
290.144491.05190.148809
300.0530550.38620.35043
31-0.046443-0.33810.368309
32-0.049296-0.35890.360555
33-0.069016-0.50240.308718
34-0.062545-0.45530.325364
350.0344260.25060.401537
36-0.010983-0.080.468286
37-0.115489-0.84080.202127
38-0.024337-0.17720.430024
390.0478650.34850.364437
400.0612120.44560.328839
410.0485380.35340.362609
420.0375370.27330.392852
43-0.110499-0.80440.212368
44-0.032445-0.23620.407094
450.0049770.03620.485616
46-0.062365-0.4540.325833
470.0444030.32330.373884
480.0210150.1530.439493


Parameters (Session):
par1 = TRUE ; par2 = 1 ; par3 = 2 ; par4 = 1 ; par5 = 12 ; par6 = 3 ; par7 = 1 ; par8 = 2 ; par9 = 1 ;
Parameters (R input):
par1 = 48 ; par2 = 1 ; par3 = 1 ; par4 = 1 ; par5 = 12 ; par6 = White Noise ; par7 = 0.95 ; par8 = ;
R code (references can be found in the software module):
par8 <- '2'
par7 <- '0.95'
par6 <- 'White Noise'
par5 <- '12'
par4 <- '1'
par3 <- '1'
par2 <- '1'
par1 <- '48'
if (par1 == 'Default') {
par1 = 10*log10(length(x))
} else {
par1 <- as.numeric(par1)
}
par2 <- as.numeric(par2)
par3 <- as.numeric(par3)
par4 <- as.numeric(par4)
par5 <- as.numeric(par5)
if (par6 == 'White Noise') par6 <- 'white' else par6 <- 'ma'
par7 <- as.numeric(par7)
if (par8 != '') par8 <- as.numeric(par8)
x <- na.omit(x)
ox <- x
if (par8 == '') {
if (par2 == 0) {
x <- log(x)
} else {
x <- (x ^ par2 - 1) / par2
}
} else {
x <- log(x,base=par8)
}
if (par3 > 0) x <- diff(x,lag=1,difference=par3)
if (par4 > 0) x <- diff(x,lag=par5,difference=par4)
bitmap(file='picts.png')
op <- par(mfrow=c(2,1))
plot(ox,type='l',main='Original Time Series',xlab='time',ylab='value')
if (par8=='') {
mytitle <- paste('Working Time Series (lambda=',par2,', d=',par3,', D=',par4,')',sep='')
mysub <- paste('(lambda=',par2,', d=',par3,', D=',par4,', CI=', par7, ', CI type=',par6,')',sep='')
} else {
mytitle <- paste('Working Time Series (base=',par8,', d=',par3,', D=',par4,')',sep='')
mysub <- paste('(base=',par8,', d=',par3,', D=',par4,', CI=', par7, ', CI type=',par6,')',sep='')
}
plot(x,type='l', main=mytitle,xlab='time',ylab='value')
par(op)
dev.off()
bitmap(file='pic1.png')
racf <- acf(x, par1, main='Autocorrelation', xlab='time lag', ylab='ACF', ci.type=par6, ci=par7, sub=mysub)
dev.off()
bitmap(file='pic2.png')
rpacf <- pacf(x,par1,main='Partial Autocorrelation',xlab='lags',ylab='PACF',sub=mysub)
dev.off()
(myacf <- c(racf$acf))
(mypacf <- c(rpacf$acf))
lengthx <- length(x)
sqrtn <- sqrt(lengthx)
load(file='createtable')
a<-table.start()
a<-table.row.start(a)
a<-table.element(a,'Autocorrelation Function',4,TRUE)
a<-table.row.end(a)
a<-table.row.start(a)
a<-table.element(a,'Time lag k',header=TRUE)
a<-table.element(a,'ACF(k)',header=TRUE)
a<-table.element(a,'T-STAT',header=TRUE)
a<-table.element(a,'P-value',header=TRUE)
a<-table.row.end(a)
for (i in 2:(par1+1)) {
a<-table.row.start(a)
a<-table.element(a,i-1,header=TRUE)
a<-table.element(a,round(myacf[i],6))
mytstat <- myacf[i]*sqrtn
a<-table.element(a,round(mytstat,4))
a<-table.element(a,round(1-pt(abs(mytstat),lengthx),6))
a<-table.row.end(a)
}
a<-table.end(a)
table.save(a,file='mytable.tab')
a<-table.start()
a<-table.row.start(a)
a<-table.element(a,'Partial Autocorrelation Function',4,TRUE)
a<-table.row.end(a)
a<-table.row.start(a)
a<-table.element(a,'Time lag k',header=TRUE)
a<-table.element(a,'PACF(k)',header=TRUE)
a<-table.element(a,'T-STAT',header=TRUE)
a<-table.element(a,'P-value',header=TRUE)
a<-table.row.end(a)
for (i in 1:par1) {
a<-table.row.start(a)
a<-table.element(a,i,header=TRUE)
a<-table.element(a,round(mypacf[i],6))
mytstat <- mypacf[i]*sqrtn
a<-table.element(a,round(mytstat,4))
a<-table.element(a,round(1-pt(abs(mytstat),lengthx),6))
a<-table.row.end(a)
}
a<-table.end(a)
table.save(a,file='mytable1.tab')