Free Statistics

of Irreproducible Research!

Author's title

Author*The author of this computation has been verified*
R Software Modulerwasp_arimabackwardselection.wasp
Title produced by softwareARIMA Backward Selection
Date of computationWed, 21 Dec 2016 17:04:38 +0100
Cite this page as followsStatistical Computations at FreeStatistics.org, Office for Research Development and Education, URL https://freestatistics.org/blog/index.php?v=date/2016/Dec/21/t14823365590y7gskrnzt0tx1q.htm/, Retrieved Mon, 06 May 2024 14:55:16 +0000
Statistical Computations at FreeStatistics.org, Office for Research Development and Education, URL https://freestatistics.org/blog/index.php?pk=302408, Retrieved Mon, 06 May 2024 14:55:16 +0000
QR Codes:

Original text written by user:
IsPrivate?No (this computation is public)
User-defined keywords
Estimated Impact82
Family? (F = Feedback message, R = changed R code, M = changed R Module, P = changed Parameters, D = changed Data)
-       [ARIMA Backward Selection] [] [2016-12-21 16:04:38] [361c8dad91b3f1ef2e651cd04783c23b] [Current]
Feedback Forum

Post a new message
Dataseries X:
5300
3800
3900
5400
6100
4200
4000
4600
7300
4400
4000
5300
9300
4300
3400
6000
6500
3400
2900
5000
5800
3000
2300
4000
5800
2900
2200
3900
5300
3000
2000
3700
6000
2800
1800
3900
5400
2400
1700
3500
5400
3900
2900
4600
5400
2900
2700
4500
6300
2800
1900
5100
6200
3500
3500
6000
6000
3400
2800
4900


Summary of computational transaction
Raw Input view raw input (R code)
Raw Outputview raw output of R engine
Computing time4 seconds
R ServerBig Analytics Cloud Computing Center

\begin{tabular}{lllllllll}
\hline
Summary of computational transaction \tabularnewline
Raw Input view raw input (R code)  \tabularnewline
Raw Outputview raw output of R engine  \tabularnewline
Computing time4 seconds \tabularnewline
R ServerBig Analytics Cloud Computing Center \tabularnewline
\hline
\end{tabular}
%Source: https://freestatistics.org/blog/index.php?pk=302408&T=0

[TABLE]
[ROW]
Summary of computational transaction[/C][/ROW] [ROW]Raw Input[/C] view raw input (R code) [/C][/ROW] [ROW]Raw Output[/C]view raw output of R engine [/C][/ROW] [ROW]Computing time[/C]4 seconds[/C][/ROW] [ROW]R Server[/C]Big Analytics Cloud Computing Center[/C][/ROW] [/TABLE] Source: https://freestatistics.org/blog/index.php?pk=302408&T=0

Globally Unique Identifier (entire table): ba.freestatistics.org/blog/index.php?pk=302408&T=0

As an alternative you can also use a QR Code:  

The GUIDs for individual cells are displayed in the table below:

Summary of computational transaction
Raw Input view raw input (R code)
Raw Outputview raw output of R engine
Computing time4 seconds
R ServerBig Analytics Cloud Computing Center


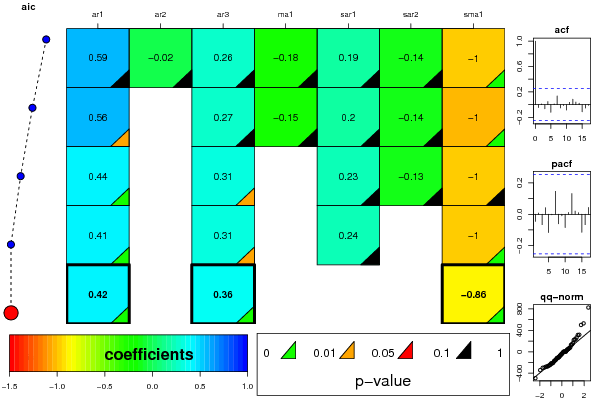
ARIMA Parameter Estimation and Backward Selection
Iterationar1ar2ar3ma1sar1sar2sma1
Estimates ( 1 )0.594-0.02150.265-0.18410.1907-0.1396-0.9999
(p-val)(0.2341 )(0.9363 )(0.1293 )(0.716 )(0.2869 )(0.3986 )(0.0016 )
Estimates ( 2 )0.560200.267-0.15140.1955-0.1395-1.0006
(p-val)(0.0346 )(NA )(0.1104 )(0.6146 )(0.2582 )(0.3976 )(0.002 )
Estimates ( 3 )0.441100.30700.234-0.1258-0.9995
(p-val)(0.0012 )(NA )(0.0213 )(NA )(0.1618 )(0.4382 )(0.2915 )
Estimates ( 4 )0.405900.309900.24180-0.9999
(p-val)(0.0015 )(NA )(0.0204 )(NA )(0.1541 )(NA )(0 )
Estimates ( 5 )0.424400.3605000-0.8616
(p-val)(6e-04 )(NA )(0.0038 )(NA )(NA )(NA )(0 )
Estimates ( 6 )NANANANANANANA
(p-val)(NA )(NA )(NA )(NA )(NA )(NA )(NA )
Estimates ( 7 )NANANANANANANA
(p-val)(NA )(NA )(NA )(NA )(NA )(NA )(NA )
Estimates ( 8 )NANANANANANANA
(p-val)(NA )(NA )(NA )(NA )(NA )(NA )(NA )
Estimates ( 9 )NANANANANANANA
(p-val)(NA )(NA )(NA )(NA )(NA )(NA )(NA )
Estimates ( 10 )NANANANANANANA
(p-val)(NA )(NA )(NA )(NA )(NA )(NA )(NA )
Estimates ( 11 )NANANANANANANA
(p-val)(NA )(NA )(NA )(NA )(NA )(NA )(NA )
Estimates ( 12 )NANANANANANANA
(p-val)(NA )(NA )(NA )(NA )(NA )(NA )(NA )
Estimates ( 13 )NANANANANANANA
(p-val)(NA )(NA )(NA )(NA )(NA )(NA )(NA )

\begin{tabular}{lllllllll}
\hline
ARIMA Parameter Estimation and Backward Selection \tabularnewline
Iteration & ar1 & ar2 & ar3 & ma1 & sar1 & sar2 & sma1 \tabularnewline
Estimates ( 1 ) & 0.594 & -0.0215 & 0.265 & -0.1841 & 0.1907 & -0.1396 & -0.9999 \tabularnewline
(p-val) & (0.2341 ) & (0.9363 ) & (0.1293 ) & (0.716 ) & (0.2869 ) & (0.3986 ) & (0.0016 ) \tabularnewline
Estimates ( 2 ) & 0.5602 & 0 & 0.267 & -0.1514 & 0.1955 & -0.1395 & -1.0006 \tabularnewline
(p-val) & (0.0346 ) & (NA ) & (0.1104 ) & (0.6146 ) & (0.2582 ) & (0.3976 ) & (0.002 ) \tabularnewline
Estimates ( 3 ) & 0.4411 & 0 & 0.307 & 0 & 0.234 & -0.1258 & -0.9995 \tabularnewline
(p-val) & (0.0012 ) & (NA ) & (0.0213 ) & (NA ) & (0.1618 ) & (0.4382 ) & (0.2915 ) \tabularnewline
Estimates ( 4 ) & 0.4059 & 0 & 0.3099 & 0 & 0.2418 & 0 & -0.9999 \tabularnewline
(p-val) & (0.0015 ) & (NA ) & (0.0204 ) & (NA ) & (0.1541 ) & (NA ) & (0 ) \tabularnewline
Estimates ( 5 ) & 0.4244 & 0 & 0.3605 & 0 & 0 & 0 & -0.8616 \tabularnewline
(p-val) & (6e-04 ) & (NA ) & (0.0038 ) & (NA ) & (NA ) & (NA ) & (0 ) \tabularnewline
Estimates ( 6 ) & NA & NA & NA & NA & NA & NA & NA \tabularnewline
(p-val) & (NA ) & (NA ) & (NA ) & (NA ) & (NA ) & (NA ) & (NA ) \tabularnewline
Estimates ( 7 ) & NA & NA & NA & NA & NA & NA & NA \tabularnewline
(p-val) & (NA ) & (NA ) & (NA ) & (NA ) & (NA ) & (NA ) & (NA ) \tabularnewline
Estimates ( 8 ) & NA & NA & NA & NA & NA & NA & NA \tabularnewline
(p-val) & (NA ) & (NA ) & (NA ) & (NA ) & (NA ) & (NA ) & (NA ) \tabularnewline
Estimates ( 9 ) & NA & NA & NA & NA & NA & NA & NA \tabularnewline
(p-val) & (NA ) & (NA ) & (NA ) & (NA ) & (NA ) & (NA ) & (NA ) \tabularnewline
Estimates ( 10 ) & NA & NA & NA & NA & NA & NA & NA \tabularnewline
(p-val) & (NA ) & (NA ) & (NA ) & (NA ) & (NA ) & (NA ) & (NA ) \tabularnewline
Estimates ( 11 ) & NA & NA & NA & NA & NA & NA & NA \tabularnewline
(p-val) & (NA ) & (NA ) & (NA ) & (NA ) & (NA ) & (NA ) & (NA ) \tabularnewline
Estimates ( 12 ) & NA & NA & NA & NA & NA & NA & NA \tabularnewline
(p-val) & (NA ) & (NA ) & (NA ) & (NA ) & (NA ) & (NA ) & (NA ) \tabularnewline
Estimates ( 13 ) & NA & NA & NA & NA & NA & NA & NA \tabularnewline
(p-val) & (NA ) & (NA ) & (NA ) & (NA ) & (NA ) & (NA ) & (NA ) \tabularnewline
\hline
\end{tabular}
%Source: https://freestatistics.org/blog/index.php?pk=302408&T=1

[TABLE]
[ROW][C]ARIMA Parameter Estimation and Backward Selection[/C][/ROW]
[ROW][C]Iteration[/C][C]ar1[/C][C]ar2[/C][C]ar3[/C][C]ma1[/C][C]sar1[/C][C]sar2[/C][C]sma1[/C][/ROW]
[ROW][C]Estimates ( 1 )[/C][C]0.594[/C][C]-0.0215[/C][C]0.265[/C][C]-0.1841[/C][C]0.1907[/C][C]-0.1396[/C][C]-0.9999[/C][/ROW]
[ROW][C](p-val)[/C][C](0.2341 )[/C][C](0.9363 )[/C][C](0.1293 )[/C][C](0.716 )[/C][C](0.2869 )[/C][C](0.3986 )[/C][C](0.0016 )[/C][/ROW]
[ROW][C]Estimates ( 2 )[/C][C]0.5602[/C][C]0[/C][C]0.267[/C][C]-0.1514[/C][C]0.1955[/C][C]-0.1395[/C][C]-1.0006[/C][/ROW]
[ROW][C](p-val)[/C][C](0.0346 )[/C][C](NA )[/C][C](0.1104 )[/C][C](0.6146 )[/C][C](0.2582 )[/C][C](0.3976 )[/C][C](0.002 )[/C][/ROW]
[ROW][C]Estimates ( 3 )[/C][C]0.4411[/C][C]0[/C][C]0.307[/C][C]0[/C][C]0.234[/C][C]-0.1258[/C][C]-0.9995[/C][/ROW]
[ROW][C](p-val)[/C][C](0.0012 )[/C][C](NA )[/C][C](0.0213 )[/C][C](NA )[/C][C](0.1618 )[/C][C](0.4382 )[/C][C](0.2915 )[/C][/ROW]
[ROW][C]Estimates ( 4 )[/C][C]0.4059[/C][C]0[/C][C]0.3099[/C][C]0[/C][C]0.2418[/C][C]0[/C][C]-0.9999[/C][/ROW]
[ROW][C](p-val)[/C][C](0.0015 )[/C][C](NA )[/C][C](0.0204 )[/C][C](NA )[/C][C](0.1541 )[/C][C](NA )[/C][C](0 )[/C][/ROW]
[ROW][C]Estimates ( 5 )[/C][C]0.4244[/C][C]0[/C][C]0.3605[/C][C]0[/C][C]0[/C][C]0[/C][C]-0.8616[/C][/ROW]
[ROW][C](p-val)[/C][C](6e-04 )[/C][C](NA )[/C][C](0.0038 )[/C][C](NA )[/C][C](NA )[/C][C](NA )[/C][C](0 )[/C][/ROW]
[ROW][C]Estimates ( 6 )[/C][C]NA[/C][C]NA[/C][C]NA[/C][C]NA[/C][C]NA[/C][C]NA[/C][C]NA[/C][/ROW]
[ROW][C](p-val)[/C][C](NA )[/C][C](NA )[/C][C](NA )[/C][C](NA )[/C][C](NA )[/C][C](NA )[/C][C](NA )[/C][/ROW]
[ROW][C]Estimates ( 7 )[/C][C]NA[/C][C]NA[/C][C]NA[/C][C]NA[/C][C]NA[/C][C]NA[/C][C]NA[/C][/ROW]
[ROW][C](p-val)[/C][C](NA )[/C][C](NA )[/C][C](NA )[/C][C](NA )[/C][C](NA )[/C][C](NA )[/C][C](NA )[/C][/ROW]
[ROW][C]Estimates ( 8 )[/C][C]NA[/C][C]NA[/C][C]NA[/C][C]NA[/C][C]NA[/C][C]NA[/C][C]NA[/C][/ROW]
[ROW][C](p-val)[/C][C](NA )[/C][C](NA )[/C][C](NA )[/C][C](NA )[/C][C](NA )[/C][C](NA )[/C][C](NA )[/C][/ROW]
[ROW][C]Estimates ( 9 )[/C][C]NA[/C][C]NA[/C][C]NA[/C][C]NA[/C][C]NA[/C][C]NA[/C][C]NA[/C][/ROW]
[ROW][C](p-val)[/C][C](NA )[/C][C](NA )[/C][C](NA )[/C][C](NA )[/C][C](NA )[/C][C](NA )[/C][C](NA )[/C][/ROW]
[ROW][C]Estimates ( 10 )[/C][C]NA[/C][C]NA[/C][C]NA[/C][C]NA[/C][C]NA[/C][C]NA[/C][C]NA[/C][/ROW]
[ROW][C](p-val)[/C][C](NA )[/C][C](NA )[/C][C](NA )[/C][C](NA )[/C][C](NA )[/C][C](NA )[/C][C](NA )[/C][/ROW]
[ROW][C]Estimates ( 11 )[/C][C]NA[/C][C]NA[/C][C]NA[/C][C]NA[/C][C]NA[/C][C]NA[/C][C]NA[/C][/ROW]
[ROW][C](p-val)[/C][C](NA )[/C][C](NA )[/C][C](NA )[/C][C](NA )[/C][C](NA )[/C][C](NA )[/C][C](NA )[/C][/ROW]
[ROW][C]Estimates ( 12 )[/C][C]NA[/C][C]NA[/C][C]NA[/C][C]NA[/C][C]NA[/C][C]NA[/C][C]NA[/C][/ROW]
[ROW][C](p-val)[/C][C](NA )[/C][C](NA )[/C][C](NA )[/C][C](NA )[/C][C](NA )[/C][C](NA )[/C][C](NA )[/C][/ROW]
[ROW][C]Estimates ( 13 )[/C][C]NA[/C][C]NA[/C][C]NA[/C][C]NA[/C][C]NA[/C][C]NA[/C][C]NA[/C][/ROW]
[ROW][C](p-val)[/C][C](NA )[/C][C](NA )[/C][C](NA )[/C][C](NA )[/C][C](NA )[/C][C](NA )[/C][C](NA )[/C][/ROW]
[/TABLE]
Source: https://freestatistics.org/blog/index.php?pk=302408&T=1

Globally Unique Identifier (entire table): ba.freestatistics.org/blog/index.php?pk=302408&T=1

As an alternative you can also use a QR Code:  

The GUIDs for individual cells are displayed in the table below:

ARIMA Parameter Estimation and Backward Selection
Iterationar1ar2ar3ma1sar1sar2sma1
Estimates ( 1 )0.594-0.02150.265-0.18410.1907-0.1396-0.9999
(p-val)(0.2341 )(0.9363 )(0.1293 )(0.716 )(0.2869 )(0.3986 )(0.0016 )
Estimates ( 2 )0.560200.267-0.15140.1955-0.1395-1.0006
(p-val)(0.0346 )(NA )(0.1104 )(0.6146 )(0.2582 )(0.3976 )(0.002 )
Estimates ( 3 )0.441100.30700.234-0.1258-0.9995
(p-val)(0.0012 )(NA )(0.0213 )(NA )(0.1618 )(0.4382 )(0.2915 )
Estimates ( 4 )0.405900.309900.24180-0.9999
(p-val)(0.0015 )(NA )(0.0204 )(NA )(0.1541 )(NA )(0 )
Estimates ( 5 )0.424400.3605000-0.8616
(p-val)(6e-04 )(NA )(0.0038 )(NA )(NA )(NA )(0 )
Estimates ( 6 )NANANANANANANA
(p-val)(NA )(NA )(NA )(NA )(NA )(NA )(NA )
Estimates ( 7 )NANANANANANANA
(p-val)(NA )(NA )(NA )(NA )(NA )(NA )(NA )
Estimates ( 8 )NANANANANANANA
(p-val)(NA )(NA )(NA )(NA )(NA )(NA )(NA )
Estimates ( 9 )NANANANANANANA
(p-val)(NA )(NA )(NA )(NA )(NA )(NA )(NA )
Estimates ( 10 )NANANANANANANA
(p-val)(NA )(NA )(NA )(NA )(NA )(NA )(NA )
Estimates ( 11 )NANANANANANANA
(p-val)(NA )(NA )(NA )(NA )(NA )(NA )(NA )
Estimates ( 12 )NANANANANANANA
(p-val)(NA )(NA )(NA )(NA )(NA )(NA )(NA )
Estimates ( 13 )NANANANANANANA
(p-val)(NA )(NA )(NA )(NA )(NA )(NA )(NA )


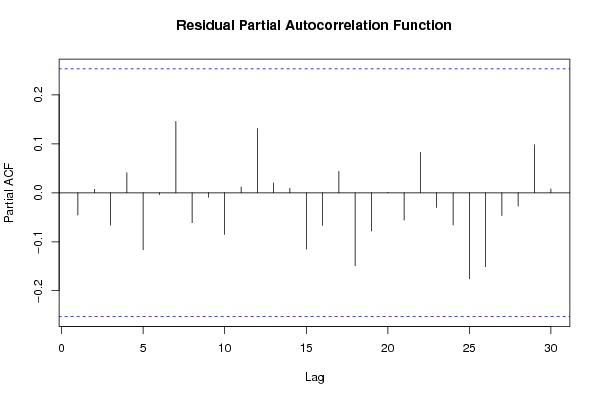
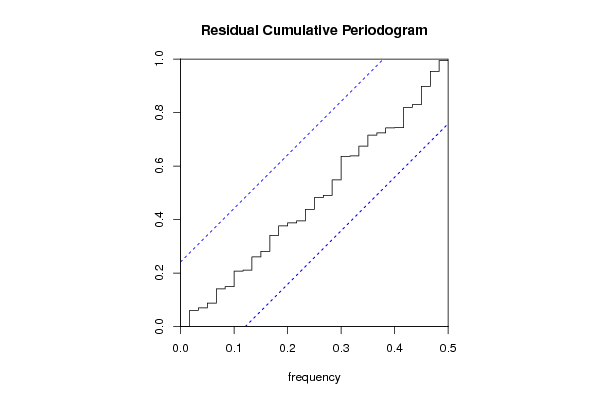
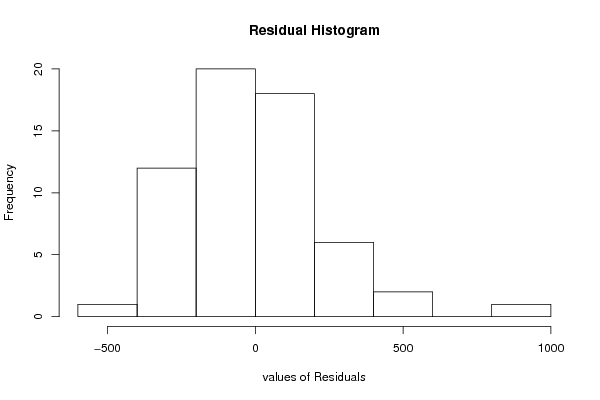
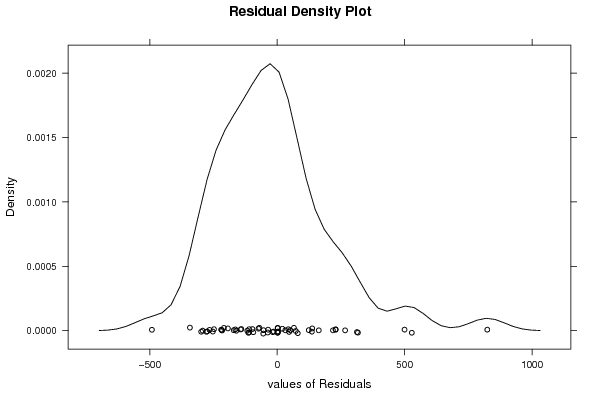
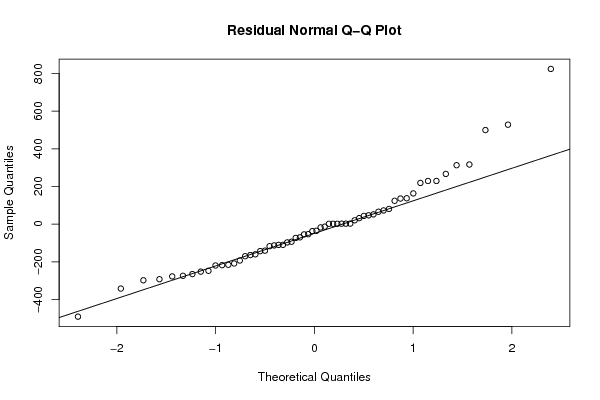
Estimated ARIMA Residuals
Value
2.28640729466096
229.260300864382
51.706595627264
-17.7657502532075
-298.403492286344
528.230711372948
-54.6884706593949
43.5204034963304
20.3099389455818
824.368736382142
-292.742871025013
-248.1088434933
123.81972162905
-491.691452057055
-53.603915501124
-265.606280614625
72.7639418787705
-164.462167719482
-73.4821667695423
-252.668142893607
-140.933317643804
46.7117441598196
-35.6350351732151
-117.335695103446
-97.1793077569849
-160.387785548652
80.5500078429984
-209.261283146182
-70.2703572747913
163.048306831435
-113.259203067155
-193.454405446209
-37.1805302362147
-143.345560746655
-110.360248646383
-170.637653211428
-110.258435458772
31.8263935086044
499.664670327903
135.916485409175
137.360652636982
-342.46238978452
-216.149669391275
2.61184736297653
65.5771362002418
229.145634817036
-218.156533787609
-277.908453700284
312.868628437989
-13.6937825227167
218.735960451935
266.497683475567
316.667085739709
-274.752177582598
-93.7677607448038
-219.890124695711
1.79972250131502

\begin{tabular}{lllllllll}
\hline
Estimated ARIMA Residuals \tabularnewline
Value \tabularnewline
2.28640729466096 \tabularnewline
229.260300864382 \tabularnewline
51.706595627264 \tabularnewline
-17.7657502532075 \tabularnewline
-298.403492286344 \tabularnewline
528.230711372948 \tabularnewline
-54.6884706593949 \tabularnewline
43.5204034963304 \tabularnewline
20.3099389455818 \tabularnewline
824.368736382142 \tabularnewline
-292.742871025013 \tabularnewline
-248.1088434933 \tabularnewline
123.81972162905 \tabularnewline
-491.691452057055 \tabularnewline
-53.603915501124 \tabularnewline
-265.606280614625 \tabularnewline
72.7639418787705 \tabularnewline
-164.462167719482 \tabularnewline
-73.4821667695423 \tabularnewline
-252.668142893607 \tabularnewline
-140.933317643804 \tabularnewline
46.7117441598196 \tabularnewline
-35.6350351732151 \tabularnewline
-117.335695103446 \tabularnewline
-97.1793077569849 \tabularnewline
-160.387785548652 \tabularnewline
80.5500078429984 \tabularnewline
-209.261283146182 \tabularnewline
-70.2703572747913 \tabularnewline
163.048306831435 \tabularnewline
-113.259203067155 \tabularnewline
-193.454405446209 \tabularnewline
-37.1805302362147 \tabularnewline
-143.345560746655 \tabularnewline
-110.360248646383 \tabularnewline
-170.637653211428 \tabularnewline
-110.258435458772 \tabularnewline
31.8263935086044 \tabularnewline
499.664670327903 \tabularnewline
135.916485409175 \tabularnewline
137.360652636982 \tabularnewline
-342.46238978452 \tabularnewline
-216.149669391275 \tabularnewline
2.61184736297653 \tabularnewline
65.5771362002418 \tabularnewline
229.145634817036 \tabularnewline
-218.156533787609 \tabularnewline
-277.908453700284 \tabularnewline
312.868628437989 \tabularnewline
-13.6937825227167 \tabularnewline
218.735960451935 \tabularnewline
266.497683475567 \tabularnewline
316.667085739709 \tabularnewline
-274.752177582598 \tabularnewline
-93.7677607448038 \tabularnewline
-219.890124695711 \tabularnewline
1.79972250131502 \tabularnewline
\hline
\end{tabular}
%Source: https://freestatistics.org/blog/index.php?pk=302408&T=2

[TABLE]
[ROW][C]Estimated ARIMA Residuals[/C][/ROW]
[ROW][C]Value[/C][/ROW]
[ROW][C]2.28640729466096[/C][/ROW]
[ROW][C]229.260300864382[/C][/ROW]
[ROW][C]51.706595627264[/C][/ROW]
[ROW][C]-17.7657502532075[/C][/ROW]
[ROW][C]-298.403492286344[/C][/ROW]
[ROW][C]528.230711372948[/C][/ROW]
[ROW][C]-54.6884706593949[/C][/ROW]
[ROW][C]43.5204034963304[/C][/ROW]
[ROW][C]20.3099389455818[/C][/ROW]
[ROW][C]824.368736382142[/C][/ROW]
[ROW][C]-292.742871025013[/C][/ROW]
[ROW][C]-248.1088434933[/C][/ROW]
[ROW][C]123.81972162905[/C][/ROW]
[ROW][C]-491.691452057055[/C][/ROW]
[ROW][C]-53.603915501124[/C][/ROW]
[ROW][C]-265.606280614625[/C][/ROW]
[ROW][C]72.7639418787705[/C][/ROW]
[ROW][C]-164.462167719482[/C][/ROW]
[ROW][C]-73.4821667695423[/C][/ROW]
[ROW][C]-252.668142893607[/C][/ROW]
[ROW][C]-140.933317643804[/C][/ROW]
[ROW][C]46.7117441598196[/C][/ROW]
[ROW][C]-35.6350351732151[/C][/ROW]
[ROW][C]-117.335695103446[/C][/ROW]
[ROW][C]-97.1793077569849[/C][/ROW]
[ROW][C]-160.387785548652[/C][/ROW]
[ROW][C]80.5500078429984[/C][/ROW]
[ROW][C]-209.261283146182[/C][/ROW]
[ROW][C]-70.2703572747913[/C][/ROW]
[ROW][C]163.048306831435[/C][/ROW]
[ROW][C]-113.259203067155[/C][/ROW]
[ROW][C]-193.454405446209[/C][/ROW]
[ROW][C]-37.1805302362147[/C][/ROW]
[ROW][C]-143.345560746655[/C][/ROW]
[ROW][C]-110.360248646383[/C][/ROW]
[ROW][C]-170.637653211428[/C][/ROW]
[ROW][C]-110.258435458772[/C][/ROW]
[ROW][C]31.8263935086044[/C][/ROW]
[ROW][C]499.664670327903[/C][/ROW]
[ROW][C]135.916485409175[/C][/ROW]
[ROW][C]137.360652636982[/C][/ROW]
[ROW][C]-342.46238978452[/C][/ROW]
[ROW][C]-216.149669391275[/C][/ROW]
[ROW][C]2.61184736297653[/C][/ROW]
[ROW][C]65.5771362002418[/C][/ROW]
[ROW][C]229.145634817036[/C][/ROW]
[ROW][C]-218.156533787609[/C][/ROW]
[ROW][C]-277.908453700284[/C][/ROW]
[ROW][C]312.868628437989[/C][/ROW]
[ROW][C]-13.6937825227167[/C][/ROW]
[ROW][C]218.735960451935[/C][/ROW]
[ROW][C]266.497683475567[/C][/ROW]
[ROW][C]316.667085739709[/C][/ROW]
[ROW][C]-274.752177582598[/C][/ROW]
[ROW][C]-93.7677607448038[/C][/ROW]
[ROW][C]-219.890124695711[/C][/ROW]
[ROW][C]1.79972250131502[/C][/ROW]
[/TABLE]
Source: https://freestatistics.org/blog/index.php?pk=302408&T=2

Globally Unique Identifier (entire table): ba.freestatistics.org/blog/index.php?pk=302408&T=2

As an alternative you can also use a QR Code:  

The GUIDs for individual cells are displayed in the table below:

Estimated ARIMA Residuals
Value
2.28640729466096
229.260300864382
51.706595627264
-17.7657502532075
-298.403492286344
528.230711372948
-54.6884706593949
43.5204034963304
20.3099389455818
824.368736382142
-292.742871025013
-248.1088434933
123.81972162905
-491.691452057055
-53.603915501124
-265.606280614625
72.7639418787705
-164.462167719482
-73.4821667695423
-252.668142893607
-140.933317643804
46.7117441598196
-35.6350351732151
-117.335695103446
-97.1793077569849
-160.387785548652
80.5500078429984
-209.261283146182
-70.2703572747913
163.048306831435
-113.259203067155
-193.454405446209
-37.1805302362147
-143.345560746655
-110.360248646383
-170.637653211428
-110.258435458772
31.8263935086044
499.664670327903
135.916485409175
137.360652636982
-342.46238978452
-216.149669391275
2.61184736297653
65.5771362002418
229.145634817036
-218.156533787609
-277.908453700284
312.868628437989
-13.6937825227167
218.735960451935
266.497683475567
316.667085739709
-274.752177582598
-93.7677607448038
-219.890124695711
1.79972250131502


Parameters (Session):
par1 = Default ; par2 = 1 ; par3 = 0 ; par4 = 1 ; par5 = 12 ; par6 = White Noise ; par7 = 0.95 ;
Parameters (R input):
par1 = FALSE ; par2 = 0.9 ; par3 = 0 ; par4 = 1 ; par5 = 4 ; par6 = 3 ; par7 = 1 ; par8 = 2 ; par9 = 1 ;
R code (references can be found in the software module):
library(lattice)
if (par1 == 'TRUE') par1 <- TRUE
if (par1 == 'FALSE') par1 <- FALSE
par2 <- as.numeric(par2) #Box-Cox lambda transformation parameter
par3 <- as.numeric(par3) #degree of non-seasonal differencing
par4 <- as.numeric(par4) #degree of seasonal differencing
par5 <- as.numeric(par5) #seasonal period
par6 <- as.numeric(par6) #degree (p) of the non-seasonal AR(p) polynomial
par7 <- as.numeric(par7) #degree (q) of the non-seasonal MA(q) polynomial
par8 <- as.numeric(par8) #degree (P) of the seasonal AR(P) polynomial
par9 <- as.numeric(par9) #degree (Q) of the seasonal MA(Q) polynomial
armaGR <- function(arima.out, names, n){
try1 <- arima.out$coef
try2 <- sqrt(diag(arima.out$var.coef))
try.data.frame <- data.frame(matrix(NA,ncol=4,nrow=length(names)))
dimnames(try.data.frame) <- list(names,c('coef','std','tstat','pv'))
try.data.frame[,1] <- try1
for(i in 1:length(try2)) try.data.frame[which(rownames(try.data.frame)==names(try2)[i]),2] <- try2[i]
try.data.frame[,3] <- try.data.frame[,1] / try.data.frame[,2]
try.data.frame[,4] <- round((1-pt(abs(try.data.frame[,3]),df=n-(length(try2)+1)))*2,5)
vector <- rep(NA,length(names))
vector[is.na(try.data.frame[,4])] <- 0
maxi <- which.max(try.data.frame[,4])
continue <- max(try.data.frame[,4],na.rm=TRUE) > .05
vector[maxi] <- 0
list(summary=try.data.frame,next.vector=vector,continue=continue)
}
arimaSelect <- function(series, order=c(13,0,0), seasonal=list(order=c(2,0,0),period=12), include.mean=F){
nrc <- order[1]+order[3]+seasonal$order[1]+seasonal$order[3]
coeff <- matrix(NA, nrow=nrc*2, ncol=nrc)
pval <- matrix(NA, nrow=nrc*2, ncol=nrc)
mylist <- rep(list(NULL), nrc)
names <- NULL
if(order[1] > 0) names <- paste('ar',1:order[1],sep='')
if(order[3] > 0) names <- c( names , paste('ma',1:order[3],sep='') )
if(seasonal$order[1] > 0) names <- c(names, paste('sar',1:seasonal$order[1],sep=''))
if(seasonal$order[3] > 0) names <- c(names, paste('sma',1:seasonal$order[3],sep=''))
arima.out <- arima(series, order=order, seasonal=seasonal, include.mean=include.mean, method='ML')
mylist[[1]] <- arima.out
last.arma <- armaGR(arima.out, names, length(series))
mystop <- FALSE
i <- 1
coeff[i,] <- last.arma[[1]][,1]
pval [i,] <- last.arma[[1]][,4]
i <- 2
aic <- arima.out$aic
while(!mystop){
mylist[[i]] <- arima.out
arima.out <- arima(series, order=order, seasonal=seasonal, include.mean=include.mean, method='ML', fixed=last.arma$next.vector)
aic <- c(aic, arima.out$aic)
last.arma <- armaGR(arima.out, names, length(series))
mystop <- !last.arma$continue
coeff[i,] <- last.arma[[1]][,1]
pval [i,] <- last.arma[[1]][,4]
i <- i+1
}
list(coeff, pval, mylist, aic=aic)
}
arimaSelectplot <- function(arimaSelect.out,noms,choix){
noms <- names(arimaSelect.out[[3]][[1]]$coef)
coeff <- arimaSelect.out[[1]]
k <- min(which(is.na(coeff[,1])))-1
coeff <- coeff[1:k,]
pval <- arimaSelect.out[[2]][1:k,]
aic <- arimaSelect.out$aic[1:k]
coeff[coeff==0] <- NA
n <- ncol(coeff)
if(missing(choix)) choix <- k
layout(matrix(c(1,1,1,2,
3,3,3,2,
3,3,3,4,
5,6,7,7),nr=4),
widths=c(10,35,45,15),
heights=c(30,30,15,15))
couleurs <- rainbow(75)[1:50]#(50)
ticks <- pretty(coeff)
par(mar=c(1,1,3,1))
plot(aic,k:1-.5,type='o',pch=21,bg='blue',cex=2,axes=F,lty=2,xpd=NA)
points(aic[choix],k-choix+.5,pch=21,cex=4,bg=2,xpd=NA)
title('aic',line=2)
par(mar=c(3,0,0,0))
plot(0,axes=F,xlab='',ylab='',xlim=range(ticks),ylim=c(.1,1))
rect(xleft = min(ticks) + (0:49)/50*(max(ticks)-min(ticks)),
xright = min(ticks) + (1:50)/50*(max(ticks)-min(ticks)),
ytop = rep(1,50),
ybottom= rep(0,50),col=couleurs,border=NA)
axis(1,ticks)
rect(xleft=min(ticks),xright=max(ticks),ytop=1,ybottom=0)
text(mean(coeff,na.rm=T),.5,'coefficients',cex=2,font=2)
par(mar=c(1,1,3,1))
image(1:n,1:k,t(coeff[k:1,]),axes=F,col=couleurs,zlim=range(ticks))
for(i in 1:n) for(j in 1:k) if(!is.na(coeff[j,i])) {
if(pval[j,i]<.01) symb = 'green'
else if( (pval[j,i]<.05) & (pval[j,i]>=.01)) symb = 'orange'
else if( (pval[j,i]<.1) & (pval[j,i]>=.05)) symb = 'red'
else symb = 'black'
polygon(c(i+.5 ,i+.2 ,i+.5 ,i+.5),
c(k-j+0.5,k-j+0.5,k-j+0.8,k-j+0.5),
col=symb)
if(j==choix) {
rect(xleft=i-.5,
xright=i+.5,
ybottom=k-j+1.5,
ytop=k-j+.5,
lwd=4)
text(i,
k-j+1,
round(coeff[j,i],2),
cex=1.2,
font=2)
}
else{
rect(xleft=i-.5,xright=i+.5,ybottom=k-j+1.5,ytop=k-j+.5)
text(i,k-j+1,round(coeff[j,i],2),cex=1.2,font=1)
}
}
axis(3,1:n,noms)
par(mar=c(0.5,0,0,0.5))
plot(0,axes=F,xlab='',ylab='',type='n',xlim=c(0,8),ylim=c(-.2,.8))
cols <- c('green','orange','red','black')
niv <- c('0','0.01','0.05','0.1')
for(i in 0:3){
polygon(c(1+2*i ,1+2*i ,1+2*i-.5 ,1+2*i),
c(.4 ,.7 , .4 , .4),
col=cols[i+1])
text(2*i,0.5,niv[i+1],cex=1.5)
}
text(8,.5,1,cex=1.5)
text(4,0,'p-value',cex=2)
box()
residus <- arimaSelect.out[[3]][[choix]]$res
par(mar=c(1,2,4,1))
acf(residus,main='')
title('acf',line=.5)
par(mar=c(1,2,4,1))
pacf(residus,main='')
title('pacf',line=.5)
par(mar=c(2,2,4,1))
qqnorm(residus,main='')
title('qq-norm',line=.5)
qqline(residus)
residus
}
if (par2 == 0) x <- log(x)
if (par2 != 0) x <- x^par2
(selection <- arimaSelect(x, order=c(par6,par3,par7), seasonal=list(order=c(par8,par4,par9), period=par5)))
bitmap(file='test1.png')
resid <- arimaSelectplot(selection)
dev.off()
resid
bitmap(file='test2.png')
acf(resid,length(resid)/2, main='Residual Autocorrelation Function')
dev.off()
bitmap(file='test3.png')
pacf(resid,length(resid)/2, main='Residual Partial Autocorrelation Function')
dev.off()
bitmap(file='test4.png')
cpgram(resid, main='Residual Cumulative Periodogram')
dev.off()
bitmap(file='test5.png')
hist(resid, main='Residual Histogram', xlab='values of Residuals')
dev.off()
bitmap(file='test6.png')
densityplot(~resid,col='black',main='Residual Density Plot', xlab='values of Residuals')
dev.off()
bitmap(file='test7.png')
qqnorm(resid, main='Residual Normal Q-Q Plot')
qqline(resid)
dev.off()
ncols <- length(selection[[1]][1,])
nrows <- length(selection[[2]][,1])-1
load(file='createtable')
a<-table.start()
a<-table.row.start(a)
a<-table.element(a,'ARIMA Parameter Estimation and Backward Selection', ncols+1,TRUE)
a<-table.row.end(a)
a<-table.row.start(a)
a<-table.element(a,'Iteration', header=TRUE)
for (i in 1:ncols) {
a<-table.element(a,names(selection[[3]][[1]]$coef)[i],header=TRUE)
}
a<-table.row.end(a)
for (j in 1:nrows) {
a<-table.row.start(a)
mydum <- 'Estimates ('
mydum <- paste(mydum,j)
mydum <- paste(mydum,')')
a<-table.element(a,mydum, header=TRUE)
for (i in 1:ncols) {
a<-table.element(a,round(selection[[1]][j,i],4))
}
a<-table.row.end(a)
a<-table.row.start(a)
a<-table.element(a,'(p-val)', header=TRUE)
for (i in 1:ncols) {
mydum <- '('
mydum <- paste(mydum,round(selection[[2]][j,i],4),sep='')
mydum <- paste(mydum,')')
a<-table.element(a,mydum)
}
a<-table.row.end(a)
}
a<-table.end(a)
table.save(a,file='mytable.tab')
a<-table.start()
a<-table.row.start(a)
a<-table.element(a,'Estimated ARIMA Residuals', 1,TRUE)
a<-table.row.end(a)
a<-table.row.start(a)
a<-table.element(a,'Value', 1,TRUE)
a<-table.row.end(a)
for (i in (par4*par5+par3):length(resid)) {
a<-table.row.start(a)
a<-table.element(a,resid[i])
a<-table.row.end(a)
}
a<-table.end(a)
table.save(a,file='mytable1.tab')